The main category of Forex News.
You can use the search box below to find what you need.
[wd_asp id=1]
The main category of Forex News.
You can use the search box below to find what you need.
[wd_asp id=1]
At the same time, the UK economy showed strong growth in the second quarter, rebounding from a mild recession last year. However, public sector borrowing in July reached £3.101 billion ($4.04 billion), the highest for that month since 2021, highlighting the financial challenges facing the new finance minister. On another front, investors are also monitoring insights from Federal Reserve Chairman Jerome Powell’s speech at the Jackson Hole symposium on Friday.
According to stock trading platforms, British stocks have stabilized. According to trading data, the FTSE 100 index of British shares was largely unchanged on Wednesday, after falling 1% the previous day. Mining stocks led the gains, with shares of Rio Tinto, Fresnillo, Glencore, and Anglo American rising by more than 1%. Also, shares of the sports betting giant Entain rose by more than 1.5%.
However, AstraZeneca shares fell by more than 0.5%, and the two oil giants Shell and BP suffered losses. New data showed that UK public sector borrowing reached £3.1 billion in July, exceeding expectations and increasing by £1.8 billion from the previous year. This borrowing figure exceeded expectations and was £4.7 billion higher than previous forecasts.
Also, the performance of the GBP/USD currency pair was affected by the content of the minutes of the Federal Reserve’s latest meeting. Likewise, many Federal Reserve officials acknowledged that a case could be made for cutting US interest rates before the central bank’s policy committee voted unanimously to keep rates unchanged.
The meeting minutes, released on Wednesday in Washington, added: “Several noted that the recent progress on inflation and the increase in the unemployment rate provided a reasonable case for reducing the target range by 25 basis points at this meeting or that they might have supported such a decision. A large majority noted that if incoming data evolved as expected, it would likely be appropriate to ease policy at the next meeting.”
The meeting record highlights a growing sense among policymakers that the risks to achieving the goals of inflation and employment are now roughly balanced, even with borrowing costs remaining at their highest levels in two decades. Federal Reserve Chairman Jerome Powell said in a press conference on July 31 that the committee is looking for “greater confidence” that inflation is moving towards its 2% target before starting to cut rates.
The minutes added: “A majority of participants noted that the risks to the employment objective had increased, and several participants noted that the risks to the inflation objective had decreased.” Added, “Some participants noted the risk that further gradual easing in labor market conditions could translate into a more serious deterioration.”
Overall, the discussion indicates that the committee has begun to shift towards a risk management approach regarding the labor market. Meanwhile, a 25-basis point cut in September would represent a small adjustment towards normalization, many analysts say the Fed needs to move at a faster pace of cuts to ensure a soft landing for the US economy.

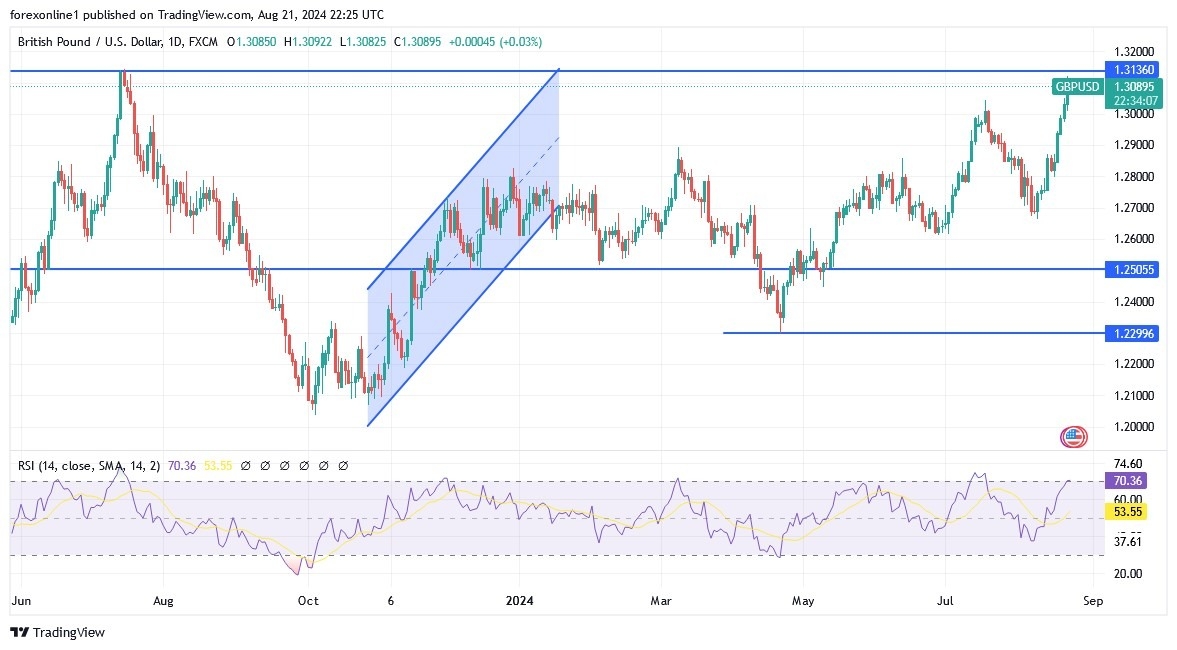
According to the performance on the daily chart below, the price of the British pound against the US dollar GBP/USD is on a strong upward path. Also, its gains above the resistance of 1.3100 are enough to push the technical indicators towards strong overbought levels. As result, It is better to sell the GBP/USD pair from the resistance levels of 1.3130 and 1.3200 respectively without risk. On the other hand, and in the same time frame, returning towards the support level of 1.2880 will be important for the bears to regain control of the trend. Today, the GBP/USD pair will react with the announcement of the readings of the purchasing managers index for the manufacturing and services sectors for both Britain and the United States of America. Also, the statements of the Governor of the US Federal Reserve Bank on Friday.
Ready to trade our daily Forex forecast? Here’s some of the best forex broker UK reviews to check out.
Also, this was supported by research from Bank of Japan staff that indicated inflationary pressures in the Japanese economy are expected to persist. Meanwhile, Bank of Japan Governor Kazuo Ueda is due to testify before the Japanese parliament on Friday as lawmakers examine the central bank’s decision to raise interest rates in July. Elsewhere, minutes from the latest Federal Reserve meeting indicated that policymakers agreed that a rate cut would be appropriate in September if the US economy continues to contract, adding pressure to the USD/JPY pair.
On the stock trading platform front, Japanese stocks fell as the yen strengthened. The Nikkei 225 index fell 0.29% to close at 37,952 while the broader TOPIX lost 0.21% to close at 2,665 on Wednesday, giving up some of the previous session’s gains as the yen resumed its rally, weighing on domestic stocks. Clearly, a stronger yen hurts earnings prospects for Japan’s export-dependent industries and forces investors to unwind carry trades.
Meanwhile, Japanese stocks recorded losses on Wall Street overnight as investors turned cautious ahead of the latest minutes of the Federal Reserve’s monetary policy meeting. On the economic front, data showed that Japan’s trade deficit widened in July as exports grew less than expected while imports accelerated. According to trading data, technology stocks led the decline, with sharp losses from Lasertec shares (-3.2%), Disco Corp shares (-2.8%), Tokyo Electron shares (-1.4%), Advantest shares (-2%), and Renesas Electronics shares (-1.6%).
On the US labor market front, the latest revision by the Bureau of Labor Statistics showed that US job growth for the year ending March 2024 was weaker than initially reported, with 818,000 fewer jobs added. This significant downward revision suggests that the labor market has been cooling more quickly than previously thought, with an average of 68,000 fewer jobs per month. In early August, the Bureau of Labor Statistics reported that the US economy added 114,000 jobs in July 2024, well below the downwardly revised 179,000 in June and expectations of 175,000.
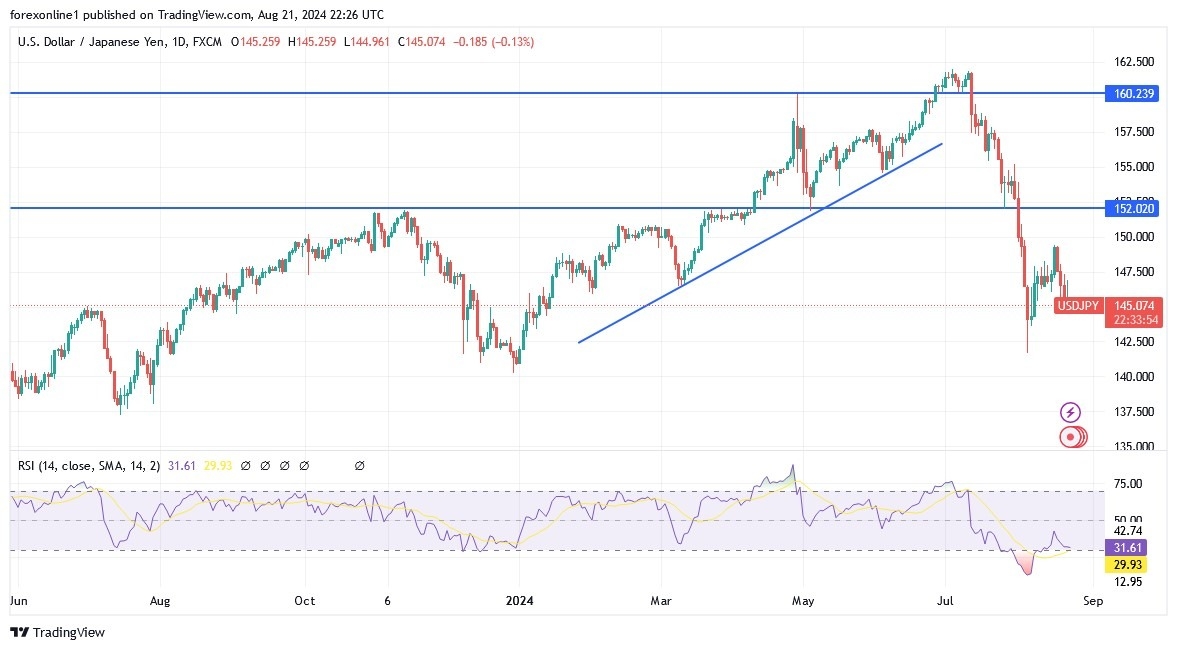
Based on the daily chart below, the bearish trend in USD/JPY is getting stronger and the most important support levels for more bear control will be 143.80 and 142.00 respectively. As we mentioned before, the psychological resistance at 150.00 will remain the most important for bulls to control the trend. Technically, the currency pair may remain in its current performance until the reaction to the comments of the US Federal Reserve Chairman Jerome Powell during the Jackson Hole Symposium.
Ready to trade our daily Forex analysis? We’ve made this forex brokers list for you to check out.
Gold price (XAU/USD) broke multiple records between March and August 2024, and it is going on to register all-time highs of $2,531 per ounce on August 20 at the spot market. The yellow metal’s propulsion this year has mostly been as a result of the geopolitical risk in the Middle East fand soft US macroeconomic data, which have combined to raise prospects of up to three Fed interest rate cuts, starting September 2024. Notably, its price trajectory beginning June was also contrarian, rising when inflation was cooling in United States and Europe.
That said, gold prices were down by 1.25 percent on the daily chart as of this writing to trade at $2,480 per ounce in the spot market, as buyers tamed their appetite ahead of a highly awaited speech by Federal Reserve Chairman Jerome Powell. The Fed Chair is expected to give guidance on the extent of the anticipated rate cuts, with the debate ranging widely from lows of 50-to-100 basis points in the last third of the year.
Also, the safe haven demand for the precious metal bubbles under as the Israel-Hamas war takes a new dimension, with ceasefire talks making minimal gains in August. However, China’s move to pause purchases in May, June, and July has put a lid on demand-side gold price rise.
The US dollar has eased down in August as a series of soft macroeconomic data weighed in. First, the Nonfarm Payroll (NFP) data showed that 114,000 jobs were created in July, substantially lower than the forecast figure of 175,000. Also, the PCE and CPI readings had headed down for successive months beginning May. Furthermore, unemployment rate US rose from April through July, triggering recession fears in early August.
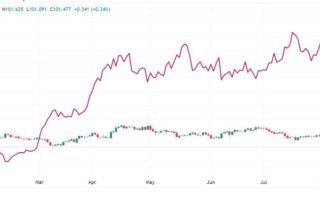
In the wake of these figures, the dollar has weakened against major world currencies. The DXY index, which weighs the greenback against a composite of six other currencies, slid to year-to-date lows of 100.92 on August 21st.
US Treasuries are substitutes for gold as far as safe-haven investments go and falling rates on these assets have tilted the scales in favour of the yellow metal. As of this writing, yields on the benchmark 10-year bonds were at 3.86%, losing their ground against non-yielding gold. This will likely supply upward propulsion on the XAUUSD trading pair in the near-to-middle term.
Please note that the original article was published in September 2022. However, we update it regularly to incorporate all the latest information. You are also welcome to join my free Telegram group for up-to-date analysis on Gold & Bitcoin.
The US dollar sits precariously after the US economy released a series of weak data in recent weeks. A rise in the unemployment rate, a decline in NFP jobs and a higher-than-expected initial jobless claims filings underline the rising pressure on the US dollar and support for gold’s upside.
In the latest case, Initial Jobs Claims figures came in at 232,000 in the week ending August 17, matching analysts’ forecast figure. This has raised hopes of potential 50 basis points cut in September. The Federal Reserve is expected to announce its first rate cut from the four-year-old 5.25%- 5.50% rate in its September decision, and that rate is expected to spur investor appetite for gold.
Elsewhere, China did not buy gold for the third successive month in July. The country’s central bank had been on a buying spree that saw it import gold for 18 straight months to April 2024, as it sought to cushion itself against the downside of overexposure to the the dollar. China currently holds about 2,264 metric tonnes of gold, constituting about 4.9 percent of her forex reserves, the highest ever on record.
China’s economy flashed signs of contraction for the three-month period to July, with its Purchasing Managers Index (PMI) readings below the 50 percent mark in each of the three months. Coupled with recent soft US economic data, the trend could trigger a spike in the demand for safe-haven gold.
Furthermore, there has been a notable increase in retail purchases of gold amid a troubled property market. These developments have combined to provide upside propulsion to gold prices and will likely continue to provide support in the mid-term.
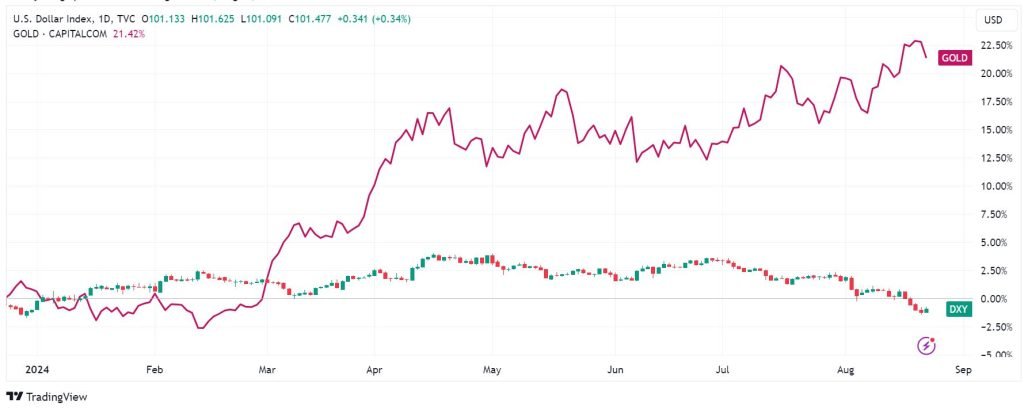
The dollar strength index tracks the strength of the USD against a basket of major global currencies. This index has recently hit YTD lows of 100.15 and could go lower. In the event the DXY index drops below 100 points, it is very hard to see gold below $2,500.
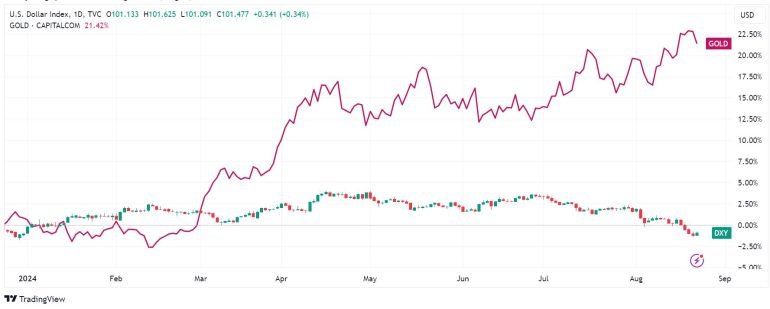
DXY Chart
In August 2020, gold price rallied to an all-time high of $2,072.85, surpassing the previous record high of $1,924.77 it hit nine years before. With the subsequent decline, the psychologically crucial zone of $2,000 has remained evasive. However, it has remained above $1,600 since rising above it at the peak of the coronavirus pandemic in April 2020.
Gold price crashed to $1,616 on September 28, 2022. This price was about 21.88% from its highest point in 2022. This crash coincided with a period when the Federal Reserve was hiking interest rates aggressively in a bid to fight soaring inflation. It then started rising after signs emerged that inflation was starting to ease in the US.
Bullion has performed really well this year. The precious metal is up by 20.4 percent YTD, and at +3.6 percent in the last month. This has created a strong bullish undercurrent that could drive more gains in the second half of the year, especially in light of the impending Fed interest rate cuts. On the chart below, note the strong upside momentums above the $2,000 psychological level and the $2,289 marks. These could potentially serve as the near-term and medium-term support marks.
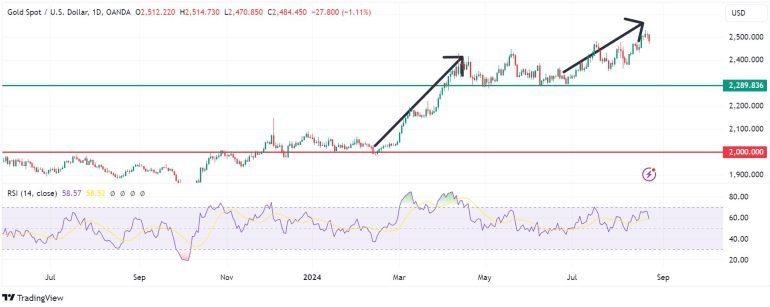
XAU/USD Historical Chart
I accurately predicted that gold would hover around past the $2,300 mark in my previous forecasts.
As the price now seems to have gained strength above $2400, the pivot point will likely be at $2,502, while the immediate resistance could come at $2,525. Therefore, a break above that mark could strengthen bullishness. Furthermore, the commodity finds initial support around 2,475. A break below that mark could signal bearishness. Safe haven buying is likely to be the biggest contributor to the bullish outlook, as geopolitical risk rises in the Middle East, but better-than-expected US economic data could limit the upside for gold.
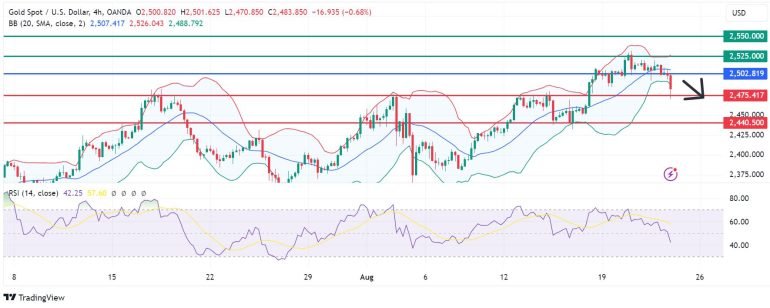
XAU/USD Latest Technical Analysis
I’ll keep posting my updated outlook on Gold and other assets in my free Telegram group, which you’re welcome to join.
The gold price forecast 2025 is largely an extrapolation of the influential factors in the current year. At the beginning of the year, Goldman Sachs indicated that the commodities bull market observed in the past year will likely continue into the current year and beyond. Indeed, the investment bank holds that the commodities Supercycle will last for about 10 years.
The precious metal may reach new all-time highs above $2,200 an ounce based on this narrative. In addition, a tighter Fed policy and subsequent decline in economic growth will likely boost its performance as a risk-on asset.
However, even with the bullish gold price forecast 2025, competition from Bitcoin as a store of value may limit its upward potential.
A feasible gold price forecast 2030 is founded on US dollar movements due to the existing inverse correlation. In the event of geopolitical tensions, gold may find some support in its status as a safe haven. However, its upward momentum may be limited by a rise in the demand for the greenback.
Over the past eight years, gold price has risen by about 60%. However, an assumption that the bull market will continue over the next eight years makes a surge of 50% viable. In that case, the gold price forecast for 2030 will be for the precious metal to hit a high of about $2,700 an ounce.
One of the viable ways to invest in gold is by buying bullion. It may be in coins or bars, certified with purity and weight have. Then, one can purchase or sell the physical gold to a reputable dealer. However, security reasons often lead some investors to embrace the route of futures and options.
One of the best ways to invest in gold is through stocks. In the past few years, mergers and acquisitions in the sector has led to a significant consolidation in the sector. Today, only a few large companies dominate the industry.
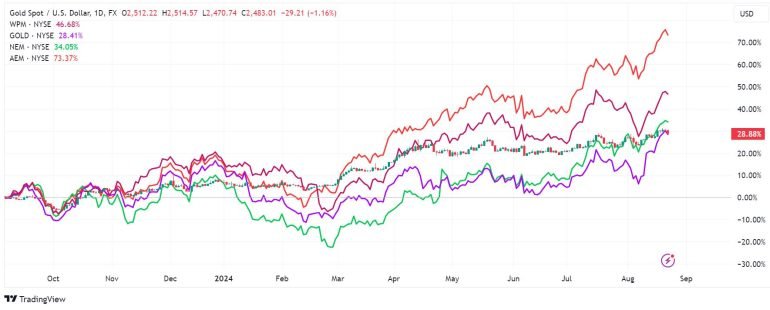
Barrick Gold, a company valued at $30 billion, is one of the best gold stocks to invest in. Its stock has dropped by about 7.95%. The other excellent stock to buy is Wheaton Precious Metals, which is worth over $17 billion. Unlike other gold companies, Wheaton does not do the real mining. Instead, the company has purchased rights for key gold assets.
The other best gold stocks to invest in are Newmont Corporation, and Agnico Eagle mine. The chart below shows the performance of some of the biggest gold stocks in the industry.
Gold stocks chart
Futures are a contract in which one agrees to buy or sell the financial asset at the agreed-upon price before the expiry of the contract. For options, the investor has a chance and not an obligation to buy or sell the underlying instrument for as long as the contract is valid. To invest in gold via futures and options, one needs an account with a reputable financial broker. It is possible to trade in gold for a commission through the brokerage account.
ETFs and mutual funds are yet another viable way to invest in gold. A share of this financial instrument represents a specific amount of gold. One needs a brokerage account to trade in gold ETFs or mutual funds, like in futures and options.
In addition to the aforementioned ways of investing in gold, an investor can consider buying stocks of gold mining companies like Barrick Gold Corp. (GOLD) or Newmont Corp. (NEM). While the share price is usually correlated to gold price, the firm’s fundamentals are also influential.
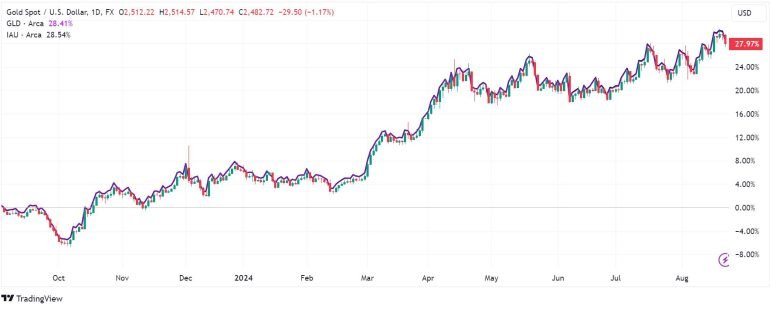
The chart below shows two of the most popular gold ETFs, the iShares Gold Trust and SPDR Gold Trust. As you can see, these ETF tend to move in sync with gold prices.
Gold ETF SPDR Gold Chart
As was the case in 2021, gold’s relation with inflation has mixed. In 2024, the trend will likely continue as inflationary pressures continue to boost the precious metal. In addition, geopolitical tension in the Middle East and the Russia-Ukraine war will continue providing safe haven tailwinds. Furthermore, Fed interest rate decisions in Starting September will have a substantial impact on gold’s upward potential.
The EUR/USD pair has surged to levels not seen since December 2023, with the US dollar under intense strain. Discover more insights in our analysis as of August 22, 2024.
On Thursday, the EUR/USD rate surged to 1.1105, reaching levels last seen in December 2023. The primary driver behind the US dollar’s decline is the Federal Reserve’s increasingly dovish outlook. Additionally, recent signs of a weakening employment market further weigh on the USD, as investors now anticipate the Fed will move towards easing monetary policy.
The latest minutes from the Federal Reserve’s July 30-31 meeting revealed a growing inclination among policymakers to lower interest rates, with some members favoring immediate action. The tone of the meeting was notably softer than expected, reinforcing expectations of potential rate cuts.
Further adding to the dollar’s troubles, data released by the Department of Labor yesterday showed fewer jobs were created than previously reported, exacerbating concerns about the US economy.
According to the CME FedWatch tool, markets are pricing in a 62% chance of a 25-basis-point rate cut at the Federal Reserve’s next meeting, with the likelihood of a larger 50-basis-point cut rising to 38%, up from 33% just a day earlier. Despite this, the EUR/USD forecast remains stable.
On the H4 chart, EUR/USD has broken above the 1.1135 level and completed a growth wave, pushing the rate up to 1.1173. The pair is expected to retest the 1.1135 level from above today, August 22, 2024. If this support level fails, it could lead to a decline towards 1.1073. However, a breakout above this range could open the door to further growth, with the next target set at 1.1195. After reaching this level, a reversal towards 1.1073 is anticipated, potentially extending the downward trend towards the next target of 1.0980.
The EUR/USD pair continues to rise, reaching new highs in 2024. Current technical indicators suggest that the upward momentum could extend to 1.1195, signaling the completion of this growth phase. A subsequent downward correction towards 1.1073 is likely, with the potential for further declines ahead.
Any forecasts contained herein are based on the author’s particular opinion. This analysis may not be treated as trading advice. RoboForex bears no responsibility for trading results based on trading recommendations and reviews contained herein.
This article is from an unpaid external contributor. It does not represent Benzinga’s reporting and has not been edited for content or accuracy.
This article is from an unpaid external contributor. It does not represent Benzinga’s reporting and has not been edited for content or accuracy.
Market News and Data brought to you by Benzinga APIs
© 2024 Benzinga.com. Benzinga does not provide investment advice. All rights reserved.
The U.S. dollar has bounced just a bit during the early hours on Wednesday as it looks like we are trying to sort out whether or not we are going to consolidate and bounce or if we are going to consolidate and break down.
With that being said, the market is likely to be very noisy and very difficult to get your hands on. But I do have a couple of areas that I’m watching. If we could turn around and take out the 150 yen level, then we could really start to pick upward momentum as the carry trade would be coming back.
That being said, if we were to turn around and break down below the 144 yen level, then we could see the market really start to fall apart. With this being said, the market is going to remain very noisy. And I also think that we have the situation where it’s quite possible that range bound traders will come in and take advantage of this, but it certainly looks like we have stabilized a bit. And I think that’s the thing you need to take away from here.
Late in the day on Wednesday, we get the FOMC meeting minutes. And I think a lot of people will be paying close attention to what the Fed’s going to do going forward. If we do, in fact, see something shocking that could really move the market, but if it’s what people think it’s going to be, then we still have to ask the questions about the carry trade, whether or not it can come back. Right now, it looks like we’re in this just somewhat malaise of a market.
For a look at all of today’s economic events, check out our economic calendar.
This article was originally posted on FX Empire
The EUR/USD outlook is optimistic as the dollar remains fragile after dovish Fed minutes. However, the euro fluctuated Thursday morning after mixed economic reports from the Eurozone.
-Are you interested in learning about the forex signals telegram group? Click here for details-
The general trend for EUR/USD remained up as Fed minutes confirmed expectations for a Fed rate cut in September. Policymakers were ready to start lowering borrowing costs if economic data met expectations. July inflation data came out after the Fed policy meeting and showed an expected easing to 2.9%. Therefore, there is little holding the Fed back from cutting interest rates. As a result, the dollar has collapsed, allowing the euro to reach new highs.
Meanwhile, data on Thursday showed that Eurozone business activity strengthened in August, further boosting the euro. The composite PMI rose from July’s 50.2 to 51.2, while economists had expected the figure to drop to 50.1. This report reduced pressure on the European Central Bank to cut interest rates.
However, a separate report revealed that negotiated wage growth in the Eurozone eased in the second quarter. The figure fell from 4.74% to 3.55%. This is a key measure for the ECB and affects the outlook for rate cuts. Slow wage growth reduces economic demand, piling pressure on the central bank to lower borrowing costs.
Currently, markets imply an over 90% likelihood of an ECB rate cut in September. Moreover, the central bank might cut again in December.
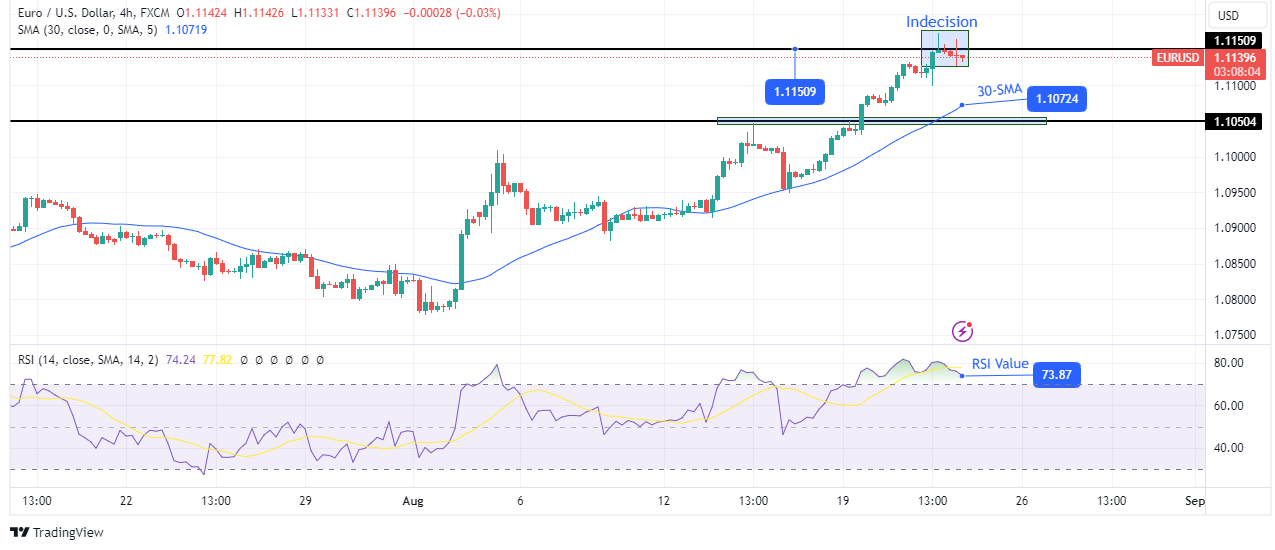
On the technical side, the EUR/USD price has paused its rally near the 1.1150 resistance level. Bulls have moved steeply from the 30-SMA, breaking above resistance levels. The bullish bias has strengthened with the price well above the 30-SMA and the RSI in the overbought region.
-If you are interested in forex day trading then have a read of our guide to getting started-
However, price action shows indecision at the 1.1150 level after such a strong move. The price has made small-bodied candles with large wicks, indicating that neither bears nor bulls are strong. It also indicates exhaustion of the previous move. Therefore, the price might soon fall to retest the 30-SMA support.
Looking to trade forex now? Invest at eToro!
67% of retail investor accounts lose money when trading CFDs with this provider. You should consider whether you can afford to take the high risk of losing your money.
After closing the fifth consecutive trading day in positive territory, GBP/USD continued to edge higher on Thursday and touched its strongest level since July 2023 near 1.3130. Although the pair’s technical outlook continues to highlight overbought conditions, upbeat PMI data from the UK seems to be helping Pound Sterling hold its ground.
The table below shows the percentage change of British Pound (GBP) against listed major currencies this week. British Pound was the strongest against the US Dollar.
| USD | EUR | GBP | JPY | CAD | AUD | NZD | CHF | |
|---|---|---|---|---|---|---|---|---|
| USD | -1.04% | -1.34% | -1.40% | -0.78% | -1.10% | -1.84% | -1.65% | |
| EUR | 1.04% | -0.38% | -0.32% | 0.27% | -0.15% | -0.97% | -0.64% | |
| GBP | 1.34% | 0.38% | -0.10% | 0.62% | 0.22% | -0.52% | -0.27% | |
| JPY | 1.40% | 0.32% | 0.10% | 0.54% | 0.26% | -0.33% | -0.39% | |
| CAD | 0.78% | -0.27% | -0.62% | -0.54% | -0.35% | -0.99% | -0.92% | |
| AUD | 1.10% | 0.15% | -0.22% | -0.26% | 0.35% | -0.66% | -0.49% | |
| NZD | 1.84% | 0.97% | 0.52% | 0.33% | 0.99% | 0.66% | 0.21% | |
| CHF | 1.65% | 0.64% | 0.27% | 0.39% | 0.92% | 0.49% | -0.21% |
The heat map shows percentage changes of major currencies against each other. The base currency is picked from the left column, while the quote currency is picked from the top row. For example, if you pick the British Pound from the left column and move along the horizontal line to the US Dollar, the percentage change displayed in the box will represent GBP (base)/USD (quote).
S&P Global/CIPS Composite PMI improved to 53.4 in August’s flash estimate from 51.9 in July, highlighting an ongoing expansion in the private sector’s business activity at an accelerating pace.
Assessing the PMI survey’s findings, “August is witnessing a welcome combination of stronger economic growth, improved job creation and lower inflation, according to provisional PMI survey data,” said Chris Williamson, Chief Business Economist at S&P Global Market Intelligence.
In the second half of the day, S&P will release preliminary August PMI data for the US. Investors expect the Composite PMI to retreat to 53.5 from 54.3 in July. A disappointing PMI reading close to, or below, 50 could revive fears over a downturn in the US economy and cause the US Dollar (USD) to continue to weaken against its rivals. On the flip side, a positive surprise could have the opposite impact on the USD’s valuation and make it difficult for GBP/USD to extend its rally.
GBP/USD trades near the upper limit of the ascending regression channel and the Relative Strength Index (RSI) indicator on the 4-hour chart stays above 80, reflecting overbought conditions.
On the upside, strong resistance area seems to have formed at 1.3130-1.3140 (upper limit of the ascending channel, July 13, 2023, high) before 1.3200 (psychological level, static level).
1.3100 (psychological level) aligns as interim support before 1.3075 (mid-point of the ascending channel) and 1.3030 (lower limit of the ascending channel).
The Pound Sterling (GBP) is the oldest currency in the world (886 AD) and the official currency of the United Kingdom. It is the fourth most traded unit for foreign exchange (FX) in the world, accounting for 12% of all transactions, averaging $630 billion a day, according to 2022 data. Its key trading pairs are GBP/USD, aka ‘Cable’, which accounts for 11% of FX, GBP/JPY, or the ‘Dragon’ as it is known by traders (3%), and EUR/GBP (2%). The Pound Sterling is issued by the Bank of England (BoE).
The single most important factor influencing the value of the Pound Sterling is monetary policy decided by the Bank of England. The BoE bases its decisions on whether it has achieved its primary goal of “price stability” – a steady inflation rate of around 2%. Its primary tool for achieving this is the adjustment of interest rates. When inflation is too high, the BoE will try to rein it in by raising interest rates, making it more expensive for people and businesses to access credit. This is generally positive for GBP, as higher interest rates make the UK a more attractive place for global investors to park their money. When inflation falls too low it is a sign economic growth is slowing. In this scenario, the BoE will consider lowering interest rates to cheapen credit so businesses will borrow more to invest in growth-generating projects.
Data releases gauge the health of the economy and can impact the value of the Pound Sterling. Indicators such as GDP, Manufacturing and Services PMIs, and employment can all influence the direction of the GBP. A strong economy is good for Sterling. Not only does it attract more foreign investment but it may encourage the BoE to put up interest rates, which will directly strengthen GBP. Otherwise, if economic data is weak, the Pound Sterling is likely to fall.
Another significant data release for the Pound Sterling is the Trade Balance. This indicator measures the difference between what a country earns from its exports and what it spends on imports over a given period. If a country produces highly sought-after exports, its currency will benefit purely from the extra demand created from foreign buyers seeking to purchase these goods. Therefore, a positive net Trade Balance strengthens a currency and vice versa for a negative balance.
Gold price is looking to build on the previous correction in Thursday’s Asian session, challenging the key $2,500 level. Gold traders resort to profit-taking ahead of the top-tier US Preliminary S&P Global business PMI data, which could throw fresh light on the US Federal Reserve (Fed) interest-rate outlook in the countdown to Chair Jerome Powell’s Jackson Hole appearance on Friday.
Besides, a profit-taking decline, Gold price is also bearing the brunt of a broad-based US Dollar (USD) recovery early Thursday, tracking the uptick in the US Treasury bond yields. The Greenback capitalizes on a negative shift in risk sentiment amid looming Chinese economic concerns and the Middle East geopolitical risks.
Markets also remain wary of lingering US recession fears, as they anticipate the flash S&P Global Manufacturing and Services PMI data later in the North American session. Additionally, they are adjusting their positions before Friday’s key even risk – Fed Chair Jerome Powell’s speech. Powell could use the Jackson Hole address to double down on the Fed’s dovish stance, recently highlighted by the Minutes of its July policy meeting published on Wednesday.
Most policymakers thought that “if the data continued to come in about as expected, it would likely be appropriate to ease policy at the next meeting,” the Minutes said. Further, the Minutes read that several of them would have even been willing to reduce borrowing costs in the July meeting itself.
The outrightly dovish Fed Minutes spelt doom for the US Dollar while lifting the demand for the US government bonds and the non-interest-bearing Gold price. This helped Gold price recover losses and settle modestly flat above $2,500 on Wednesday.
Earlier in the day, the US Labor Department said that Nonfarm Payrolls (NFP) for the period from April 2023 to March 2024 was lowered by 818,000. The revision represented a total downward change of about 0.5%, implying that monthly job gains during the period averaged roughly 174,000, compared to the previously reported figure of 242,000.
The NFP March benchmark revision added to the September Fed rate cut bets, weighing further on the Greenback across the board.
Markets are currently pricing in a 35% probability of 50 basis points (bps) cut at the Fed’s September 17-18 meeting and a 65% chance of a 25 bps reduction, according to the CME Group’s FedWatch Tool.
All eyes also remain centered on Fed Chairman Jerome Powell’s keynote speech in Jackson Hole on Friday for any hints on the likely size of a cut next month and whether borrowing costs are likely to be lowered at each subsequent policy meeting.
In the meantime, the Gold price downside could remain cushioned amid lingering tensions in the Middle East between Hamas and Israel after the latter did not agree to withdraw its troops from the Philadelphi corridor on the Egypt-Gaza border, Prime Minister Benjamin Netanyahu’s office said on Wednesday.
The short-term technical outlook for Gold price remains constructive, as buyers refuse to give up amid a symmetrical triangle breakout in play and a bullish 14-day Relative Strength Index (RSI)
The 14-day RSI points lower but holds well above the 50 level, currently near 63, suggesting that Gold price remains a ‘buy-the-dips’ trading opportunity.
If the Gold price retracement gathers steam, the immediate support is seen at Monday’s low of $2,486.
A breach of the latter will call for a test of the triangle resistance-turned-support, now at $2,467. Further south, the $2,450 psychological barrier will come to the rescue of Gold optimists.
Conversely, should Gold buyers recapture the record high of $2,532, the next relevant topside target is seen at the $2,550 level.
Acceptance above the latter could challenge the $2,600 round level en route to the triangle target, measured at $2,660.
The S&P Global Manufacturing Purchasing Managers Index (PMI), released on a monthly basis, is a leading indicator gauging business activity in the US manufacturing sector. The data is derived from surveys of senior executives at private-sector companies from the manufacturing sector. Survey responses reflect the change, if any, in the current month compared to the previous month and can anticipate changing trends in official data series such as Gross Domestic Product (GDP), industrial production, employment and inflation. A reading above 50 indicates that the manufacturing economy is generally expanding, a bullish sign for the US Dollar (USD). Meanwhile, a reading below 50 signals that activity in the manufacturing sector is generally declining, which is seen as bearish for USD.
Frequency: Monthly
Consensus: 49.6
Previous: 49.6
Source: S&P Global
(MENAFN– Daily Forex) The British pound has gone back and forth during the course of the trading session here on Monday as we continue to dance around the 190 yen level 190 yen level of course is a large round figure that a lot of people will pay attention to but itu0026#39;s not necessarily going to be the be all end all of the world here enough time, I do think the technical traders out there will be paying more attention to the 200 day EMA than anything else we can break above there, then I think that the British pound will really start to take off and we could see some upward momentum. Short-term pullback, see plenty of support near the 188 yen level, and then again down at the 183 yen level. Top Forex Brokers 1 Get Started 74% of retail CFD accounts lose money Read Review BrokerGeoLists({ type: u0027MobileTopBrokersu0027, id: u0027mobile-top-5u0027, size: 5, getStartedText: u0060Get Startedu0060, readReviewText: u0060Read Reviewu0060, Logo: u0027broker_carrousel_iu0027, Button: u0027broker_carrousel_nu0027, });Long-Term LevelsThose are both short-term support levels, but they should be somewhat important. Keep in mind that a lot of this comes down to the carry trade and whether or not it still exists, so therefore you do need to pay attention to the Japanese yen-related pairs across the board. Risk appetite is a major feature of what drives this as well, so if risk appetite picks up a little bit, I expect this GBP/JPY pair to do the same got absolutely hammered recently but a bit of a bounce makes a certain amount of sense. Now the question is, can we break back above the 200 day EMA? And if we can, then itu0026#39;s likely that we will continue to rally towards the 50 day EMA, perhaps even as high as the 200 yen level. I do think itu0026#39;s going to be noisy, but at the end of the day, you get paid to hang on to this pair, and thatu0026#39;s something that has not changed despite the fact that everybody had a freak out. Ultimately, this is a market that I think will continue to be hard to keep hanging onto, if you are heavily levered. However, if you keep your position size reasonable, you should do okay.
MENAFN20082024000131011023ID1108581509

On the downside, immediate support is found at $2.20, followed by $2.15 and $2.09, which is critical to watch if the price declines.
Technical indicators present a mixed outlook. The 50-day EMA is at $2.17, while the 200-day EMA stands at $2.31. These figures suggest a bearish outlook below the pivot point of $2.26. A break above this level could shift sentiment to a more bullish stance.