The main category of Forex News.
You can use the search box below to find what you need.
[wd_asp id=1]
The main category of Forex News.
You can use the search box below to find what you need.
[wd_asp id=1]
Gold price is on the front foot above $2,510 in Wednesday’s Asian trading, consolidating the previous upsurge to a new all-time high of $2,532. Gold traders take account of broad risk-aversion and refrain from placing fresh bets ahead of the Minutes of the US Federal Reserve (Fed) July meeting due later on Wednesday.
Gold price reversed Monday’s brief correction and jumped back on the bids on Tuesday, registering a fresh record high above the $2,500 level. The US Dollar downtrend extended alongside falling US Treasury bond yields, courtesy of dovish expectations from the US Federal Reserve (Fed) and the USD/JPY sell-off, aiding the Gold price rebound.
Markets expected that the Minutes of the Fed’s July meeting on Wednesday and Friday’s Fed Chair Jerome Powell’s speech at the Jackson Hole Symposium will double down on the central bank’s dovish stance, as disinflation remains in progress and the US economy stands resilient. This narrative weighed heavily on the Greenback even though risk sentiment took a hit.
Wall Street indices snapped their longest rally this year, as markets resorted to profit-taking in the lead-up to Wednesday’s Fed Minutes, closely watching expected annual Nonfarm Payrolls revisions from the Bureau of Labor Statistics (BLS) and Friday’s speech by Fed Chair Powell.
Bloomberg reported that economists “expect the government’s preliminary benchmark revisions on Wednesday to show payrolls growth in the year through March was at least 600,000 weaker than currently estimated — about 50,000 a month.”
“Such figures also have the potential of shaping the tone of Fed Chair Jerome Powell’s speech at week’s end in Jackson Hole, Wyoming,” Bloomberg added.
Risk-off flows extend into Asia this Wednesday, as all the regional indices tumble. A steep sell-off in China’s tech stocks leads the declines in the Asian stock markets. JD.com Inc. plunged as much as 12% after a report on Walmart Inc.’s planned stake sale. China’s property market and growth concerns also continue to haunt markets.
The US Dollar is unable to capitalize on risk-aversion, helping keep the USD-denominated Gold price afloat. An imminent Fed rate cut in September and looming geopolitical risks in the Middle East also pin Gold price near all-time highs.
Markets are currently pricing in a 69.5% likelihood of 25 basis points (bps) interest-rate cut at the Fed’s September policy meeting, with a 30.5% chance of a 50 bps cut, according to the CME Group’s FedWatch tool.
Meanwhile, the latest report from the World Gold Council (WGC) said that “anecdotal reports suggest that there has been strong buying interest from jewelry retailers as well as consumers since the duty reduction.” India’s recent import tax cut on Gold triggered a downtick in prices., fuelling demand for the bright metal.
The short-term technical outlook for Gold price remains constructive, as a symmetrical triangle breakout remains in play.
The 14-day Relative Strength Index (RSI) holds firm above the 50 level, currently near 66, suggesting that more gains remain in the offing for Gold price.
Should Gold buyers recapture the record high of $2,532, the next relevant topside target is seen at the $2,550 level. Acceptance above the latter could challenge the $2,600 round level en route to the triangle target, measured at $2,660.
However, if the Gold price faces rejection at higher levels, a correction could ensue targeting the immediate support seen at Monday’s low of $2,486.
A breach of the latter will call for a test of the triangle resistance-turned-support, now at $2,470. Further south, the $2,450 psychological barrier will challenge the bullish commitments.
FOMC stands for The Federal Open Market Committee that organizes 8 meetings in a year and reviews economic and financial conditions, determines the appropriate stance of monetary policy and assesses the risks to its long-run goals of price stability and sustainable economic growth. FOMC Minutes are released by the Board of Governors of the Federal Reserve and are a clear guide to the future US interest rate policy.
Frequency: Irregular
Consensus: –
Previous: –
Source: Federal Reserve
Later in the session on Wednesday, the FOMC Meeting Minutes will require investor consideration. Speculation about multiple 2024 Fed rate cuts has pulled the USD/JPY to 145.
Concerns about the US labor market and support for multiple rate cuts could affect US dollar demand. Comments on the size of a September rate cut may be crucial for the USD/JPY pair.
According to the CME FedWatch Tool, the probability of a 50 basis point September Fed rate cut was 24.5% on Tuesday, compared to 75.5% for a 25-basis point cut. A 50-basis point September rate cut could fuel speculation about a 100-basis point cut to the FFR in September, November, and December.
A more dovish Fed rate path may support a USD/JPY fall through 143.
Arch Capital Global Chief Economist Parker Ross remarked on the New York Fed’s latest Labor Market Survey, stating,
“Key Takeaway: There is growing concern about job loss and a corresponding decline in workers expecting to move to a new employer, particularly among workers aged 45 and under. The results of this survey are yet another reflection of how concerned consumers are about the labor market, even as the Fed has only recently declared it “balanced.”
A deteriorating US labor market may give the doves the upper hand, possibly supporting a more aggressive 50-basis point September rate cut.
USD/JPY trends will depend on trade data from Japan, upcoming services PMIs (Thurs), and central bank forward guidance. Positive data from Japan and support for a Q4 2024 BoJ rate hike could pull the USD/JPY below 143. Weak data from the US and rising bets on a 50-basis point September Fed rate cut may signal a fall toward 140.
Investors should remain alert. Monitor real-time data, central bank insights, and expert commentary to adjust your trading strategies accordingly. Stay updated with our latest news and analysis to manage USD/JPY volatility.
The USD/JPY sat well below the 50-day and 200-day EMAs, confirming the bearish price trends.
A USD/JPY breakout from the 145.891 resistance level would support a move toward 147.500. A return to 147.500 could give the bulls a run at the 148.529 resistance level and the trend line.
Economic indicators from Japan, the FOMC Meeting Minutes, and central bank commentary require consideration.
Conversely, a drop below 145 could give the bears a run at the 143.495 support level. A fall through the 143.495 support level may bring the 141.032 support level into play.
The 14-day RSI at 31.65 suggests a USD/JPY break below 145 before entering oversold territory.
Following today’s pullback natural gas should be ready to proceed higher. Monday’s low of 2.10 created a higher swing low relative to the early-August low of 1.88. It was the first pullback following a bullish reversal off the 2.10 bottom. In other words, it looks like an uptrend is still in its beginning stages to provide plenty of potential upside. The 20-Day line at 2.10 remains critical near-term support for the uptrend and provides the C point for a rising ABCD pattern.
Today’s weakness should be resolved to the upside given recent signs of strength in the price of natural gas including, breakout of falling wedge three weeks ago, rally above 20-Day MA followed by successful test of the line as support, and the advance above the interim swing high of 2.39 last week. Together, these indications show a strengthening trend.
A rally above today’s high of 2.25 will be a sign of strengthening that should be followed by a breakout above last week’s high of 2.30. Once that triggers the 200-Day MA at 2.32 becomes a target. However, notice that the 200-Day line has been slowly declining recently towards the 2.30 peak, putting it very close to last week’s high. Therefore, using the 200-Day line as a breakout level may provide greater confidence that a breakout would be followed by rising prices.
Above the 200-Day MA is the 50-Day MA at 2.36. It is confirmed by the 38.2% Fibonacci retracement at 2.36. If natural gas can rise above there it will likely look to complete an initial target for a rising ABCD pattern with the C leg beginning from the most recent swing low at support of the 20-Day MA.
For a look at all of today’s economic events, check out our economic calendar.
Domestically, investors absorbed economic data showing that Japan’s machinery orders, an indicator of capital spending, rose 2.1% month-on-month in June, exceeding expectations of a 1.1% increase. Markets are now looking to Japanese inflation figures later this week for clarity on the Bank of Japan’s monetary policy path. Overall, the Japanese yen (JPY) has risen against the US dollar (USD) for the second consecutive day, driven by hawkish sentiment surrounding the Bank of Japan (BoJ) and growing geopolitical tensions. Stronger-than-expected growth in Japan’s GDP in the second quarter has fueled expectations that the BoJ may consider raising interest rates in the near term, contributing to the yen’s appreciation.
According to the economic calendar results, data last week showed that Japan’s economy expanded by 0.8% on a quarterly basis in the second quarter, after contracting by 0.6% in the first quarter and beating expectations by 0.5%. On an annual basis, the economy grew by 3.1% in the second quarter, reversing from a 2.3% decline in the first quarter and beating expectations for a 2.1% growth.
On the stock trading platforms, Japanese stocks fall on profit-taking. According to Monday’s trading, the Nikkei 225 index of Japanese shares fell 1.77% to close at 37,388 points, while the broader TOPIX index lost 1.4% to 2,641 points, ending a five-day advance amid profit-taking and as the rising yen pressured domestic stocks. Also, the strong Japanese yen hurts the earnings outlook for Japan’s export-dependent industries and discourages investors from borrowing in the currency to invest in higher-yielding assets.
Also, investors digested data showing that Japan’s machinery orders, a proxy for capital spending, rose 2.1% on-month in June, beating expectations for a 1.1% gain. According to the trading, the heavyweights in the index such as Disco Corp (-4.7%), Tokyo Electron (-3.1%), SoftBank Group (-2.1%), Toyota Motor (-3.1%), and Fast Retailing (-2.6%) witnessed significant losses.

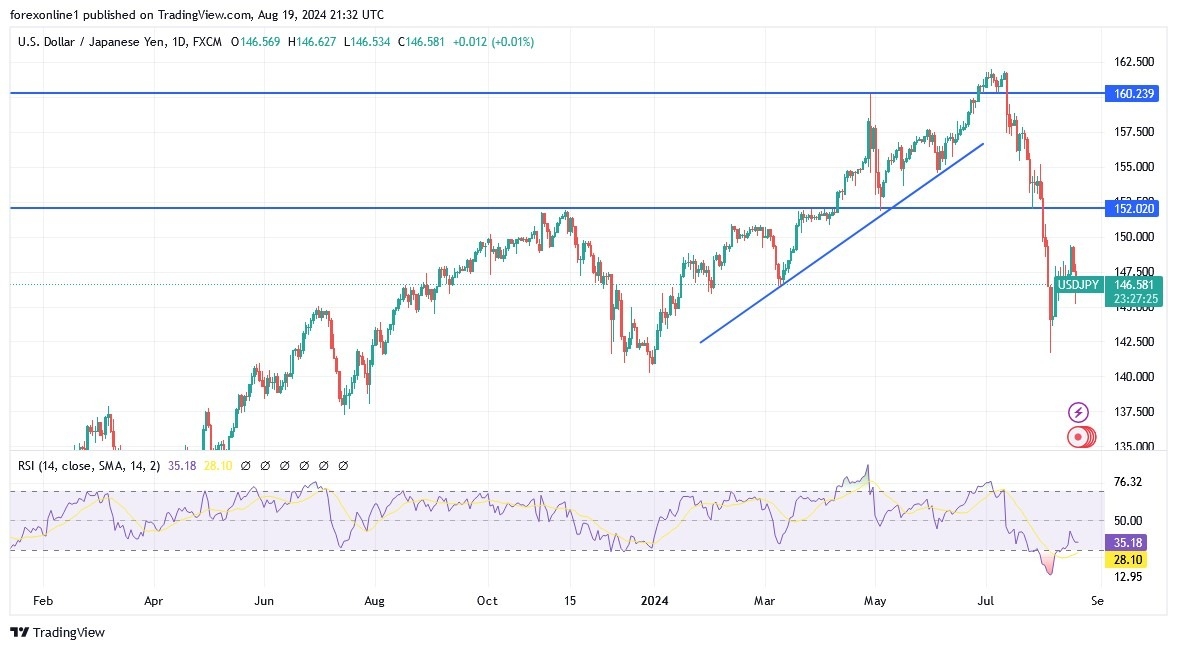
According to the performance on the daily chart, the USD/JPY price returned to its broader downward path. Technically, breaking the support of 144.00 will support the next stronger downward move towards the psychological support of 140.00, and before that. Also, the technical indicators will move towards strong oversold levels. On the other hand, and over the same period of time. furthermore, the psychological resistance of 150.00 will remain an important element for bulls to advance further. Ultimately, the USD/JPY pair may remain in its current bearish range until markets and investors react to the announcement of the minutes of the last US Federal Reserve meeting and what will be said by global central bank officials at the Jackson Hole symposium.
Want to trade our daily forex analysis and predictions? Here’s a list of forex brokers in Japan to check out.
Early Tuesday trading saw natural gas futures rise by a few cents as traders weighed mixed signals from the latest weather forecasts and production data. The outlook from NatGasWeather indicated moderate national demand through Friday, with stronger demand expected over the weekend due to a hotter-than-normal pattern across much of the U.S. This contrasts with milder conditions in the North and East, which are likely to temper overall demand.
Despite these forecasts, the natural gas market is grappling with an oversupply issue that continues to depress prices. Major producers, including EQT and Coterra Energy, have begun to scale back production, delaying new drilling projects and well connections to pipelines. These cutbacks are a response to persistently low prices, which have rarely been this depressed during peak summer demand.
Natural gas production in the lower 48 states has declined after peaking in July, with recent figures showing output at approximately 101 billion cubic feet per day (bcf/d), down from over 103 bcf/d last month. UBS analysts attribute the recent price decay to storage congestion risks, which have escalated as production surged in July. The market saw additional pressure from a temporary reduction in liquefied natural gas (LNG) exports due to Hurricane Beryl, though exports have since recovered.
Looking ahead, UBS analysts maintain a cautiously optimistic outlook for natural gas prices in 2025, assuming normal winter conditions. However, they warn that a milder-than-expected winter could dampen the anticipated price recovery. The expected increase in LNG export capacity from terminals like Plaquemines and Corpus Christi is likely to support stronger demand and potentially tighter market balances in the coming years.
Overall, while short-term conditions suggest continued volatility, the market may see a more sustained recovery as export capacity expands and production aligns with demand.
The US dollar has gone back and forth against the Japanese yen during the trading session on Tuesday, as we are trying to sort out what direction we are heading. That being said, I think this is a market that will continue to be very noisy, but I also recognize that we are in the midst of trying to determine whether or not the carry trade can come back or if it’s dead and gone. Ultimately, I do think the next few days will probably be more of the sideways chop that we have seen, so I’m not looking for much, but there are a couple of levels that I am paying close attention to.
If we can break above the 150 yen level, then I think you have the possibility of seeing this pair go much higher, perhaps reaching the 152 yen level followed by the 155 yen level. If we break down from here, then the 144 yen level will be support. Anything below there, then it starts to get somewhat dicey for the greenback. It’s worth noting that the US dollar is selling off against almost everything at the moment.
So, the fact that we can even hold our ground here is probably a good sign, but it’s still a bit early to make any major distinctions on that. I think we have sideways action ahead of us, but once we break out of this area and pass one of those levels, we should see this market really start to pick up momentum.
For a look at all of today’s economic events, check out our economic calendar.
This article was originally posted on FX Empire
Gold kept rallying throughout the first half of Tuesday, hitting an all-time high of $2,531.60 amid persistent US Dollar’s weakness and persistent demand for the safe-haven metal, particularly coming from Asia. Mounting expectations that the Federal Reserve (Fed) will trim interest rates, translating into further USD weakness, is pushing Chinese authorities and individual investors into Gold. The bright metal, however, changed course with Wall Street’s opening, and profit-taking is pushing XAU/USD towards the $2,500 mark.
Meanwhile, the positive tone of equities faded ahead of the European close, and most local indexes closed in the red. US indexes followed the negative lead and trade with modest losses, although not far from record highs. Overall, the sentiment remains upbeat, and the US Dollar is on the back foot despite XAU/USD intraday slump.
The focus on Wednesday will be on the Federal Open Market Committee (FOMC) Minutes. The document, usually released three weeks after the meeting, usually provides additional clues on policymakers’ thinking and upcoming decisions. Still, there’s a good chance the document will fall short of expectations and barely impact the USD, given that policymakers have shifted towards a more dovish tone since then. Market participants are pretty much convinced the Fed will trim rates in September, and the Minutes have no chance to change such belief.
The daily chart for the XAU/USD pair shows the pair has room to extend its gains, with the recent pullback from record highs seen as corrective. The pair keeps developing well above all its moving averages, which maintain bullish slopes. The Momentum indicator, however, retreated from its recent peak and heads firmly south within positive levels. Finally, the Relative Strength Index (RSI) indicator consolidates around 65. A steeper decline seems unlikely in this scenario.
The 4-hour chart suggests the ongoing retracement is far from confirming additional declines. Technical indicators have retreated sharply but hold well above their midlines. At the same time, moving averages maintain their upward slopes, with the 20 Simple Moving Average (SMA) currently at around $2,492.70 and the 100 SMA aiming higher at around$2,439.60.
Support levels: 2,496.40 2,485.10 2,427.20
Resistance levels: 2,510.00 2,523.50 2,535.00
For the US Federal Reserve, a 25bp cut in September is fully priced in, with a 24.5% chance of a larger 50bp cut and more than 90bp of easing expected by the end of the year. This week, attention turns to the Fed’s Jackson Hole symposium, where US central bank chairman Jerome Powell will speak on Friday, and in the UK, investors await the PMI readings and consumer confidence data from GfK.
On the electronic trading front, UK 10-year gilt yield hovers at a one-week high. By performance, the UK 10-year gilt yield was little changed, at a one-week high of 3.95%, as financial markets await US Federal Reserve Chairman Jerome Powell’s speech at the Jackson Hole symposium. In the UK, attention is focused on the upcoming PMI readings and GfK consumer confidence data. Economic resilience and moderate inflation have led traders to expect a smaller rate cut from the Bank of England than from the Fed.
Currently, Traders expect a 44bp rate cut from the BoE this year, with a 39% chance of a 25bp cut in September. For the Fed, a 25bp cut in September is fully priced in, with a 24.5% chance of a 50bp cut and more than 90bp of easing expected by the end of the year.
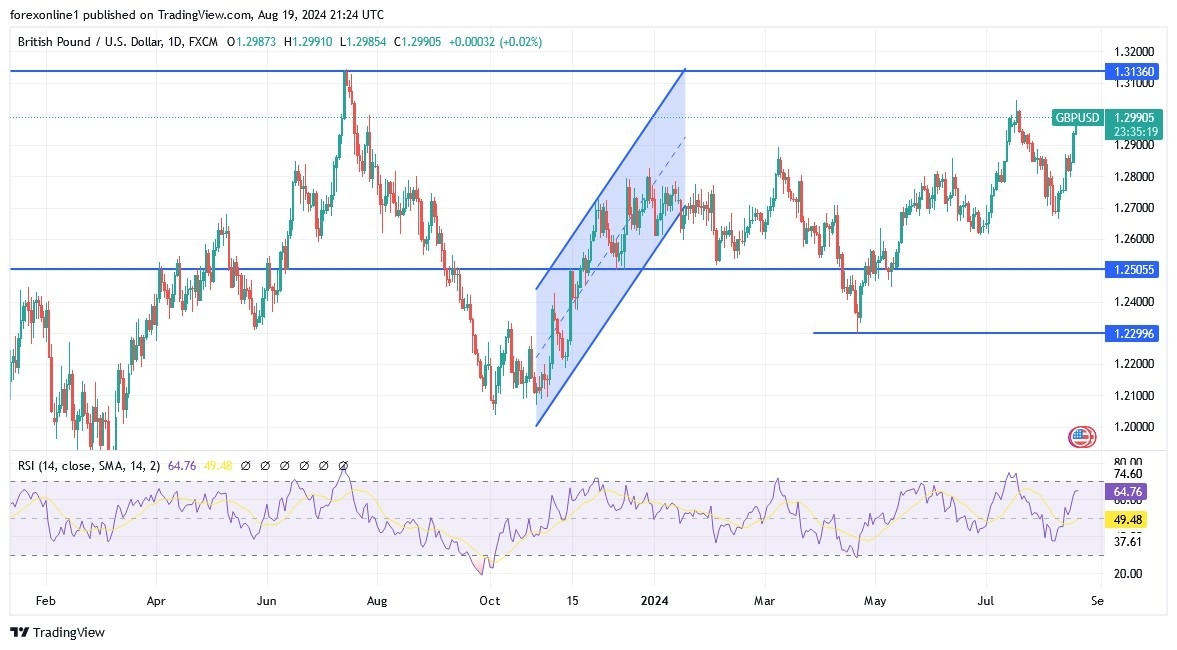
According to reliable trading platforms, the GBP/USD exchange rate has rebounded strongly from its early August losses, but both charts and economic fundamentals are consistent in indicating that further gains may remain possible in the future. Technically, the pound has regained multiple key levels on the charts against the US dollar last week in an extended rebound from its early August lows, including its 200-week moving average at 1.2845, and a 50% Fibonacci retracement of its July decline at 1.2857, and a 61.8% retracement of the same downward trend at 1.2901.
Nonetheless, it may have room to reclaim more lost ground, in part because US producer and consumer price figures last week suggested that more deflation was brewing, and with July retail sales figures and Thursday’s jobless claims data dampening concerns about the risk of a US or global recession.
According to the daily chart performance, the GBP/USD exchange rate is shown over daily periods with selected moving averages and black trendlines indicating a narrow symmetrical triangle, which indicates potential areas of technical support. While Fibonacci retracements of the July downward trend highlight potential technical resistances. With the UK’s economic story not playing a significant role, if any, in the heavy selling seen in the GBP/USD pair in late July and early August. Moreover, with the international issues that caused it currently receding, there may be room for the pound to rise further in the near term and possibly to the 78.6% retracement level of the July decline at 1.2965 or even higher.
This would highlight the year-to-date high at 1.3047, which is the last defense of the highest level recorded in July 2023 at 1.3145. furthermore, any breakthrough above this level in the near or medium term would indicate a continuation of the longer-term recovery from the September 2022 lows that stalled last summer.
Ready to trade our daily GBP/USD Forex forecast? Here’s some of the best forex broker UK reviews to check out
Important DisclaimersThe content provided on the website includes general news and publications, our personal analysis and opinions, and contents provided by third parties, which are intended for educational and research purposes only. It does not constitute, and should not be read as, any recommendation or advice to take any action whatsoever, including to make any investment or buy any product. When making any financial decision, you should perform your own due diligence checks, apply your own discretion and consult your competent advisors. The content of the website is not personally directed to you, and we does not take into account your financial situation or needs.The information contained in this website is not necessarily provided in real-time nor is it necessarily accurate. Prices provided herein may be provided by market makers and not by exchanges.Any trading or other financial decision you make shall be at your full responsibility, and you must not rely on any information provided through the website. FX Empire does not provide any warranty regarding any of the information contained in the website, and shall bear no responsibility for any trading losses you might incur as a result of using any information contained in the website.The website may include advertisements and other promotional contents, and FX Empire may receive compensation from third parties in connection with the content. FX Empire does not endorse any third party or recommends using any third party’s services, and does not assume responsibility for your use of any such third party’s website or services.FX Empire and its employees, officers, subsidiaries and associates, are not liable nor shall they be held liable for any loss or damage resulting from your use of the website or reliance on the information provided on this website.Risk DisclaimersThis website includes information about cryptocurrencies, contracts for difference (CFDs) and other financial instruments, and about brokers, exchanges and other entities trading in such instruments. Both cryptocurrencies and CFDs are complex instruments and come with a high risk of losing money. You should carefully consider whether you understand how these instruments work and whether you can afford to take the high risk of losing your money.FX Empire encourages you to perform your own research before making any investment decision, and to avoid investing in any financial instrument which you do not fully understand how it works and what are the risks involved.
The USD/CAD price analysis leans South as the Canadian dollar trades near a five-week high amid improved risk sentiment. At the same time, investors are awaiting Canada’s inflation report, which could shape the outlook for BoC rate cuts.
-Are you interested in learning about the forex signals telegram group? Click here for details-
The Canadian dollar rallied on Tuesday, making new highs as risk sentiment improved. The loonie gained with US equities due to optimism about the US economy. Last week, data dismissed fears that the US economy was on the verge of a recession. At the same time, Fed rate cut expectations improved the outlook for the economy, supporting Wall Street and the Canadian dollar.
Meanwhile, investors eagerly await Canada’s inflation report for more clues on the Bank of Canada’s rate cut outlook. Economists expect inflation to ease from 2.7% to 2.5% in July. The Bank of Canada has already implemented two rate cuts. If inflation continues cooling, the central bank might cut again in September.
On the other hand, the US dollar was weak as markets increasingly bet on a Fed rate cut in September. Inflation figures last week met expectations, showing a gradual decline to the Fed’s 2% target. As such, policymakers might be ready to signal a rate cut in September.
Traders will focus on Powell’s speech at the end of the week for guidance on the Fed’s policy outlook. Additionally, the FOMC meeting minutes will show policymakers’ stance on rate cuts and inflation.
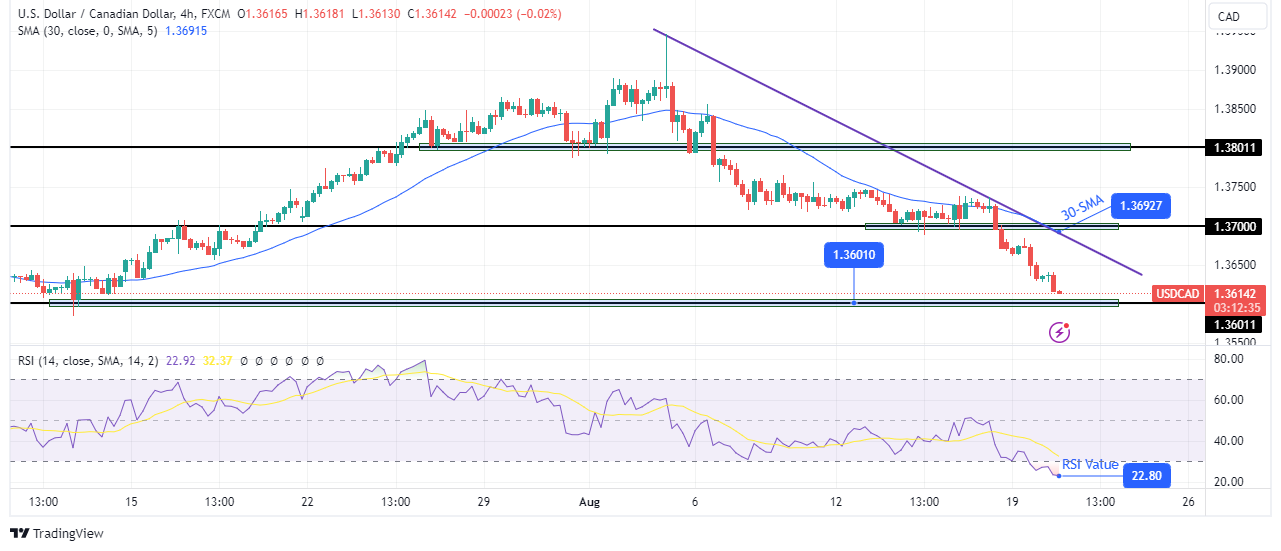
On the technical side, the USD/CAD price has fallen sharply after retesting the 30-SMA and breaking below the 1.3700 support level. The 30-SMA sits well above the price and points down, indicating a steep downtrend. Meanwhile, the RSI has fallen below 30 into the oversold region.
-If you are interested in forex day trading then have a read of our guide to getting started-
Given the solid bearish bias, the decline might soon challenge the 1.3601 support level. If the level holds firm, the price will pull back to retest the 30-SMA or its bearish trendline. On the other hand, if the level gives way, USD/CAD will make new lows, continuing the downtrend.
Looking to trade forex now? Invest at eToro!
67% of retail investor accounts lose money when trading CFDs with this provider. You should consider whether you can afford to take the high risk of losing your money.