The main category of Forex News.
You can use the search box below to find what you need.
[wd_asp id=1]
The main category of Forex News.
You can use the search box below to find what you need.
[wd_asp id=1]
The EUR/USD pair keeps reaching fresh 2024 highs, approaching the 1.1100 mark during European trading hours. An upbeat mood and the market’s conviction that the Federal Reserve (Fed) will pull the trigger in September put pressure on the US Dollar. As the date looms, global equities accelerate its momentum, with Asian and European indexes posting substantial gains, reflecting the optimistic sentiment.
Meanwhile, Germany released the July Producer Price Index (PPI), which rose 0.2% MoM while declining by 0.8% from a year earlier, in line with the market’s expectations. Additionally, the Eurozone confirmed that the Harmonized Index of Consumer Prices (HICP) rose 2.9% YoY in July. Finally, the EU reported that the June Current Account posted a seasonally adjusted surplus of €51 billion. The figures had no impact on the Euro.
The American session will bring no United States (US) data, although some Fed members will be on the wires. Should they pave the way for a September interest rate cut, the most likely outcome is additional USD weakness.
From a technical point of view, EUR/USD bullish route seems poise to continue. The daily chart shows that the pair extends its advance beyond all its moving averages, with the 20 Simple Moving Average (SMA) heading north almost vertically far below the current level while above the longer ones. Technical indicators, in the meantime, have lost their directional momentum and consolidate within overbought levels, not giving any other sign of upward exhaustion.
The 4-hour chart shows bulls maintain the pressure in the near term. The Relative Strength Index (RSI) indicator aims marginally higher at around 75, while the Momentum indicator consolidates as the pair hovers below its intraday high. Still, moving averages are clearly bullish, well below the current level, in line with buyers’ continued pressure.
Support levels: 1.1050 1.1020 1.0985
Resistance levels: 1.1090 1.1120 1.1160
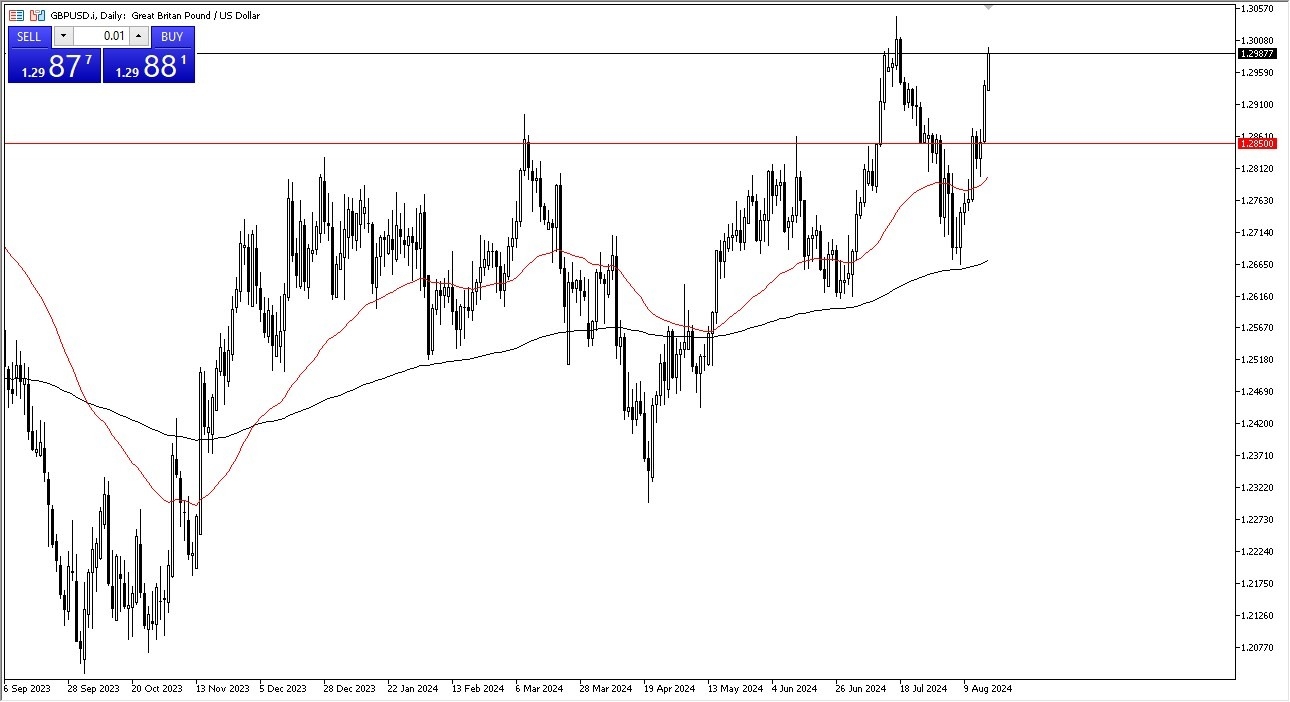
Short-term pullbacks will almost certainly be buying opportunities and I think that the 1.2850 level underneath is massive support Furthermore, you also have the 50-day EMA racing towards that area So I think it all ties together for a potential pullback and then bounce That being said if the market were to break above the 1.3050 level then the market could continue to go higher. Having said that we are a little overstretched at this point and it looks to me like it’s a situation where we probably need to find value hunters underneath.

All things being equal, this is a market that continues to be noisy and that will be the case going forward as traders around the world continue to worry about what’s going to happen with central banks. Furthermore, we are in the midst of getting ready for the Jackson Hole Symposium, and that will have speeches from both the head of the Federal Reserve and the head of the Bank of England.
So that could throw this pair into a little bit of disarray as well. I do think we’re overdone, and I do think that we pull back, but I don’t necessarily think that it’s going to end up being a shorting opportunity. Rather, I think you probably get a chance to buy the pound at a lower price if you’re just patient enough. That being said, it’s very difficult to time this move, but I certainly think that you will get an opportunity to pick up British pounds “on the cheap.”
Ready to start trading the GBP/USD forecasts? Start working with a Forex broker recommended in the UK here.
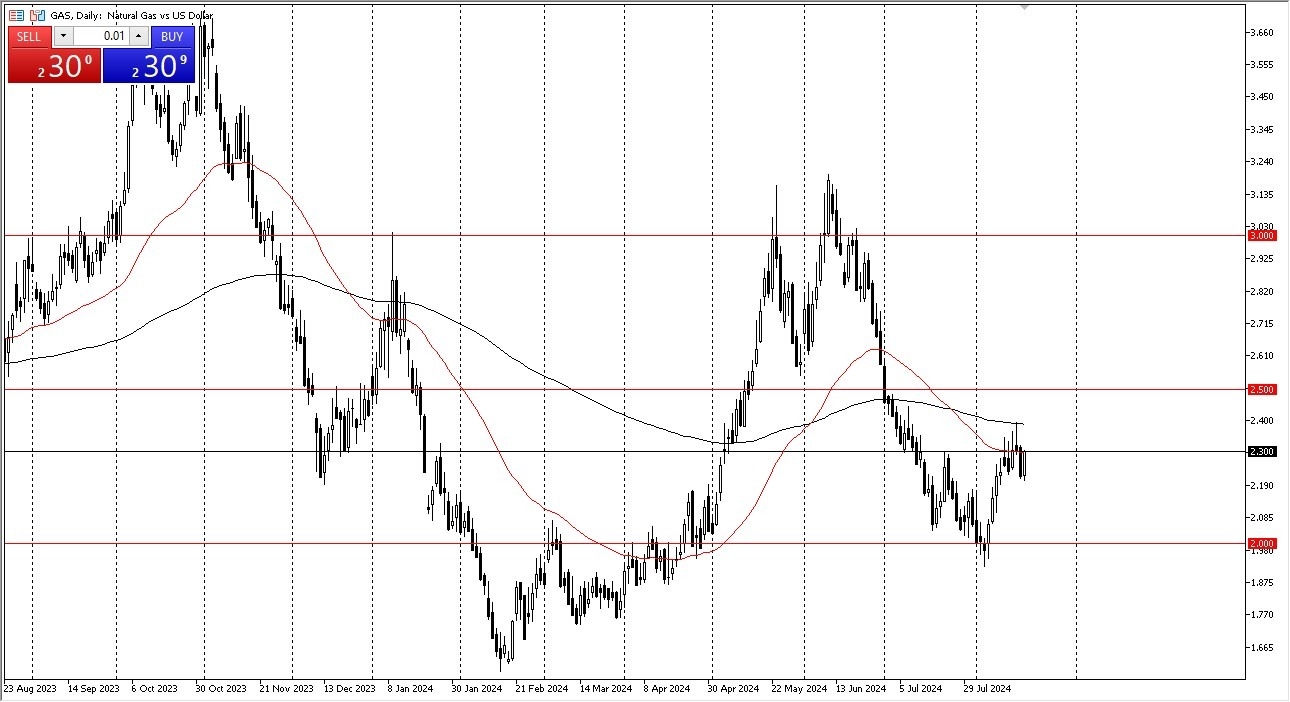
It’s important to notice that the last couple of candlesticks have produced shooting stars on the daily chart, so that does suggest that we have a lot of selling pressure above. This isn’t to say that the market can’t go higher, it’s just that there is obviously a lot of volatility and fighting going on at the moment. With that being the case, I think you got a situation where you have to pay close attention to the $2.40 level, which is also where we have the 200-Day EMA. The 200-Day EMA of course is a major indicator that a lot of technical traders will pay close attention to, and with that being the case it makes a certain amount of sense that we will continue to react to it.
However, if we were to break above the 200-Day EMA, it opens up the possibility of a move to the $2.50 level. The $2.50 level courses a large, round, psychologically significant figure, and is an area that a lot of people will be paying attention to as well. That being said, think you have got a situation where the market will be very noisy, and therefore I think you need to be cautious about your position size. Short-term pullbacks make a lot of sense, especially to the $2.25 level.
As for myself, I am bullish of this market over the longer-term, but I think of that as an investment, not a short-term trade. In other words, I am buying ETF positions so that I can avoid the leverage. If you do not have that ability, you can buy small CFD positions, but you need to understand that this is a cyclical trade, which means we will rise in price as people start to focus on cooler temperatures in the United States. This is something that happens every year, but quite frankly it’s hard to times so I just put a small portion of my portfolio in this market in mid to late summer and simply click prices after the first major spike.
Ready to trade daily Forex forecast? Here’s a list of some of the best commodities brokers to check out.
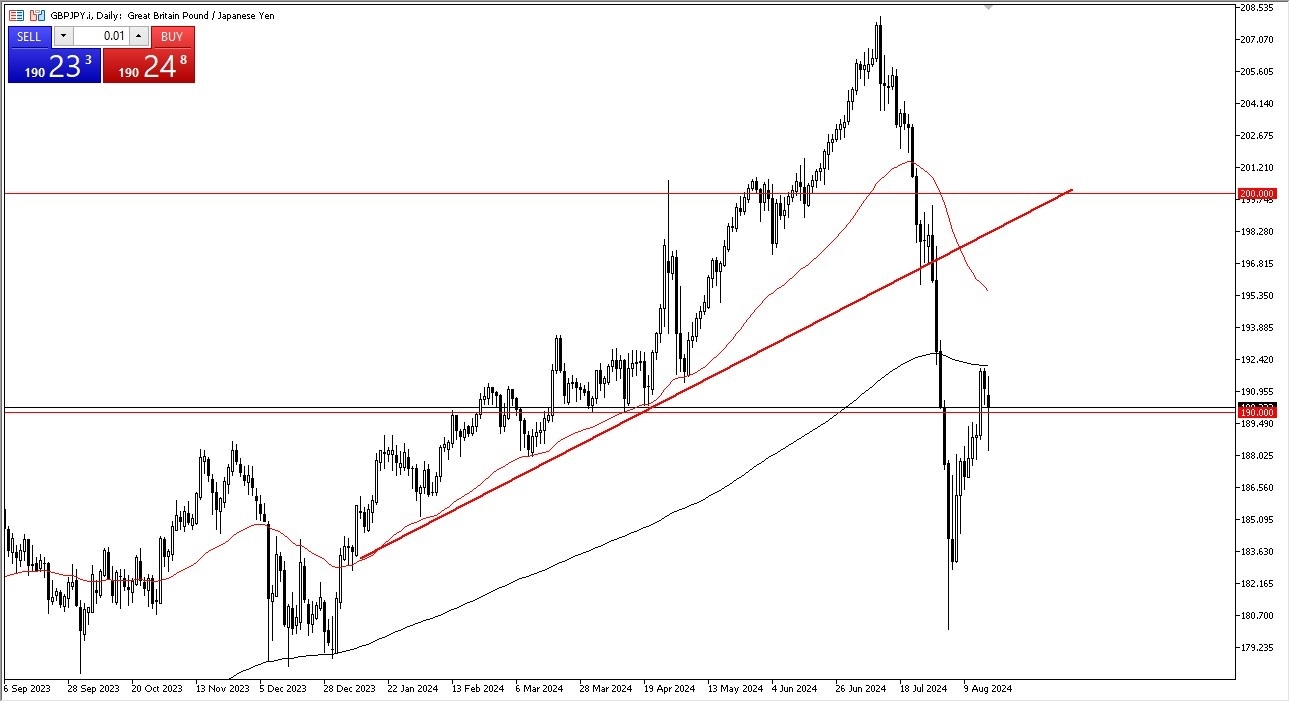
If we can break above there, then I think that the British pound will really start to take off and we could see some upward momentum. Short-term pullback, see plenty of support near the 188 yen level, and then again down at the 183 yen level.
Those are both short-term support levels, but they should be somewhat important. Keep in mind that a lot of this comes down to the carry trade and whether or not it still exists, so therefore you do need to pay attention to the Japanese yen-related pairs across the board. Risk appetite is a major feature of what drives this as well, so if risk appetite picks up a little bit, I expect this GBP/JPY pair to do the same.
It got absolutely hammered recently but a bit of a bounce makes a certain amount of sense. Now the question is, can we break back above the 200 day EMA? And if we can, then it’s likely that we will continue to rally towards the 50 day EMA, perhaps even as high as the 200 yen level. I do think it’s going to be noisy, but at the end of the day, you get paid to hang on to this pair, and that’s something that has not changed despite the fact that everybody had a freak out. Ultimately, this is a market that I think will continue to be hard to keep hanging onto, if you are heavily levered. However, if you keep your position size reasonable, you should do okay.
Ready to trade our Forex daily analysis and predictions? Here’s the best forex trading company in UK to trade with.
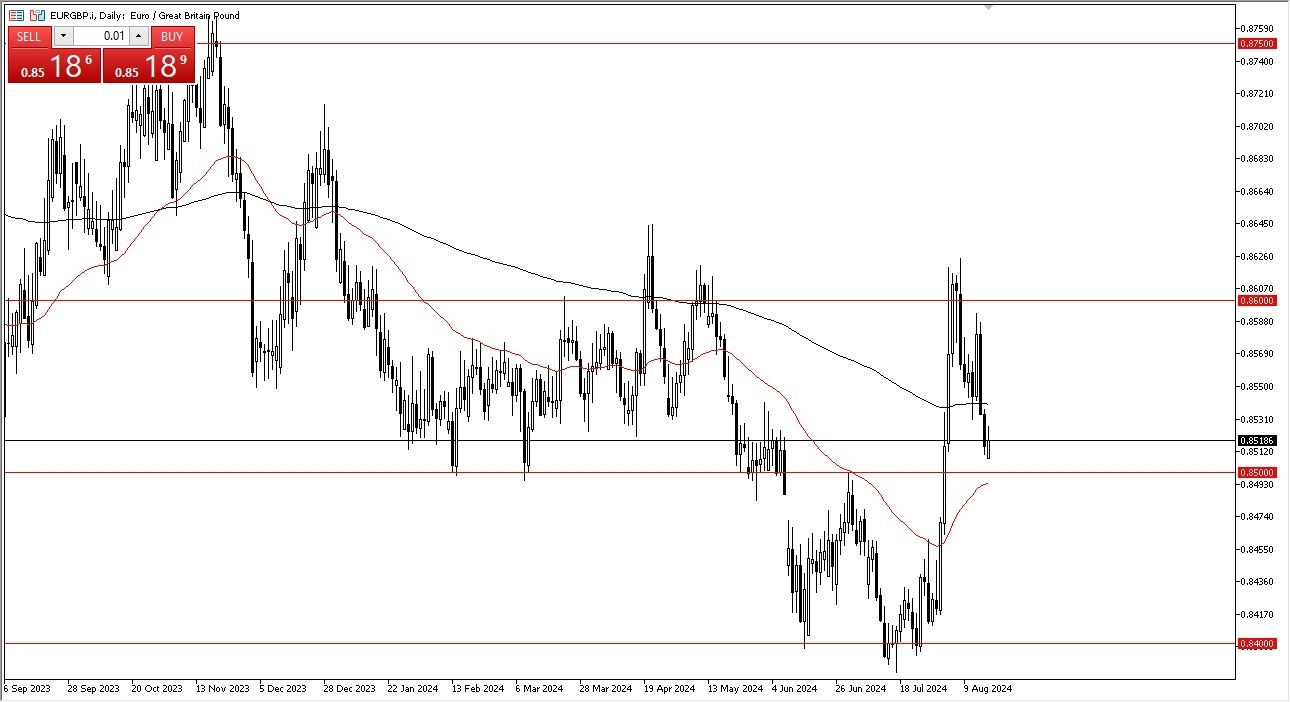
If we do in fact break above the 200 day EMA, then it’s possible that the market could go looking to the 0.86 level. That being said, this is a market that I think continues to be very noisy and that is typical for this type of currency pair as the market continues to see a lot of noisy behavior. If we can break above the 0.86 level,
It’s likely that we could go much higher at this point, and that could open up a move to the 0.8750 level, possibly even the 0.9 level. From a longer term perspective, this is a market that has been testing a major support level on the monthly chart. So, all things being equal, I think this does make a certain amount of sense. It isn’t necessarily that the euro is going to be the be all end all of strong currencies, it’s just that we had gotten a bit overzealous to the downside and now we are going to try to find some type of normalcy. In fact, you can see that even just rallying to the 0.8750 level in the longer term chart would just put us basically into a state of normalcy. So, I think all things being equal, dips will continue to be value in this pair.
That being said, you also have to realize that EUR/GBP is a pair that is quite choppy and erratic as the 2 economies are so highly intertwined. Because of this, you will need to be very patient and recognize that it may take some time for the trade to play itself out.
Ready to trade our Forex daily forecast? We’ve shortlisted the best forex broker list for you to check out.au
“Copper prices have been on a steady upward trend since the start of the year, barring the month of June, with a historic high of $11,105/tonne reached on May 20, 2024. A number of idiosyncratic issues worked to boost copper in H1 2024,” said research agency BMI, a unit of Fitch Solutions.
Pessimism over the Chinese economy and a weak US dollar pulled copper down in June to $9,515, said BMI. However, since then copper has been able to make headway to $9,944 on July 5. Currently, the red metal is quoted at $9,905 for the three-month contract on the London Metal Exchange, while the cash price is $9,696.
The Australian Office of the Chief Economist (AOCE) said copper prices have continued to trend higher in recent months, averaging about $9,700 a tonne in the June quarter — up 14 per cent since the start of the year. “The surge in prices reflects strong growth in global demand, which is expected to largely persist over H2 2024,” it said.
The World Bank, in its Commodity Outlook, said copper prices have reached a two-year peak in the first quarter, reflecting supply concerns and signs of firmer global industrial production.
According to ING Think, the financial and economic analysis wing of Dutch multinational financial services firm ING, the latest commitment of traders report shows that investors boosted net bullish positions for copper by 9,156 lots for a second consecutive week to 85,601 lots for the week ending July 5, the highest net long since May 31, 2024.
A major reason for copper regaining and analysts expecting prices to rebound is the four-day plenum of the Chinese Communist Party (CCP) scheduled to be held from July 15.
BMI said prices have regained some lost ground in July on the back of hopes of stimulus announcements during the third plenum of China, as well as increasing market participants expecting a rate cut by the US Fed sooner rather than later in light of fresh economic data supporting a cut.
Saish Sandeep Sawant Dessai, Analyst at Angel One, said the market is keenly awaiting the CCP’s third plenum, which is expected to focus on economic policy and reforms. It is also looking out for upcoming data on China’s yuan loans and total social financing, which could provide insights into future demand. .
The World Bank said global demand for copper — a key input for construction and equipment manufacturing — is likely to increase only modestly this year, reflecting subdued global GDP growth and the protracted challenges in China’s real estate sector.
“Nonetheless, the steady increase in the demand for copper, driven by energy transition technologies—particularly electricity grid infrastructure, EVs, and solar panels — is set to continue,” it said.
BMI said expectations of a rate cut by the US Fed, which led to a weakening of the US dollar compared to the highs of 2022 and 2023, worked to boost demand for copper priced in the greenback.
“Second, high-frequency indicators of global growth, especially US growth, continued to surprise to the upside, building positive sentiment towards copper demand. Third, Chinese manufacturing PMI figures showed a mild recovery in March and April, boosting speculative holdings. Fourth, major Chinese copper smelters announced production cuts in March,” it said.
The AOCE said China and the US will account for the bulk of this growth, driven by rising manufacturing activity and large investment in energy infrastructure.
BMI said it expect Chinese copper demand to grow by 3.5 per cent year-on-year (y-o-y) in 2024 compared to a 5 per cent rise in 2023 as China’s construction sector, critical for metal prices, remains in the doldrums.
“Our Country Risk team believes that China’s housing downturn is likely to last years, driven by an oversupply amid waning speculative demand,” it said. Outside of China, the growth outlook is subdued.
On the supply side, the copper market to tip into deficit in 2024, resulting from a slowdown in refined copper production growth due to copper concentrate supply constraints, leaving the market tight. “We expect refined copper production to grow by 3.1 per cent yoy in 2024, compared with 6.5 per cent growth in 2023,” the research agency said..
Global copper mine output in 2024 will be driven by increased production from new mining projects along with a rebound in output in countries that faced operational challenges in 2023. “We expect First Quantum’s Cobre Panama mine closure in Panama to pose downside risks to our global copper mine outlook in 2024, while the production starts at the Udokan project in Russia as well as expansion at the Kamoa-Kakula mine in the DRC and Quebrada Blanca in Chile could shift the balance of risks to the upside,” it said.
The World Bank said copper supply growth is expected to be modest this year, limited by production stoppages and declining ore grades in major producers in South America, before picking up in 2025. It projected a 5 per cent yoy increase in copper prices this year.
The AOCE said LME copper prices are forecast to average about $9,500 a tonne in 2024 (up from $8,700 in 2023), rising to $9,970 in 2026.
BMI said, “We are raising our 2024 copper price forecast from $9,200/tonne to $9,600, as prices continue to be led by investor sentiment that is tilted towards a US Fed rate cut in Q3 2024.”
Gold price is keeping its range play intact at around $2,500 early Tuesday, within striking distance of the all-time highs at $2,510. Traders take a breather and refrain from placing fresh bets on the Gold price ahead of the Minutes of the US Federal Reserve (Fed) July meeting and Chairman Jereme Powell’s speech later this week.
Gold price has entered a phase of upside consolidation, following a rally to a new lifetime high and a 3% gain booked last week. Buyers are looking forward to a fresh and significant catalyst to regain upside traction, even though the US Dollar (USD) continues to remain on a downward spiral alongside the US Treasury bond yields.
The Greenback faced a double whammy on Monday, with heightening expectations surrounding a September Fed interest-rate cut weighing on the US Treasury bond yields on one side. On the other hand, dovish Fed expectations lifted the sentiment on Wall Street, eroding the safe-haven appeal of the USD.
However, Gold price failed to capitalize on reduced US Dollar demand, as fears over a potential Middle-East geopolitical escalation eased after news reported that Israeli Prime Minister Benjamin Netanyahu accepted a “bridging proposal” presented by Washington to tackle disagreements blocking a ceasefire deal in Gaza, per Reuters.
Heading into yet another day of data-sparse US economic calendar on Tuesday, Gold price treads water, with markets digesting the no-rate change action by the People’s Bank of China (PBOC). Traders turn anxious, awaiting the Fed’s July meeting Minutes and Chair Jerome Powell’s speech at Jackson Hole on Friday for clues on the interest-rate outlook.
Markets are currently fully pricing in a 25 basis points (bps) rate cut by the Fed next month, with the odds of a 50 bps move off the table. The further upside in Gold price could be also capped because of the pricing out of a bigger rate reduction for September.
Ahead of the key Fed events, Gold price will continue to remain at the mercy of risk trends and speeches from Fed policymakers. Fresh developments surrounding the Iran-Israel conflict could also play a pivotal role in the Gold price action.
Following a symmetrical triangle breakout, risks remain skewed to the upside for Gold price.
The 14-day Relative Strength Index (RSI) points south but holds well above the 50 level, suggesting that any pullback in Gold price could be bought into.
On the upside, should the record high of $2,510 be taken out on a sustained basis, the next relevant topside target is seen at the $2,550 level. Acceptance above the latter could challenge the $2,600 round level en route to the triangle target, measured at $2,660.
However, if the Gold price correction extends, the immediate support is seen at the previous day’s low of $2,486, followed by the triangle resistance-turned-support, now at $2,468.
Further south, the $2,450 psychological barrier will challenge the bullish commitments.
FOMC stands for The Federal Open Market Committee that organizes 8 meetings in a year and reviews economic and financial conditions, determines the appropriate stance of monetary policy and assesses the risks to its long-run goals of price stability and sustainable economic growth. FOMC Minutes are released by the Board of Governors of the Federal Reserve and are a clear guide to the future US interest rate policy.
Frequency: Irregular
Consensus: –
Previous: –
Source: Federal Reserve
Pine timber being exported from Wellington, New Zealand. Photo by James Anderson, World Resources Institute.
The Pound to New Zealand Dollar exchange rate has resumed its recent correction lower in tandem with many US Dollar pairs and it could be likely to remain heavy, with a downside bias over the coming days.
GBP/NZD rallied briefly to 1.15 last week after the Reserve Bank of New Zealand surprised the market by cutting its cash rate but the move was quick to fade, perhaps owing to the bank’s new forecasts.
These suggested as much as 100 basis points of additional cuts are likely over the year to next August when the market had been pricing in a much deeper 200 basis point reduction for that period.
The main Kiwi pair, NZD/USD, has since recovered back above 0.60 as a result, aided by a softer US Dollar, which has led GBP/NZD to recede back below 2.13 despite a buoyant performance from Sterling.
“Our proprietary flows show USD selling across the board so far in August, particularly from hedge funds and corporates. EUR, JPY and GBP have benefited the most, but more recently also high beta G10 currencies and EM FX,” BofA Global Research strategists said in a Monday note to clients.
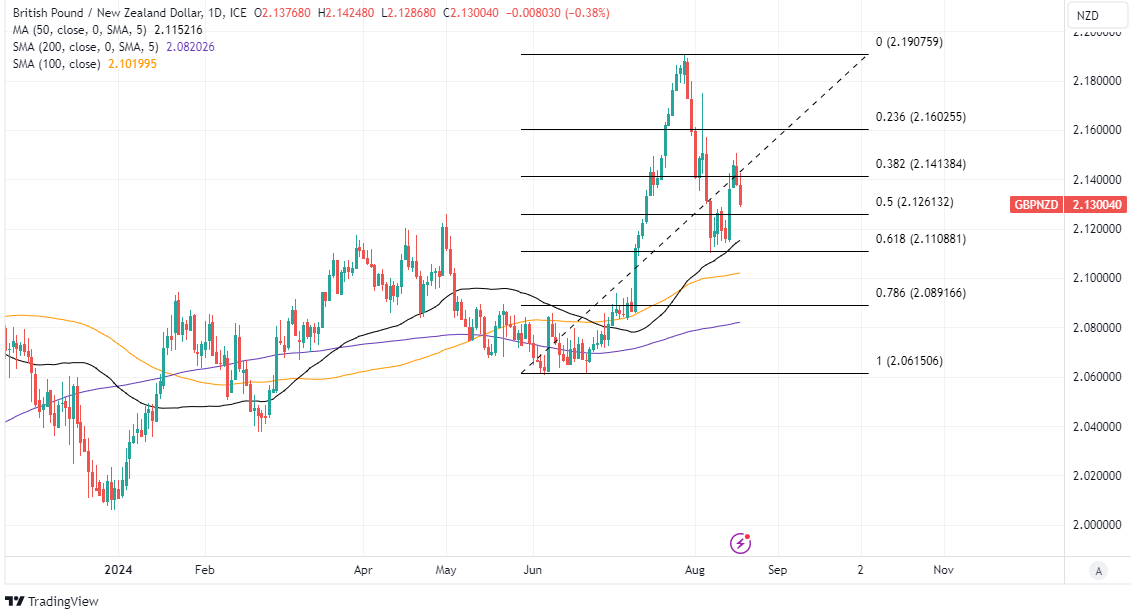
Above: Pound to New Zealand Dollar rate shown at daily intervals with Fibonacci retracements of June upturn and selected moving averages indicating possible areas of technical support.

“Despite GBP being the weakest in G10 so far in August, our investor proprietary flows remain positive, with hedge funds in particular offering strong support. GBP positioning is long, but not stretched, with hedge funds having more room,” the BofA team also said.
The nascent rebound in NZD/USD is a headwind for the negatively-correlated GBP/NZD pair but the currently buoyant performance from GBP/USD is something that might limit the downside in GBP/NZD this week.
The author’s model suggested earlier on Monday that a relatively narrow range between 2.1321 and 2.1557 was likely for the week ahead and while GBP/NZD has since slipped through the bottom of this, there is some technical support just above the nearby 2.11 handle that might frustrate further losses in the short-term.
“The Kiwi has quickly put last week’s OCR cut and dovish U-turn by the RBNZ behind it and has resumed focussing on global themes. That also makes it a little more sensitive to moves in the USD, which is continuing to track lower as US bond yields fall,” ANZ Research strategists said.
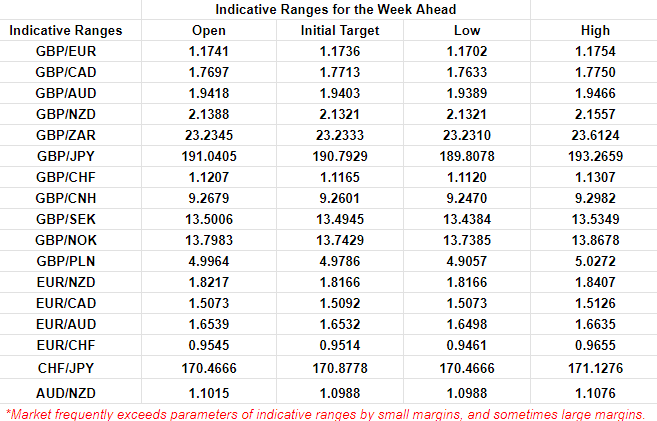
Above: Quantitative model estimates of possible ranges for the week. Source: Pound Sterling Live.
“Falling interest rates were a key factor undermining the Kiwi in the lead-up to last week’s cut, and they’re likely to have a similar impact on the USD as the Fed inches closer to easing. On that score, all eyes are on this week’s Jackson Hole Economic Symposium,” they added in a Monday note to clients.
Much about the near-term trajectory of GBP/NZD is likely to be determined by the direction of the US Dollar before and after the Federal Reserve’s Jackson Hole Symposium on Thursday and Friday, where the main event is a Friday speech from Chairman Jerome Powell.
Market focus will be on whether he validates or pushes back against current expectations for as much as 100 basis points worth of interest rate cuts from the Fed this year, which matters for the US Dollar because this kind of easing would be likely to erode its yield advantage over other currencies.
Any validation of the market’s outlook for US rates would likely act as a headwind for GBP/NZD, though Sterling will also be sensitive to a subsequent speech from Bank of England Governor Andrew Bailey, and particularly any remarks on what last week’s data deluge means for the UK interest rate outlook.
However, before then, GBP/NZD could potentially benefit somewhat on Wednesday and Thursday if Kiwi credit card spending data for July and retail sales figures for the second quarter remain weak, as this would reinforce the case for further interest rate cuts from the Reserve Bank of New Zealand.
(MENAFN– Daily Forex)
During the trading session on Friday, we have seen the Australian dollar pullback have been against the Japanese yen to reach towards the 98 yen level before bouncing later in the day.
This was something that we had seen in several yen related pairs.
And at this point, I think what we’ve got is a situation where perhaps people are trying to return to the carry trade.
That happens, we could see a huge value proposition playing out in real time when it comes to this currency pair, and everything else JPY-related.
The Bounce MattersThe fact that we sold off so hard in the early hours, but then turned around to show signs of life, tells me that there’s probably some fight left in the carry trade. Keep in mind that you get paid to hang on to this AUD/JPY pair , and ultimately, I think that is going to be a big driver. Yes, I recognize that the carry trade has been damaged quite drastically, but at this point, it looks like we are at least trying to reach the 100 yen level above where the 200 day EMA currently resides.Top Forex Brokers1 Get Started 74% of retail CFD accounts lose money If we can break above there, then it’s likely that the market could go looking to the 103 yen level where the 50 day EMA is. On the other hand, if we turn around and drop down below the 96.50 yen level, then we could go looking to the 93.50 level. That’s an area that could be like a“trapdoor” when it comes to the market rapidly falling to lower levels.-p src= data-src=”” alt=”AUD/JPY Forecast Today 19/8: Bounces Back (Graph)” title=”AUD/JPY Forecast Today 19/8: Bounces Back (Graph)” class=”img-responsive center LazyLoading” lazy=loading>That being said, it would probably come with a major risk-off attitude out there, and that of course is something to keep in the back of your mind. If we get more risk on behavior, and we have most certainly seen it over the last couple of days, it’s likely that the ASE will continue to climb against the yen. Keep in mind that the Bank of Japan cannot tighten monetary policy too far, because quite frankly, they would wreck the Japanese economy.Ready to trade our Forex daily forecast? We’ve shortlisted the best forex broker list for you to check out.MENAFN19082024000131011023ID1108576809

(MENAFN– Daily Forex)
We are most certainly threatening the crucial $2500 level now, and it’s likely that we do eventually break above there.
We have recently been in an ascending triangle, and therefore it looks as if we are building up the pressure to go higher.
Short-term pullbacks will almost certainly continue to attract value hunters, and quite frankly think there are a whole host of reasons why Gold should continue to go higher.
Many Reasons to Go HigherThere are a whole list of reasons to assume that the gold markets are going to go higher, not the least of which would be the fact that there is a lot of fear out there. After all, the markets have recently seen a lot of volatility, and therefore a certain amount of“safety trade” comes into focus. We now have to pay close attention to the $2500 level, which is a large, round, psychologically significant figure, and therefore it’s likely that we could continue to see that area attract a lot of attention. If we were to break above there, then I think it brings quite a bit of“FOMO” into the picture.Top Forex Brokers1 Get Started 74% of retail CFD accounts lose money Furthermore, I think you also have to keep in mind that the central banks around the world are going to be cutting rates, and that does tend to make the idea of owning gold a little bit more attractive. Furthermore, the market is likely to continue to be paying close attention to the idea that there are plenty of geopolitical concerns out there as well, so it all lines up quite nicely to see the gold market go higher. All things being equal, I think this is a situation where short-term pullbacks will almost certainly attract quite a bit of interest, especially near the $2440 level, if we were even able to break down that far.All things being equal, this is a market that I think continues to see a lot of choppiness, but overall, we continue to find buyers in the gold market, and I think that will continue to be the way this market behaves. Quite frankly, I don’t even have a scenario which I start selling gold anytime soon.Ready to trade today’s Gold prediction ? Here’s a list of some of the best XAU/USD brokers to check out.MENAFN19082024000131011023ID1108576817