The main category of Forex News.
You can use the search box below to find what you need.
[wd_asp id=1]
The main category of Forex News.
You can use the search box below to find what you need.
[wd_asp id=1]
(MENAFN– Daily Forex)
During the trading session on Friday, we have seen the Australian dollar pullback have been against the Japanese yen to reach towards the 98 yen level before bouncing later in the day.
This was something that we had seen in several yen related pairs.
And at this point, I think what we’ve got is a situation where perhaps people are trying to return to the carry trade.
That happens, we could see a huge value proposition playing out in real time when it comes to this currency pair, and everything else JPY-related.
The Bounce MattersThe fact that we sold off so hard in the early hours, but then turned around to show signs of life, tells me that there’s probably some fight left in the carry trade. Keep in mind that you get paid to hang on to this AUD/JPY pair , and ultimately, I think that is going to be a big driver. Yes, I recognize that the carry trade has been damaged quite drastically, but at this point, it looks like we are at least trying to reach the 100 yen level above where the 200 day EMA currently resides.Top Forex Brokers1 Get Started 74% of retail CFD accounts lose money If we can break above there, then it’s likely that the market could go looking to the 103 yen level where the 50 day EMA is. On the other hand, if we turn around and drop down below the 96.50 yen level, then we could go looking to the 93.50 level. That’s an area that could be like a“trapdoor” when it comes to the market rapidly falling to lower levels.-p src= data-src=”” alt=”AUD/JPY Forecast Today 19/8: Bounces Back (Graph)” title=”AUD/JPY Forecast Today 19/8: Bounces Back (Graph)” class=”img-responsive center LazyLoading” lazy=loading>That being said, it would probably come with a major risk-off attitude out there, and that of course is something to keep in the back of your mind. If we get more risk on behavior, and we have most certainly seen it over the last couple of days, it’s likely that the ASE will continue to climb against the yen. Keep in mind that the Bank of Japan cannot tighten monetary policy too far, because quite frankly, they would wreck the Japanese economy.Ready to trade our Forex daily forecast? We’ve shortlisted the best forex broker list for you to check out.MENAFN19082024000131011023ID1108576809

(MENAFN– Daily Forex)
We are most certainly threatening the crucial $2500 level now, and it’s likely that we do eventually break above there.
We have recently been in an ascending triangle, and therefore it looks as if we are building up the pressure to go higher.
Short-term pullbacks will almost certainly continue to attract value hunters, and quite frankly think there are a whole host of reasons why Gold should continue to go higher.
Many Reasons to Go HigherThere are a whole list of reasons to assume that the gold markets are going to go higher, not the least of which would be the fact that there is a lot of fear out there. After all, the markets have recently seen a lot of volatility, and therefore a certain amount of“safety trade” comes into focus. We now have to pay close attention to the $2500 level, which is a large, round, psychologically significant figure, and therefore it’s likely that we could continue to see that area attract a lot of attention. If we were to break above there, then I think it brings quite a bit of“FOMO” into the picture.Top Forex Brokers1 Get Started 74% of retail CFD accounts lose money Furthermore, I think you also have to keep in mind that the central banks around the world are going to be cutting rates, and that does tend to make the idea of owning gold a little bit more attractive. Furthermore, the market is likely to continue to be paying close attention to the idea that there are plenty of geopolitical concerns out there as well, so it all lines up quite nicely to see the gold market go higher. All things being equal, I think this is a situation where short-term pullbacks will almost certainly attract quite a bit of interest, especially near the $2440 level, if we were even able to break down that far.All things being equal, this is a market that I think continues to see a lot of choppiness, but overall, we continue to find buyers in the gold market, and I think that will continue to be the way this market behaves. Quite frankly, I don’t even have a scenario which I start selling gold anytime soon.Ready to trade today’s Gold prediction ? Here’s a list of some of the best XAU/USD brokers to check out.MENAFN19082024000131011023ID1108576817
Spot Gold trades near a record high of $2,509.80 achieved at the beginning of the week, helped by sluggish US Dollar demand. XAU/USD barely surpassed its Friday’s high before retreating, but buyers added on dips, helping the bright metal to retain the $2,500 mark. The positive tone of equities maintains the USD subdued as Wall Street extends its recent gains, while the absence of macroeconomic data limits the intraday range.
This week’s focus will be on the Jackson Hole Symposium, hosting policymakers from around the globe. The event will take place over the weekend, with Federal Reserve (Fed) Chairman Jerome Powell speaking on Friday.
Central banks are still the main market driver, with the main focus on the Fed, as the central bank is still to decide on an interest rate cut. Indeed, US policymakers have been paving the way towards such a movement, but with the most cautious stance. Early on Monday, Fed Bank of Minneapolis President Neel Kashkari spoke to the Wall Street Journal and said tha inflation is making progress, although the labor market is showing some concerning signs. “The balance of risks has shifted more towards labor market and away from inflation side of our dual mandate,” Kashkari added.
Ahead of the event, S&P Global will release the preliminary estimates of the August Purchasing Managers Indexes (PMIs).
The XAU/USD pair pressures its record high, and the daily chart shows it is consolidating its recent gains. An intraday slide met buyers in the $2,385 price zone, which resulted in a quick recovery, suggesting speculative interest is willing to add on dips. Technical indicators in the mentioned time-frame retreated just modestly from near overbought reading, but the pair develops above bullish moving averages, with the 20 Simple Moving Average (SMA) providing dynamic support at around $2,429.00.
In the near term, and according to the 4-hour chart, the risk is skewed to the upside. XAU/USD trades well above all its moving averages, which picked up bullish momentum far below the current level. At the same time, technical indicators resumed their advances after a modest downward correction, reflecting bulls’ dominance.
Support levels: 2,496.40 2,485.10 2,427.20
Resistance levels: 2,510.00 2,523.50 2,535.00
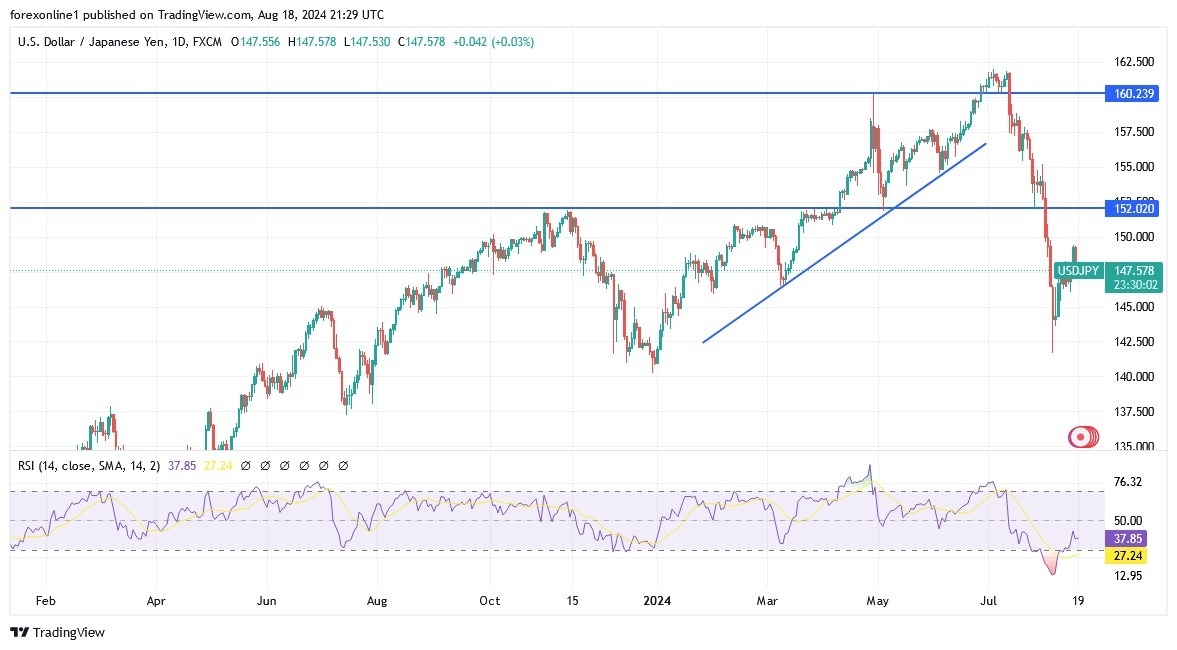
The psychological resistance level of 150 yen seems to be a major resistance, especially since the 50-week moving average is located in the same area. If the currency pair can break above this level, then the US dollar may continue to rise.
With pressure on the US dollar returning, Goldman Sachs Group Inc economists have cut the probability of a US recession next year to 20% from 25%, citing retail sales and jobless claims data last week. In this regard, Goldman Sachs economists led by Jan Hatzius said in a report to clients on Saturday, “if the US August jobs report due on September 6 “looks reasonably good, we may lower the probability of a recession to 15%, where it has been for about a year” before the revision on August 2.
Meanwhile, a series of data showing the resilience of the US economy has pushed stock indexes to their best week this year, with buyers entering after the recent rout. According to the results of the economic calendar, retail sales in July rose by the most since early 2023. Also, separate government figures showed the lowest number of unemployment claims last week since early July.
Also, Goldman Sachs economists said they are “more confident” that the Fed will cut US interest rates by 25 basis points at its September policy meeting. Added, “although another negative surprise in jobs on September 6 could trigger a 50-basis point move.”
In Japan, preliminary GDP for the second quarter grew by 0.8%, beating the expected 0.5% growth rate. The preliminary annualized GDP for the quarter also beat expectations at 2.1% with a change of 3.1%, and the preliminary GDP deflator (year-on-year) beat expectations at 2.6% with a change of 3%.

USD/JPY continues to trade slightly above its 100-hour moving average. Friday’s decline pushed the currency pair closer to oversold levels on the 14-hour Relative Strength Index. In the short term, based on the hourly chart, the USD/JPY pair is trading in a descending channel formation. The 14-hour RSI has also declined to approach oversold conditions. Technically, bears will target extended declines around 147.50 or lower to the 147.10 support. Moreover, bulls will look to pounce on potential rebounds around 148.78 or higher at the 149.35 resistance.
In the long term, based on the daily chart, the USD/JPY pair is trading in a sharply rising channel formation. Also, the 14-day RSI has rebounded to recover from oversold levels. Furthermore, bulls will look to extend the current rebounds towards 149.96 or higher to the 151.62 resistance. On the other hand, bears will look to pounce on profits around 146.41 or lower at the 144.00 support.
Want to trade our daily forex analysis and predictions? Here’s a list of forex brokers in Japan to check out.
Silver price (XAG/USD) price holds minor losses, trading around $29.00 per troy ounce during Monday’s Asian session. However, the downside of the safe-haven Silver could be limited due to rising geopolitical tensions.
On Sunday, conflicting statements from Hamas and Israel dampened the chances of a breakthrough ceasefire deal. Hamas has issued a statement rejecting the terms for a hostage release-ceasefire deal discussed in Doha on Thursday and Friday. The group accuses Prime Minister Benjamin Netanyahu of introducing new obstacles into the negotiations, according to Reuters citing a local news agency Times of Israel.
Israeli Prime Minister Benjamin Netanyahu is scheduled to host US Secretary of State Antony Blinken on Monday. Following their meeting, Blinken will travel to Cairo, where negotiations on a deal are continuing. The US has announced plans to host a second meeting later in the week and aims to finalize the agreement by the end of the week.
Additionally, concerns about escalating tensions between Ukraine and Russia were heightened as Ukraine initiated the largest invasion of Russia since World War II. The ministry released a video showing General Valery Gerasimov, the commander of the Russian military operations, visiting a different combat zone in Ukraine. Gerasimov received reports from commanders and set “tasks for further actions,” according to Reuters.
The prices of non-yielding Silver may advance further due to the likelihood of an interest rate cut by the Federal Reserve (Fed) starting in September increases. Last week’s US economic data indicated that Retail Sales exceeded expectations, while both the Producer Price Index (PPI) and Consumer Price Index (CPI) suggested that inflation is easing.
Federal Reserve Bank of San Francisco President Mary Daly emphasized Sunday that the US central bank should take a gradual approach to reducing borrowing costs, according to the Financial Times. Additionally, Federal Reserve Bank of Chicago President Austan Goolsbee warned that central bank officials should be cautious about keeping a restrictive policy in place longer than necessary.
Silver is a precious metal highly traded among investors. It has been historically used as a store of value and a medium of exchange. Although less popular than Gold, traders may turn to Silver to diversify their investment portfolio, for its intrinsic value or as a potential hedge during high-inflation periods. Investors can buy physical Silver, in coins or in bars, or trade it through vehicles such as Exchange Traded Funds, which track its price on international markets.
Silver prices can move due to a wide range of factors. Geopolitical instability or fears of a deep recession can make Silver price escalate due to its safe-haven status, although to a lesser extent than Gold’s. As a yieldless asset, Silver tends to rise with lower interest rates. Its moves also depend on how the US Dollar (USD) behaves as the asset is priced in dollars (XAG/USD). A strong Dollar tends to keep the price of Silver at bay, whereas a weaker Dollar is likely to propel prices up. Other factors such as investment demand, mining supply – Silver is much more abundant than Gold – and recycling rates can also affect prices.
Silver is widely used in industry, particularly in sectors such as electronics or solar energy, as it has one of the highest electric conductivity of all metals – more than Copper and Gold. A surge in demand can increase prices, while a decline tends to lower them. Dynamics in the US, Chinese and Indian economies can also contribute to price swings: for the US and particularly China, their big industrial sectors use Silver in various processes; in India, consumers’ demand for the precious metal for jewellery also plays a key role in setting prices.
Silver prices tend to follow Gold’s moves. When Gold prices rise, Silver typically follows suit, as their status as safe-haven assets is similar. The Gold/Silver ratio, which shows the number of ounces of Silver needed to equal the value of one ounce of Gold, may help to determine the relative valuation between both metals. Some investors may consider a high ratio as an indicator that Silver is undervalued, or Gold is overvalued. On the contrary, a low ratio might suggest that Gold is undervalued relative to Silver.
The EUR/USD pair extended its advance to a fresh 2024 high of 1.1049 on Monday and trades nearby amid persistent risk appetite. Markets turned optimistic last week, as easing inflationary pressures in the United States (US) somehow confirmed an upcoming Federal Reserve (Fed) interest rate cut in September, while US data showed the local economy remains resilient, and concerns about a recession somewhat receded.
The absence of relevant macroeconomic data and upcoming first-tier events by the end of the week, however, limits the EUR/USD intraday range. The European calendar remained empty, while the US has nothing relevant to offer. Still, and ahead of Wall Street’s opening, Fed Bank of Minneapolis President Neel Kashkari noted that inflation is making progress, although the labor market is showing some concerning signs. “The balance of risks has shifted more towards labor market and away from the inflation side of our dual mandate,” Kashkari said.
Fed Board member Christopher Waller will be on the wires early in the American session and could make some comments on monetary policy. Other than that, the focus will be on the Purchasing Managers Indexes (PMIs) to be released on Thursday and the Jackson Hole Symposium starting Friday.
From a technical point of view, the daily chart for the EUR/USD pair shows bulls retain control but with a cautious approach. Technical indicators have turned flat near overbought readings, far from suggesting upward exhaustion. At the same time, the pair keeps developing well above all its moving averages, with the 20 Simple Moving Average (SMA) gaining bullish traction above the longer ones at around 1.0900.
The near-term picture is quite alike. In the 4-hour chart, technical indicators turned flat, although the Relative Strength Index (RSI) indicator stands near overbought readings while the Momentum indicator holds within neutral levels. At the same time, all moving averages aim higher below the current level, reflecting bulls’ dominance around EUR/USD.
Support levels: 1.0985 1.0950 1.0900
Resistance levels: 1.1045 1.1090 1.1120
Natural Gas (NG) futures are trading lower at $2.30, down 0.82% for the day. The 4-hour chart reveals a bearish bias, with prices trading below both the 50-day and 200-day exponential moving averages (EMAs) of $2.18 and $2.38, respectively.
The pivot point at $2.06 is a critical level to watch. A break below this could accelerate the downtrend towards the support levels of $1.98, $1.92, and $1.85. Conversely, a move above $2.06 could signal a potential reversal, with the next resistance levels at $2.13, $2.21, and $2.28.
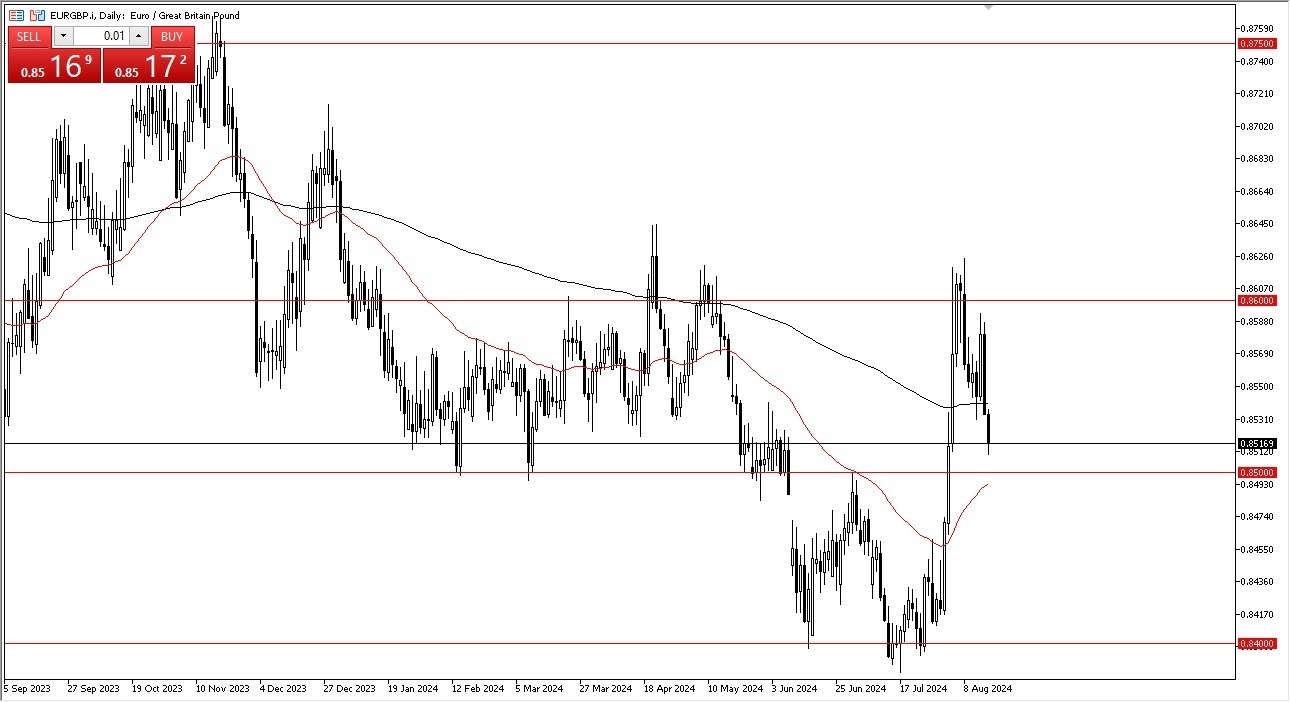
This point in time, if we can break above the 200-Day EMA, then it’s likely that the market could go looking to the 0.86 level, which is an area that is a massive amount of resistance just waiting to happen, so I think ultimately if we turn around and show signs of life, the market is likely to continue to see traders take advantage of any momentum. After all, we are in a situation where the market is at extreme low levels, and it’s probably only a matter of time before we see value hunters coming into the market to take advantage of it.
The euro of course is all over the place against the British pound (EUR/GBP currency pair), and you should also have to keep in mind that these 2 economies are highly intertwined, despite the fact that there has been Brexit. That being said, the market is likely to see a lot of volatility and noisy behavior, and therefore I think you’ve got a situation where the position sizing should be crucial, and therefore I think it’s a significant issue to pay attention to as far as a risk management is concerned. That being said, the market is at the extreme lows, I think it’s only a matter of time before people will get aggressive at this point in time, and therefore send the market much higher.
The alternate scenario of course is if we break down below the 0.84 level, then the market could really start to fall apart. In that environment, I anticipate that you would see the euro falling against almost everything.
Ready to trade our daily Forex analysis? We’ve made this forex brokers list for you to check out.
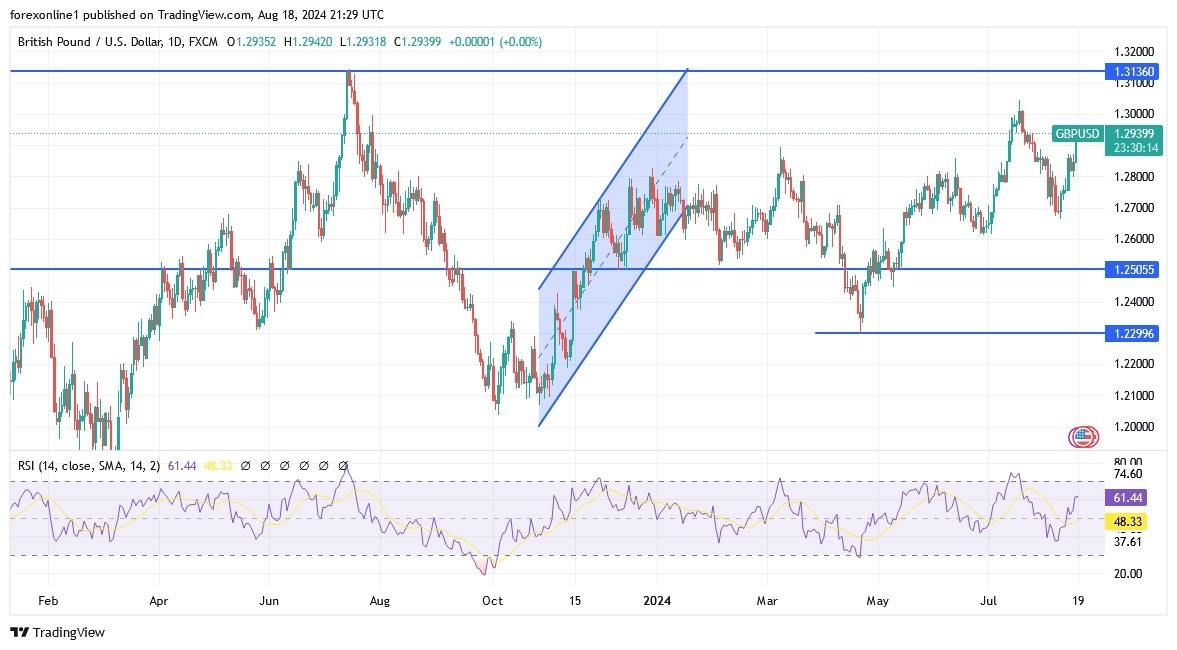
According to reliable trading platforms, the broad losses in the US dollar helped the pound ignore the mixed UK retail sales figures for July that were released earlier in the European morning, as the rise led the GBP/USD pair to regain key levels on the charts. Technically, GBP/USD rose above its 200-week moving average at 1.2845 before rising above the 61.8% Fibonacci retracement level of its July low at 1.2901 as the greenback weakened against all major currencies.
The US dollar was broadly weaker in Asia, Europe and North America, helping GBP/USD extend its previous recovery from early August lows, creating scope for further gains ahead.
Commenting on the performance of the currency pair, Sean Osborne, chief FX analyst at ScotiaBank, said: “GBP gains have picked up again after the spot price broke higher from yesterday’s consolidation range.” The analyst added, “Fresh short-term highs for the cable above 1.29 target additional gains towards 1.2950/1.30.”
According to trading, the GBP/USD pair has risen strongly since Tuesday when UK jobs figures came in better than expected and US producer price data indicated that further deflation may be in the making, boosting the pound and weighing on the dollar. Furthermore, a negative surprise for UK inflation had caused a setback for the pound on Wednesday, even as the US dollar weakened after another decline in US inflation, prompting markets to become more confident in a tangible cut in US interest rates from September.
However, data indicating a resilient second quarter for the UK economy helped the GBP/USD pair regain more lost ground last Thursday, even as the US dollar rose following the US retail sales report for July. Overall, the GBP/USD gains on Friday now bring a 78.6% retracement of the late July decline to 1.2965 into focus, which is the last defense of the year’s high so far around 1.3047. Obviously, that will be happened ahead of public statements from Bank of England Governor Andrew Bailey and Federal Reserve Chairman Jerome Powell at the Jackson Hole symposium this week.
Ready to trade our daily Forex forecast? Here’s a list of some of the top forex brokers UK to check out.
The USD/JPY forecast points to solid bearish momentum as the yen rallies on divergence in policy outlook for the Bank of Japan and the Fed. Fed policymakers will likely assume a dovish tone and support expectations for a rate cut in September. On the other hand, BoJ policymakers have taken a hawkish tone, which could indicate that more rate hikes will come.
-Are you interested in learning about the forex signals telegram group? Click here for details-
The yen has rallied since Friday as Fed rate cut expectations rose. At the same time, investors took profits on the recent dollar rally, weakening the greenback. Last week, the likelihood of a 50 bps Fed rate cut in September fell amid better-than-expected data. However, that of a smaller cut increased. Markets are currently fully pricing a 25 bps rate cut in September. Although the rate-cutting cycle might be gradual, it will likely start next month. Consequently, the dollar might remain fragile.
This week, traders will watch the Jackson Hole symposium, during which Powell might drop hints on the Fed’s policy path. Experts believe the Fed Chair might signal the start of rate cuts in September. At the same time, the FOMC policy meeting minutes will show what went into the last decision to hold interest rates.
Meanwhile, in Japan, the central bank has started hiking interest rates and could do so again. Bank of Japan governor Kazuo Ueda will speak on Friday. A hawkish tone will further highlight the divergence in policy outlooks between Japan and the US.
Traders do not expect high-impact economic data from the US or Japan. Consequently, the pair might extend last week’s move.
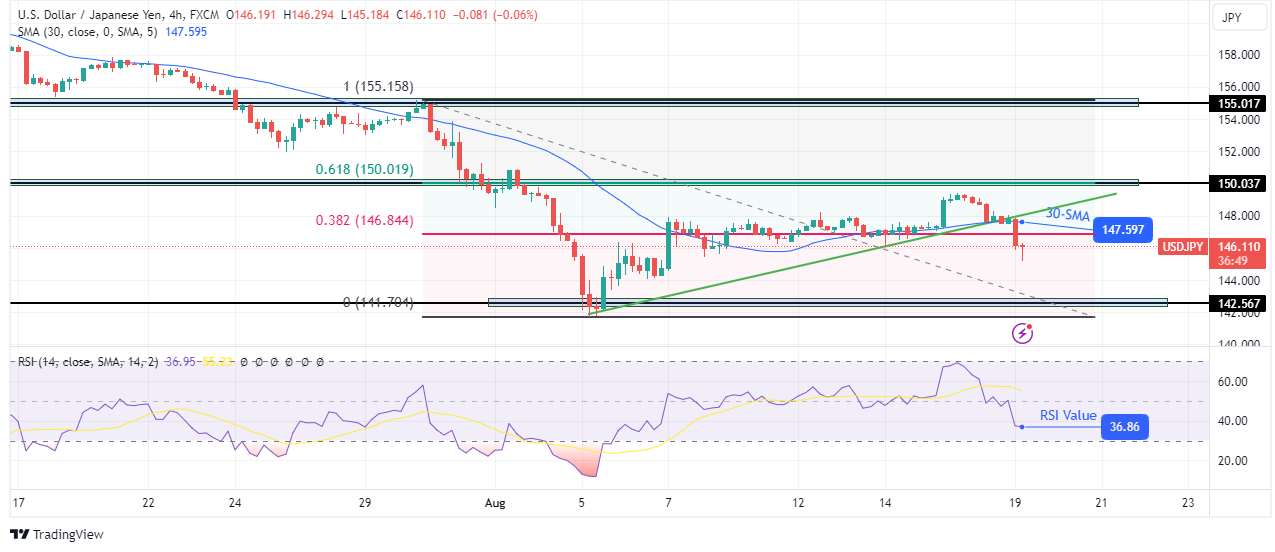
On the technical side, the USD/JPY price has broken below the 30-SMA, indicating a bearish sentiment shift. At the same time, the price has fallen below its bullish trendline and the 0.382 Fib level. In the previous move, bulls had set their sights on the 150.03 resistance level and the 0.618 Fib. However, before the price got there, there was a whiplash move that saw bears taking over.
-If you are interested in forex day trading then have a read of our guide to getting started-
The RSI now trades below 50, supporting bearish momentum. Therefore, the price might continue falling to the 142.56 support level.
Looking to trade forex now? Invest at eToro!
67% of retail investor accounts lose money when trading CFDs with this provider. You should consider whether you can afford to take the high risk of losing your money.