The main category of Forex News.
You can use the search box below to find what you need.
[wd_asp id=1]
The main category of Forex News.
You can use the search box below to find what you need.
[wd_asp id=1]
Gold price is battling $2,500 early Monday, having refreshed all-time highs at $2,510. Gold traders prefer to take profits off the table, repositioning before the key US Federal Reserve (Fed) Minutes of the July meeting and Chairman Jereme Powell’s speech later this week.
Gold price witnessed a steep rise during the second half of Friday’s trading, gaining as much as 3% on the week.
The Gold price rally was mainly backed by heightened expectations of a Fed rate cut in September, as traders turned their attention to the upcoming week’s Jackson Hole Symposium, where Fed Chair Jerome Powell could throw fresh hints on additional easing beyond September.
Dovish comments from Chicago Fed President Austan Goolsbee warned that officials should be wary of keeping the restrictive policy in place longer than necessary.
In light of the dovish Fed expectations, Gold price rallied to a fresh record high of $2,509 on Friday, further supported by rife tensions in the Middle East. An imminent Iranian attack on Israel loomed, as Hamas mulled over ceasefire talks with the latter.
In Monday’s trading so far, Gold buyers appear to have taken a breather, consolidating Friday’s upsurge while finding fresh haven demand after Hamas rejected the latest US proposal for Gaza hostage and ceasefire deal on Sunday. Iran-backed militant group, Hamas, blamed Israeli Prime Minister Benjamin Netanyahu for putting up new obstacles in the talks, as cited by The Times of Israel.
Amidst renewed geopolitical tensions, the Gold price retracement remains limited, also as technical indicators on the daily time frame indicate more upside is likely in the near term.
Gold price closed Friday above the upper boundary of a symmetrical triangle formation, then at $2,470, confirming an upside break of the symmetrical triangle formation.
The 14-day Relative Strength Index (RSI) is easing off higher levels but remains well above the 50 level, suggesting that Gold price remains a ‘buy-the-dip’ trade.
If the new record high of $2,510 is reclaimed on a sustained basis, the next relevant topside target is seen at the $2,550 level. Acceptance above the latter could challenge the $2,600 round level en route to the triangle target, measured at $2,660.
In case the Gold price pullback gathers traction, the immediate support is seen around the previous $2,480 static supply zone, below which the triangle resistance-turned-support, now at $2,467 will be tested.
Further south, the $2,450 support will come into play.
(This story was corrected on August 19 at 06:15 GMT to say that the $2,480 static supply zone is a support, not a resistance.)
Gold FAQs
Gold has played a key role in human’s history as it has been widely used as a store of value and medium of exchange. Currently, apart from its shine and usage for jewelry, the precious metal is widely seen as a safe-haven asset, meaning that it is considered a good investment during turbulent times. Gold is also widely seen as a hedge against inflation and against depreciating currencies as it doesn’t rely on any specific issuer or government.
Central banks are the biggest Gold holders. In their aim to support their currencies in turbulent times, central banks tend to diversify their reserves and buy Gold to improve the perceived strength of the economy and the currency. High Gold reserves can be a source of trust for a country’s solvency. Central banks added 1,136 tonnes of Gold worth around $70 billion to their reserves in 2022, according to data from the World Gold Council. This is the highest yearly purchase since records began. Central banks from emerging economies such as China, India and Turkey are quickly increasing their Gold reserves.
Gold has an inverse correlation with the US Dollar and US Treasuries, which are both major reserve and safe-haven assets. When the Dollar depreciates, Gold tends to rise, enabling investors and central banks to diversify their assets in turbulent times. Gold is also inversely correlated with risk assets. A rally in the stock market tends to weaken Gold price, while sell-offs in riskier markets tend to favor the precious metal.
The price can move due to a wide range of factors. Geopolitical instability or fears of a deep recession can quickly make Gold price escalate due to its safe-haven status. As a yield-less asset, Gold tends to rise with lower interest rates, while higher cost of money usually weighs down on the yellow metal. Still, most moves depend on how the US Dollar (USD) behaves as the asset is priced in dollars (XAU/USD). A strong Dollar tends to keep the price of Gold controlled, whereas a weaker Dollar is likely to push Gold prices up.
One of the things it seems to have kicked off the carry trade again as the idea that the US economy is not slowing down as drastically as people had hoped, and therefore the interest rate differential between the Japanese yen and almost everything else should continue to remain quite wide. After all, the Bank of Japan cannot necessarily tighten monetary policy for a significant amount of time, at least not without wrecking the Japanese economy itself.

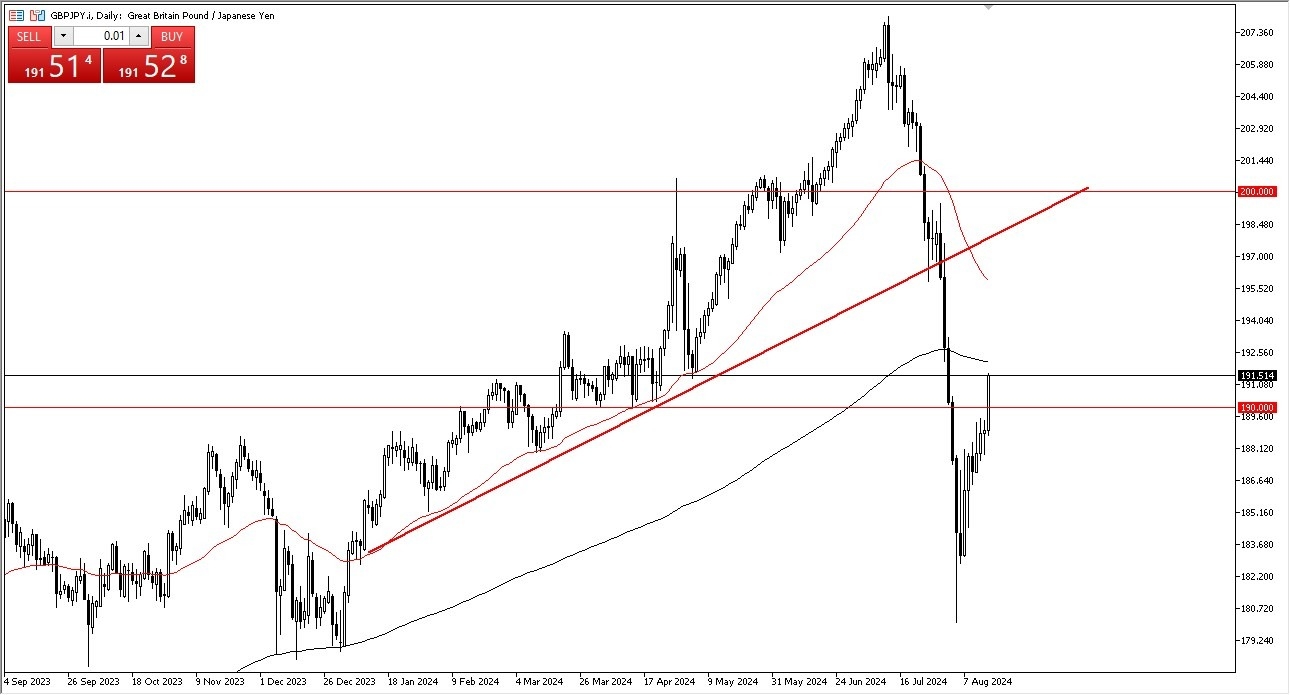
The interest rate differential between the British pound and the Japanese yen is essentially a mile wide, and as long as that’s going to be the case, it makes a lot of sense that traders will be hanging onto this pair as you get paid to do so. With that being the case, I like the idea of buying short-term pullbacks, with perhaps the area right around the ¥190 level as a short-term support level. On the other hand, if we break above the 200-Day EMA, then the market could go looking to the ¥195 level next, which has seen a bit of action in the past.
The size of the candlestick is of course very bullish, and that does suggest that we have more momentum in this market to burn off, meaning that we could go much higher. However, if we were to turn around a breakdown below the ¥188 level, that could send this market crashing back toward the ¥183 level underneath which has been an area of significant noise in the recent past. Ultimately, that’s the least likely of scenarios but it is something that you need to keep in the back of your head just in case.
Ready to trade our Forex daily analysis and predictions? Here are the best trading platform for beginners to choose from.
Gold price (XAU/USD) gains momentum around $2,505 during the early Asian session on Monday amid hopes of the US Federal Reserve (Fed) rate cuts in September. Gold traders will take more cues from the first reading of the US S&P Global Purchasing Managers Index (PMI) and Fed Chair Jerome Powell’s speech this week.
The precious metal rose to an all-time high on Friday as investors placed more bets on interest rate cuts from the US Fed in September. US economic data last week showed that Retail Sales beat estimates, but the US Producer and Consumer Price Indexes indicated inflation was subsiding.
Additionally, the US Housing Starts fell by 6.8% in July to 1.238 million units from the 1.1% increase in June, the lowest level since 2020. This figure added to concerns over the economy’s strength, especially after recent softer inflation and labor reports. This, in turn, fuels deeper reductions by the Fed and underpins the yellow metal as lower interest rates generally reduce the opportunity cost of holding non-yielding bullion.
Federal Reserve Bank of Chicago President Austan Goolsbee said on Sunday that the US economy does not show signs of overheating, thus Fed policymakers should be cautious about keeping restrictive policy in place longer than necessary. The markets are now pricing in nearly 76% chance of a 25 basis points (bps) Fed rate cut in its September meeting, according to the CME FedWatch Tool.
The ongoing geopolitical tensions in the Middle East and the war in Ukraine all contribute to the safe-haven demand for gold. Conflict between Hezbollah and Israel has escalated over the weekend, despite diplomatic attempts to de-escalate tensions to prevent an expected Hezbollah-Iran strike on Israel, per the Guardian. The news agency reported that an Israeli attack on Saturday was one of the bloodiest for civilians since fighting began in October.
Gold has played a key role in human’s history as it has been widely used as a store of value and medium of exchange. Currently, apart from its shine and usage for jewelry, the precious metal is widely seen as a safe-haven asset, meaning that it is considered a good investment during turbulent times. Gold is also widely seen as a hedge against inflation and against depreciating currencies as it doesn’t rely on any specific issuer or government.
Central banks are the biggest Gold holders. In their aim to support their currencies in turbulent times, central banks tend to diversify their reserves and buy Gold to improve the perceived strength of the economy and the currency. High Gold reserves can be a source of trust for a country’s solvency. Central banks added 1,136 tonnes of Gold worth around $70 billion to their reserves in 2022, according to data from the World Gold Council. This is the highest yearly purchase since records began. Central banks from emerging economies such as China, India and Turkey are quickly increasing their Gold reserves.
Gold has an inverse correlation with the US Dollar and US Treasuries, which are both major reserve and safe-haven assets. When the Dollar depreciates, Gold tends to rise, enabling investors and central banks to diversify their assets in turbulent times. Gold is also inversely correlated with risk assets. A rally in the stock market tends to weaken Gold price, while sell-offs in riskier markets tend to favor the precious metal.
The price can move due to a wide range of factors. Geopolitical instability or fears of a deep recession can quickly make Gold price escalate due to its safe-haven status. As a yield-less asset, Gold tends to rise with lower interest rates, while higher cost of money usually weighs down on the yellow metal. Still, most moves depend on how the US Dollar (USD) behaves as the asset is priced in dollars (XAU/USD). A strong Dollar tends to keep the price of Gold controlled, whereas a weaker Dollar is likely to push Gold prices up.
“They won’t be able to hike again, at least for the rest of the year. It’s a toss-up whether they can do one hike by next March.”
Later in the session on Monday, the US Leading Economic Index (LEI) may influence US dollar demand.
Economists forecast the LEI to fall by 0.3% in July after a 0.2% decline in June. A larger-than-expected fall may rekindle fears of a hard landing, supporting a USD/JPY move toward 145. The LEI offers insights into the US economic outlook, affecting sentiment toward the Fed rate path.
Beyond the economic data, FOMC member commentary also needs consideration. Voting member Christopher Waller will speak on Monday. In July, Waller stated that favorable CPI Reports could support a rate cut soon. A shift in stance regarding interest rate cuts could affect US dollar demand amid speculation about multiple 2024 Fed rate cuts.
Arch Capital Global Chief Economist Parker Ross remarked on the US CPI Report and the Fed rate path, stating,
“Core services inflation (0.31% m/m) – the sticky component the Fed has been worried about – bounced back in July from its weakest monthly reading since 2021.”
USD/JPY trends will depend on the US LEI, central bank forward guidance, and Services PMI numbers. Support for a Q4 2024 BoJ rate hike could pull the USD/JPY toward 145. Weak stats from the US and a more dovish FOMC may also signal a drop toward 145.
Investors should remain alert. Monitor real-time data, central bank insights, and expert commentary to adjust your trading strategies accordingly. Stay updated with our latest news and analysis to manage USD/JPY volatility.
The USD/JPY remained well below the 50-day and 200-day EMAs, affirming bearish price signals.
A USD/JPY break above the 148.529 resistance level and the top trend line would support a return to 150. Furthermore, a breakout from 150 could give the bulls a run at the 200-day EMA and the 151.685 resistance level. Selling pressure may intensify at the 151.685 resistance level as the 200-day EMA is confluent with the resistance level.
Economic indicators from the US and central bank commentary require consideration on Monday.
Conversely, a fall through 147.500 could signal a fall toward the 145.891 support level. A break below the 145.891 support level may bring the 143.495 support level into play.
The 14-day RSI at 39.06 indicates a USD/JPY drop below 147 before entering oversold territory.
(MENAFN– Daily Forex) The daily analysis of the GBP/JPY shows that we have had a major break out to the upside, as we have cleared the crucial u0026yen;190 level is an area that I think continues to attract a lot of attention due to the fact that it is a large round psychologically significant figure, and it had previously offered resistance for several days in a row of the things it seems to have kicked off the carry trade again as the idea that the US Economy is not slowing down as drastically as people had hoped, and therefore the interest rate differential between the Japanese yen and almost everything else should continue to remain quite wide. After all, the Bank of Japan cannot necessarily tighten monetary policy for a significant amount of time, at least not without wrecking the Japanese economy itself. Top Forex Brokers 1 Get Started 74% of retail CFD accounts lose money Read Review BrokerGeoLists({ type: u0027MobileTopBrokersu0027, id: u0027mobile-top-5u0027, size: 5, getStartedText: u0060Get Startedu0060, readReviewText: u0060Read Reviewu0060, Logo: u0027broker_carrousel_iu0027, Button: u0027broker_carrousel_nu0027, });Interest Rate DifferentialThe interest rate differential between the British pound and the Japanese yen is essentially a mile wide, and as long as thatu0026rsquo;s going to be the case, it makes a lot of sense that traders will be hanging onto this pair as you get paid to do so. With that being the case, I like the idea of buying short-term pullbacks, with perhaps the area right around the u0026yen;190 level as a short-term support level. On the other hand, if we break above the 200-Day EMA, then the market could go looking to the u0026yen;195 level next, which has seen a bit of action in the past size of the candlestick is of course very bullish, and that does suggest that we have more momentum in this market to burn off, meaning that we could go much higher. However, if we were to turn around a breakdown below the u0026yen;188 level, that could send this market crashing back toward the u0026yen;183 level underneath which has been an area of significant noise in the recent past. Ultimately, thatu0026rsquo;s the least likely of scenarios but it is something that you need to keep in the back of your head just in case.
MENAFN17082024000131011023ID1108569595

A daily bearish shooting star pattern triggered today on a drop below Thursday’s low of 2.19. Thursday’s rally tested resistance around the July swing high as natural gas reached 2.27. But it quickly encountered resistance that led to the weekly shooting star candle. This is a normal and typical pullback as the first rally off the bottom retraces prior gains. Along with the 20-Day MA, watch the 50% retracement zone at 2.09. If the 50% level fails to hold as support, then the next lower target zone looks to be around the confluence of the 61.8% Fibonacci retracement at 2.04 and prior daily support and resistance levels
Given the weekly pattern, a drop below this week’s low will signal a bearish reversal on the weekly time frame. However, since it is occurring falling a strong bottom and a bullish breakout from a falling wedge pattern (orange lines), the pullback is anticipated to eventually resolve itself to the upside with a continuation of the bull trend. This is likely only the beginning of a bullish reversal of the trend. This week’s pullback is the first downswing since the bottom at 1.88 (A) in early August.
Once the pullback completes natural gas should begin to reach higher price levels beginning with the 200-Day MA, currently at 2.335. Since the next upswing would be the first test of resistance around the 200-Day line since it failed to hold as support in early-July, there is a good chance price would be rejected to the downside at first. Moreover, as a pullback progresses the 200-Day line may fall further and potentially converge around this week’s high and provide a more significant pivot.
For a look at all of today’s economic events, check out our economic calendar.
“We have changed our EUR/USD forecast. As regular readers know, we believe that a good part of the USD strength seen so far was based on the impression of a structural US growth advantage and a particularly active US monetary policy. Since we now have to assume that this impression will be eroded by actual developments in the coming quarters, we now have to assume USD weakness in the medium term.”
“And because at the same time the EUR-negative argument of high eurozone inflation rates and a fairly relaxed ECB monetary policy is at least significantly weakened in view of our more moderate eurozone inflation forecast, some of the EUR-negative arguments also fall away. Both together mean that we now have to assume that EUR/USD will rise significantly. We consider levels around 1.14 to be possible by mid-2025.”
“In the second half of 2025, the picture could change again. If – as we expect – the US economy picks up again, the impression may arise that the Fed at least no longer has any scope for interest rate cuts, and perhaps even fantasies of interest rate hikes will make themselves felt again. And perhaps it will then be time again for the market to take a more skeptical view of the ECB’s monetary policy.”
The Pound Sterling (GBP) sustained the rebound and hit a two-week high against US Dollar (USD), driving the GBP/USD pair to the 1.2900 mark amid a data-dominated week.
GBP/USD rebounded strongly this week, helped by the return of risk flows and divergent monetary policy outlooks between the US Federal Reserve (Fed) and the Bank of England (BoE).
The high-impact economic data releases from both the US and the UK underscored the central bank’s imbalances regarding their potential policy action. Earlier in the week, strong UK employment data and hot Consumer Price Index (CPI) data prompted investors to dial down their expectations of the BoE lowering interest rate in September.
The annual UK inflation increased to 2.2%, rising back above the BoE’s 2.0% target, the Office for National Statistics (ONS) said, slightly less than the median forecast of 2.3%. Meanwhile, UK employment data was a positive surprise, with the Unemployment Rate falling from 4.4% to 4.2% in the quarter to June, beating market expectations of an increase to 4.5%. These figures were boosted by an increase in part-time jobs.
Data published by the ONS showed Friday that the UK Retail Sales rebounded 0.5% over the month in July after dropping 1.2% in June, aligning with the market forecast of a 0.5% increase in the reported month. The Core Retail Sales, stripping the auto motor fuel sales, jumped 0.7% MoM, against the previous decline of 1.3%, a tad softer than expectations.
On the other hand, strong US Retail Sales and Jobless Claims data combined with a benign inflation report suggested that a September rate cut from the Fed is very well on the table. Retail Sales in the US climbed 1% on the month, according to numbers adjusted for seasonality but not for inflation, beating the expectations of a 0.3% increase by a wide margin. Meanwhile, Initial Jobless claims for the week ended Aug. 10 came in at 227,000, a drop of 7,000 from the previous week and lower than the estimate for 235,000.
The annual US CPI inflation slowed for a fourth consecutive month to 2.9% in July 2024, the lowest since March 2021, compared to 3.0% in June and below forecasts of 3.0, the monthly CPI rebounded 0.2% last month after falling 0.1% in June, the Labor Department’s Bureau of Labor Statistics (BLS) said on Wednesday.
Markets are now pricing in just a 25% chance of a 50 basis points (bps) cut from the Fed next month, down from 55% a week ago, according to the CME Group’s FedWatch tool. However, the odds of a 25 bps September rate reduction still hold above 70%.
Other than policy divergence, risk sentiment remained in a sweeter spot almost throughout the week, following the previous week’s volatility that roiled it. No fresh signs of Middle East geopolitical escalation between Iran and Israel calmed nerves while encouraging US macro news alleviated recession fears.
Although Iran continued to issue warnings against an imminent attack on Israel, no such action was undertaken. Amongst the latest developments, the Israeli Defense Ministry reportedly imposed sanctions on 18 oil tankers transporting Iranian oil to cut down Iran’s vital fuel sale revenues. Iran’s Supreme Leader Ayatollah Ali Khamenei issued a warning on Thursday against any form of retreat or compromise, invoking the concept of “divine wrath”.
With the inflation reports from both sides of the Atlantic now out of the way, Pound Sterling traders eagerly await the Minutes of the Fed’s July policy meeting for fresh cues on the interest-rate outlook.
The Fed Minutes will be reported on Wednesday. The first two days of the week are devoid of any significant economic news from the UK and the US. However, Atlanta Fed President Raphael Bostic’s speech on Tuesday could offer some trading impetus.
Thursday will feature the UK and the US S&P Global preliminary Manufacturing and Services PMI data while the usual US weekly Jobless Claims and Existing Home Sales data will be also eyed.
The three-day annual Kansas City Fed’s Jackson Hole Symposium will be held on Thursday, with key central banks’ officials likely to speak.
Fed Chair Jerome Powell is due to speak at the Symposium on Friday at 14:00 GMT, followed by BoE Governor Andrew Bailey’s speech at 19:00 GMT. Ahead of that the US New Home Sales will be published.
Sentiment around the central banks’ policy expectations will remain a key driving force in the week ahead, with traders also focused on the Middle East geopolitical escalation between Iran and Israel.
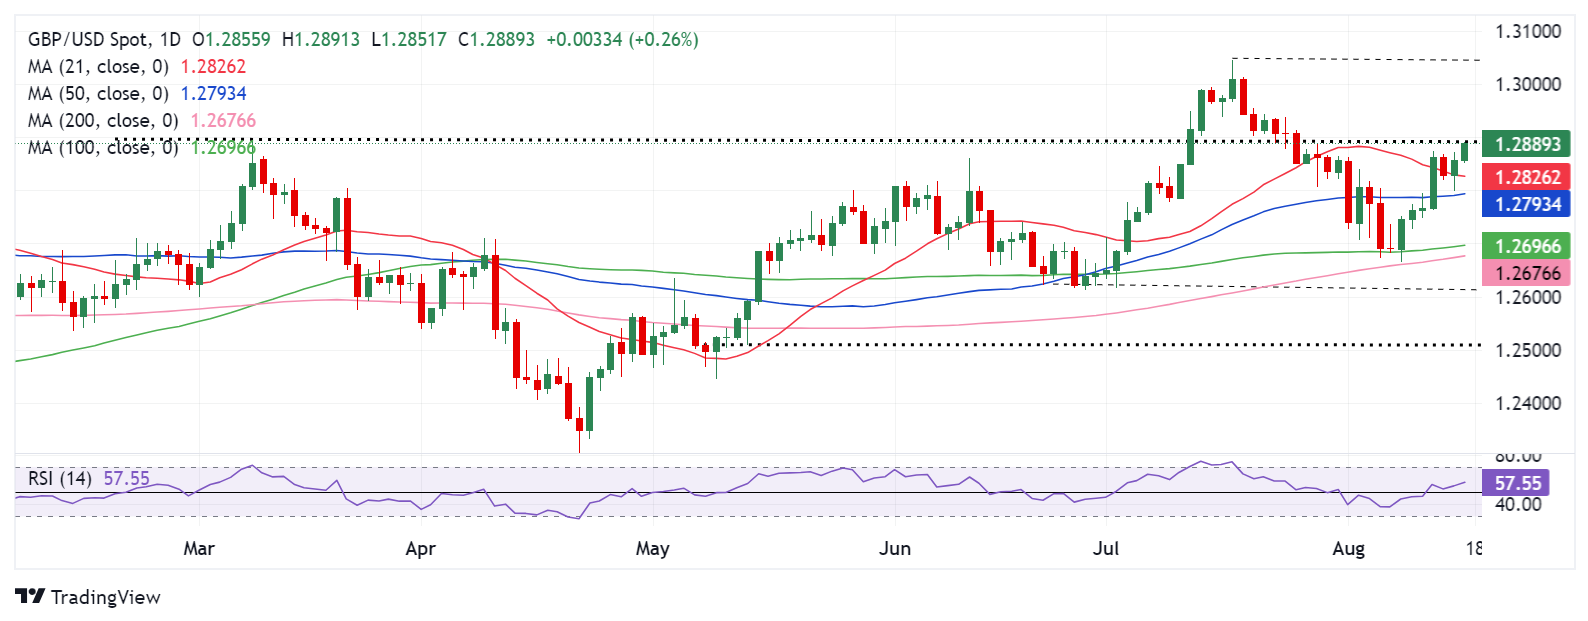
Having defended the crucial 200-day Simple Moving Average (SMA), now at 1.2676, GBP/USD built a solid recovery from five-week lows of 1.2665.
In doing so, Pound Sterling buyers recorded a fresh two-week high just shy of the March 8 high of 1.2893 after recapturing the key 21-day SMA resistance at 1.2825 on a sustained basis.
With the 14-day Relative Strength Index (RSI) pointing north above the 50 level, currently near 56.50, the bullish potential remains intact for the British Pound.
If buyers manage to yield a weekly closing above the March 8 high of 1.2893 or the 1.2900 round figure, a fresh uptrend toward the 1.3000 psychological level cannot be ruled.
Next, the July high of 1.3045 will come into the picture, as buyers would aim for further upside to the 1.3100 level.
On the downside, the 21-day SMA resistance-turned-support at 1.2825 could come to the immediate rescue of buyers, below which the 50-day SMA at 1.2793 will be challenged.
On a sustained break of the 50-day SMA cap, additional declines could be seen toward the 1.2680 demand area, where the 100-day SMA and the 200-day SMA close in.
Thereafter, the June low of 1.2613 and the mid-May low at around 1.2510 will be the next bearish targets.
Central Banks have a key mandate which is making sure that there is price stability in a country or region. Economies are constantly facing inflation or deflation when prices for certain goods and services are fluctuating. Constant rising prices for the same goods means inflation, constant lowered prices for the same goods means deflation. It is the task of the central bank to keep the demand in line by tweaking its policy rate. For the biggest central banks like the US Federal Reserve (Fed), the European Central Bank (ECB) or the Bank of England (BoE), the mandate is to keep inflation close to 2%.
A central bank has one important tool at its disposal to get inflation higher or lower, and that is by tweaking its benchmark policy rate, commonly known as interest rate. On pre-communicated moments, the central bank will issue a statement with its policy rate and provide additional reasoning on why it is either remaining or changing (cutting or hiking) it. Local banks will adjust their savings and lending rates accordingly, which in turn will make it either harder or easier for people to earn on their savings or for companies to take out loans and make investments in their businesses. When the central bank hikes interest rates substantially, this is called monetary tightening. When it is cutting its benchmark rate, it is called monetary easing.
A central bank is often politically independent. Members of the central bank policy board are passing through a series of panels and hearings before being appointed to a policy board seat. Each member in that board often has a certain conviction on how the central bank should control inflation and the subsequent monetary policy. Members that want a very loose monetary policy, with low rates and cheap lending, to boost the economy substantially while being content to see inflation slightly above 2%, are called ‘doves’. Members that rather want to see higher rates to reward savings and want to keep a lit on inflation at all time are called ‘hawks’ and will not rest until inflation is at or just below 2%.
Normally, there is a chairman or president who leads each meeting, needs to create a consensus between the hawks or doves and has his or her final say when it would come down to a vote split to avoid a 50-50 tie on whether the current policy should be adjusted. The chairman will deliver speeches which often can be followed live, where the current monetary stance and outlook is being communicated. A central bank will try to push forward its monetary policy without triggering violent swings in rates, equities, or its currency. All members of the central bank will channel their stance toward the markets in advance of a policy meeting event. A few days before a policy meeting takes place until the new policy has been communicated, members are forbidden to talk publicly. This is called the blackout period.
Silver (XAG/USD) maintains its position above $28, driven by geopolitical tensions and a weaker US dollar. Will these factors continue to support silver prices?
Silver (XAG/USD) commenced the week on a strong note, surging to a high of $28.67 before slightly pulling back to around $28.16. This initial upward momentum was fueled by rising geopolitical tensions in the Middle East, which heightened demand for safe-haven assets such as silver.
Concurrently, a softer US dollar, influenced by the Federal Reserve’s dovish stance and lackluster employment data, has provided additional support to silver prices. Traders are now keenly awaiting the US ISM Services Purchasing Managers Index (PMI), which is anticipated to increase to 51.0 in July from 48.8 in June. A stronger-than-expected PMI could bolster the US dollar, potentially capping silver’s gains.
The US dollar’s decline, driven by the Federal Reserve’s dovish outlook and weak employment figures, has been a boon for silver prices. As a result, US Treasury bond yields and the dollar are expected to remain suppressed, benefiting silver. The market currently predicts a 74% probability of a 50 basis-point rate cut by the Fed in the September meeting. However, Chicago Fed President Austan Goolsbee has warned against overreacting to a single month’s data, highlighting ongoing improvements in inflation and job statistics.
In July, US Nonfarm Payrolls increased by 114,000, down from 179,000 in June and below the anticipated 175,000. The unemployment rate rose to 4.3%, the highest since November 2021, while Average Hourly Earnings increased by 0.2%, falling short of the expected 0.3%.
The combination of a weak US dollar, lower bond yields, and expectations of a Fed rate cut have bolstered silver prices. Additionally, disappointing employment data and a rising unemployment rate have reinforced silver’s appeal as a safe-haven investment.
Heightened tensions in the Middle East are expected to drive demand for safe-haven assets like silver. US Secretary of State Antony Blinken has cautioned G7 nations about potential attacks by Iran and Hezbollah on Israel.
In response, US President Joe Biden is set to convene with the National Security Council to address the situation. Israel is contemplating a preemptive strike on Iran, while Hezbollah has vowed to intensify attacks following Israel’s recent killing of a senior Hezbollah commander and other civilians.
The situation is further complicated by the assassination of Hamas leader Ismail Haniyeh and ongoing clashes between Hezbollah and Israeli forces. These escalating conflicts are likely to support silver prices, alongside a weaker US dollar and declining bond yields.
XAG prices have retraced to $28.16 after peaking at $28.67, influenced by geopolitical tensions and a weak US dollar. Market participants are focusing on the US ISM Services PMI, which could affect future price movements. If geopolitical tensions persist and the dollar remains weak, silver may see further gains.
Currently, Silver (XAG/USD) is priced at $28.16, reflecting a modest increase of 0.04% on the 4-hour chart. The pivot point is set at $28.60, with immediate resistance at $29.15, followed by $29.45 and $29.89.
Key support levels include $27.78, $27.30, and $26.82. The 50-day EMA is $28.63, while the 200-day EMA stands at $29.33, indicating bearish pressure below $28.60.
Silver’s outlook remains bearish if it continues to trade below the pivot. However, a break above $28.60 could trigger bullish momentum, potentially leading to a rise towards the next resistance level.
The USD/JPY outlook paints a bullish picture as the dollar trades near a two-week high against the yen after positive US sales data. Meanwhile, the rate-sensitive yen was weak as US Treasury yields rose amid a decline in Fed rate cut expectations. At the same time, the outlook for Bank of Japan rate hikes remained clouded due to political uncertainty.
–Are you interested in learning more about STP brokers? Check our detailed guide-
The US dollar made a solid bullish move on Thursday after US retail sales rose 1.0% in July. This increase was much bigger than the forecast of a 0.3% gain. Moreover, it showed that the US consumer was resilient. As a result, the likelihood of a 50 bps Fed rate cut in September dropped to 25%. Meanwhile, US Treasury yields rose, weighing on the yen.
Another report revealed that US jobless claims fell last week to 227,000, below forecasts for 235,000. The report reduced fears that the labor market was deteriorating. Low unemployment points to high demand and a tight market.
The upbeat US economic reports followed inflation data showing a moderate increase. As a result, the market is optimistic that the Fed might achieve a soft landing.
On the other hand, the yen was fragile on Friday amid political uncertainty in Japan. Prime Minister Fumio Kishida recently decided to step down, leaving a big gap. He greatly supported the Bank of Japan’s recent hiking cycle. Consequently, analysts believe the BoJ might pause until there is more political certainty before hiking interest rates.
There will be no key economic reports from the US or Japan, so investors will continue absorbing yesterday’s reports.
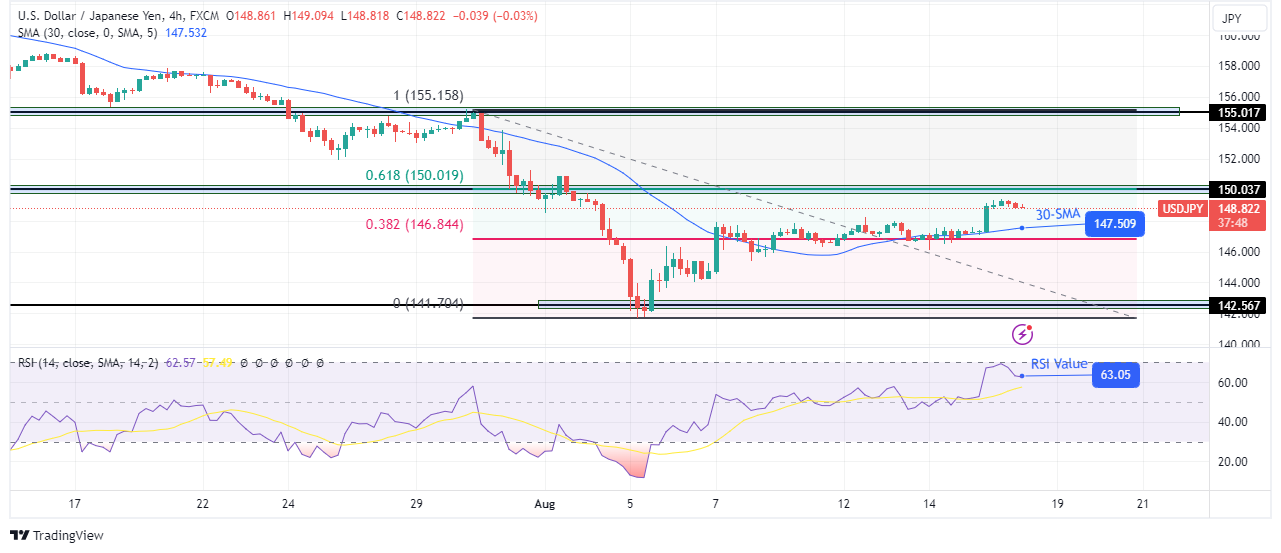
On the technical side, the USD/JPY price has made a sharp, bullish move, detaching from the 30-SMA and the 0.382 Fib level. At the same time, the RSI moved nearer the overbought territory, indicating solid bullish momentum.
–Are you interested in learning more about making money with forex? Check our detailed guide-
The price is approaching a solid barrier comprising the 150.03 resistance and the 0.618 Fib level. Since the bullish bias is strong, the price might soon breach this barrier to make new highs. Such a move would clear the path for bulls to revisit the 155.01 resistance.
Looking to trade forex now? Invest at eToro!
67% of retail investor accounts lose money when trading CFDs with this provider. You should consider whether you can afford to take the high risk of losing your money.