The main category of Forex News.
You can use the search box below to find what you need.
[wd_asp id=1]
The main category of Forex News.
You can use the search box below to find what you need.
[wd_asp id=1]
The EUR/USD pair trades uneventfully around the 1.0920 level on Monday, unable to attract investors one way or the other. Financial markets started the week with a calmer mood, as solid gains among US equities on Friday partially offset concerns about the United States´s (US) economic health. A batch of tepid US data fueled speculation about an upcoming recession and triggered bets about larger and sooner interest rate cuts from the Federal Reserve (Fed).
Speculative interest, however, stepped back ahead of key macroeconomic data to be released this week, as the US will publish an update on the Consumer Price Index (CPI) on Wednesday. According to the market forecast, the CPI is forecasted to be 2.9% YoY in July, while the core annual figure is expected to be 3.2% for the same month, both ticking marginally lower from June’s readings. On the same day, the Eurozone will release the second estimate of the Q2 Gross Domestic Product (GDP), estimated at 0.3% QoQ.
Meanwhile, the macroeconomic calendar has little to offer. Germany released the July Wholesale Price Index, which rose 0.3% MoM, improving from -0.3% the previous month. The American session will not bring relevant macroeconomic figures, which means sentiment will likely continue to lead markets’ movements.
From a technical perspective, the EUR/USD pair seems poised to extend its latest cautious advance. In the daily chart, the pair develops above all its moving averages, with the 20 Simple Moving Average (SMA) grinding higher above the longer ones. At the same time, technical indicators hold within positive levels, with modest upward strength. EUR/USD needs to extend gains past 1.0950 to gain bullish traction and retest its recent highs in the 1.1000 region.
EUR/USD is neutral in the near term. In the 4-hour chart, the pair hovers around a flat 20 SMA, while the longer moving averages provide support far below the current level. Finally, technical indicators head nowhere around their midlines, reflecting the absence of speculative interest.
Support levels: 1.0890 1.0845 1.0800
Resistance levels: 1.0950 1.1005 1.1045
Spot Gold kept rallying on Monday, up for a third consecutive day and currently trading above $2,460 a troy ounce. The bright metal kicked off the week with a positive tone amid easing demand for the US Dollar. Meanwhile, concerns about escalating tensions in the Middle East fueled demand for Gold. Western countries issued a warning about a potential attack from Iran on Israel that would dilute any chance of a cease-fire.
XAU/USD surged on the back of mounting speculation the United States (US) Federal Reserve (Fed) had no more room to delay rate cuts. The Fed is expected to deliver its first cut in the upcoming September meeting, with a potential 50 basis points (bps) trim on the table.
US data to be out this week may shed some light on the matter: The country will publish July inflation data next Wednesday. The Consumer Price Index (CPI) is foreseen to tick modestly lower compared to the previous month but still above the central bank’s goal of around 2%. However, it’s not all about inflation. Policymakers will have to assess the risk of an economic setback should they decide not to trim record rates.
From a technical point of view, XAU/USD is poised to extend its advance. In the daily chart, technical indicators have turned north after a brief consolidation within positive levels. Furthermore, the pair is trading above all its moving averages, with the 20 Simple Moving Average (SMA) gaining upward traction above already bullish 100 and 200 SMAs. XAU/USD has overcome the 23.6% Fibonacci retracement of the June/July rally at $2,438.80, a relevant support level in the case of a pullback.
In the near term, and according to the 4-hour chart, XAU/USD is overbought but giving no signs of changing course as the pair pressures its intraday high. Technical indicators, in the meantime, pared their advances and hover within extreme levels, reflecting the ongoing pause rather than suggesting an upcoming decline. Finally, the 20 SMA heads firmly north below the current level and above directionless longer ones, reflecting bulls’ dominance and maintaining the risk skewed to the upside.
Support levels: 2,442.90 2,438.80 2,425.10
Resistance levels: 2,466.00 2,483.70 2,495.10
That 2.27 price level was resistance on July 22. It also marks the beginning of a bullish descending wedge pattern (orange boundary lines). The beginning of the wedge is typically the minimum target for the pattern. Arguably, that target of 2.27 was reached with today’s high of 2.26. After today’s close a drop below the 2.155 low of the day will trigger a daily bearish reversal. The 20-Day MA is the first obvious target at 2.09.
A near-term bullish outlook would be maintained as long as natural gas stays above the 20-Day line. It had been marking trend resistance since late-June until last Thursday’s bullish breakout. Subsequently, if price is rejected to the upside upon approach, the 20-Day line will be confirmed as having switched to a line of potential support.
That would be bullish behavior that may mark the end of a retracement. However, there is also a potential support zone lower down around 2.03 to 2.02. That range begins with the low from last Thursday and was an area of daily support or resistance at more than several times over the past month.
If a pullback comes before a rally above the 2.27 interim swing high, it is anticipated to eventually resolve itself to the upside as a bullish reversal may still be in its early stages. In addition to a bullish wedge breakout last week, natural gas also triggered a bullish reversal on the weekly chart. Today’s advance further confirms the breakout. It was the first time in eight weeks that a prior week’s high was exceeded to the upside. This is bullish behavior occurring on the longer time frame chart, which is more significant than the daily and lower periods.
For a look at all of today’s economic events, check out our economic calendar.
The Australian dollar gapped lower to kick off the trading session on Monday, but then turned around the show signs of life again, as we have rallied quite significantly. We have slammed into the 200 day EMA, which of course is an indicator that a lot of people pay attention to, so it’ll be interesting to see if this holds as resistance again. If we do break above here, then the 0.6650 level is the most likely target that we will be looking for in the short term. On the other hand, if we do pull back, then the 0.6550 level is support. Anything below there opens up a move down to the 0.65 level.
Keep in mind that there are a lot of questions about what the Federal Reserve is going to do and with that being the case, it’ll be interesting to see how the greenback affects this pair. Furthermore, you have to keep in mind that the Australian dollar is highly sensitive to the commodities markets and that of course in and of itself will cause a lot of volatility as commodities are all over the place right now.
With all of that being said, we are basically in the middle of a consolidation phase. And because of this, I don’t know that anybody has a huge advantage. Any advantage probably comes externally, maybe based on some type of economic announcement in the United States or something. But right now, I think we’re just meandering around this area yet again.
For a look at all of today’s economic events, check out our economic calendar.
This article was originally posted on FX Empire
Trading the Japanese Yen
The USD/JPY exchange rate has suffered a sharp reversal as investors focused on the actions of the Bank of Japan and the US Federal Reserve. For a long time, interest rates between the US and Japan were vastly divergent. Recently, US interest rates were 5.50% while in Japan they were at -0.10%. This gap created an exciting carry trade opportunity as many investors borrowed heavily to invest in other countries, especially the US. Now, the pendulum has swung, and the Bank of Japan has moved out of negative interest rates and raised interest rates to 25 basis points. It has done so in an attempt to combat inflation, which has remained above 2% for the past few months.
On the other hand, the US Federal Reserve has hinted that it will start cutting US interest rates, joining other central banks such as the Bank of England (BoE), the European Central Bank (ECB), and the Swiss National Bank (SNB). Overall, the chances of the US cutting interest rates have increased in recent weeks after the US released mixed economic data. According to the Bureau of Labor Statistics (BLS), inflation in the country has declined for the past three consecutive months. According to the economic calendar, the headline Consumer Price Index (CPI) rose to 3.0% while the Personal Consumption Expenditure (PCE) inflation figure fell to 2.5%. Meanwhile, these numbers are higher than the Fed’s 2% target, they are moving in the right direction.
The Labor market, the other part of the Fed’s dual mandate, is weakening, with the unemployment rate rising to 4.3%. Historically, the economy has entered a recession whenever the unemployment rate has risen for five consecutive months. Other economic figures related to Labor productivity, manufacturing output, and industrial production were also weaker than expected.
Therefore, the US Federal Reserve is in an unpredictable position. Failure to cut interest rates now could push the US economy into a deep recession. On the other hand, aggressively cutting interest rates would fuel inflation. Overall, analysts have mixed views on what to expect when the Fed meets in September and when Jerome Powell speaks at the Jackson Hole symposium. Some analysts expect the bank to deliver a hefty 0.50% hike at this meeting followed by smaller 0.25% cuts. On the other hand, other analysts believe that the cut should start at 0.25% to prevent inflation risks.
Therefore, the continuous rise of the USD/JPY pair has led some analysts to expect that the unwinding of the Japanese yen trade is over. However, we believe that this trade is still entrenched in the market and that it will take time and cause more damage for a while. Furthermore, the size of the Japanese yen trade remains unclear. Analysts at Deutsche Bank believe it could be worth over $20 trillion, a figure equal to about 505% of Japan’s GDP and even larger than China’s GDP. Ultimately, we believe this view is grossly exaggerated.
Taking a look at the Bank for International Settlements (BIS) data estimates the Japanese yen trade to be worth around $1 trillion while other figures suggest it is 3.4 trillion yen. These figures mean that the yen trade is huge, and it will take some time to unwind.

The daily chart shows that the USD/JPY exchange rate peaked at 161.87 in July and has collapsed sharply in the past few weeks. Clearly, this decline occurred when the Bank of Japan started raising interest rates and intervening in the Forex market. According to the trades, the pair has fallen below the 50-day and 200-day EMAs, and the pair is about to make a bearish crossover. In most cases, this pattern is one of the most bearish patterns in the market.
After the sharp decline on Bloody Monday, the pair rebounded from 141 to 147. This rebound occurred after the pair formed a hammer candle, which is a sign of a bullish reversal.
The pair retested the 38.2% Fibonacci retracement point. At the same time, the Relative Strength Index (RSI) and Stochastic have indicated a rise and have exited the oversold level. Therefore, we believe that the USD/JPY pair is going through an unexpected rebound period and will resume the downtrend in the near term. If this happens, the next point to watch will be at 141.77, its low this week. A break below this level will take the pair to 140.
Ready to trade our daily forex forecast? Here are the best forex brokers in Japan to choose from.
While the range of the US dollar’s rise remained largely limited, the “US dollar” received support from a larger-than-expected decline in the latest initial jobless claims report. According to the results of the economic calendar, the number of Americans filing for unemployment benefits fell to 233,000 for the week ended August 3, missing market expectations of 240,000 and down from an upwardly revised 250,000 the week before. Coming on the heels of last week’s bleak US employment data, signs that the US labor market may be stronger than expected helped keep the US dollar afloat on Thursday afternoon.
Commenting on the US jobs data, Joe Brusuelas, chief economist at RSM US LLP, commented on the X online platform: “A big drop in US initial jobless claims to 233,000. Anything in that range tends to indicate a fairly healthy labor market. Furthermore, non-seasonally adjusted to 203,000. Also, a big drop in Texas to 7,000. This tends to point to doubts that weather played a role in the July jobs report, particularly around those who are not working – whether full-time or part-time – which is justified”
After undergoing significant selling earlier in the week amid fears of a US economic recession that gripped global markets, the US dollar appeared to end the week quietly. However, strong expectations that the Federal Reserve will begin an aggressive monetary tightening cycle next month put additional pressure on US dollar exchange rates, preventing a strong rebound for the greenback.
Conversely, the Pound Sterling (GBP) was largely subdued on Thursday as the UK calendar remained light. In the absence of new UK data, investors remained hesitant to place any aggressive bets on the pound sterling as continued civil unrest continued to dampen sterling sentiment. Right-wing extremist riots across British cities throughout the week have undermined hopes for renewed political stability under a new Labor government, thus deterring investor interest in the pound sterling.
Somewhere else, growing bets on a Bank of England rate cut have added to the pressure on the pound. After fears of a global recession rattled markets earlier in the week, markets are now expecting two more rate cuts by the central bank this year.
Looking ahead, a data-free weekend in both the UK and the US could leave the GBP/USD exchange rate trading sideways. With the lack of data, global risk dynamics could continue to drive movement in the currency pair. Meanwhile, cheerful trading conditions could provide support for the increasingly risk-sensitive pound against its safer rivals. Alternatively, a return to nervous trading could see the US dollar take priority.
Elsewhere, the easing of interest rate cut speculation could weigh on currency movement. As markets continue to price in multiple rate cuts from the Fed and the Bank of England in the coming months, each currency may face additional pressure amid a lack of supportive data.
This week, GBP/USD may react heavily to the release of US and UK inflation figures, along with investor sentiment towards risk appetite and the future of global central bank policies. Meanwhile, the overall outlook for GBP/USD is bearish and will strengthen if it moves back towards the support levels of 1.2645 and 1.2580 respectively. On the other hand, the psychological resistance of 1.3000 will remain the most important for the general trend to turn to the upside.
Ready to trade our daily Forex forecast? Here’s some of the best forex broker UK reviews to check out.
The USD/JPY forecast leans bullish as dollar gains continue after last week’s stronger-than-expected employment figures. Meanwhile, the yen remained vulnerable due to uncertainty about a near-term Bank of Japan rate hike.
–Are you interested in learning more about STP brokers? Check our detailed guide-
The dollar edged higher as Fed rate cut expectations eased. This shift comes after unemployment claims data on Thursday showed a bigger-than-expected drop. The US labor market has been the reason behind recent market volatility. The last monthly report raised fears that the economy was experiencing a rapid slowdown. As a result, markets raised the chances of a 50 bps cut in September.
However, as last week ended, recession fears eased as jobless claims data showed continued strength in the sector. Nevertheless, investors expect the Fed to lower borrowing costs by 100 bps this year. At the same time, policymakers have acknowledged recent signs of weakness by assuming a more dovish stance.
This week, the focus will be on the US Consumer Price Index report. Economists expect inflation to hold steady at 3.0% in July. Meanwhile, the monthly rate might increase by 0.2%. If the figures meet expectations, rate-cut bets will remain intact. On the other hand, lower or higher figures could cause a lot of volatility.
Meanwhile, the yen fell on Monday after policymaker comments last week reduced the likelihood of a near-term BoJ hike. A slower-than-expected hiking cycle might hurt the yen by keeping the US-Japan rate gap wide.
It will be a slow start to the week as investors await US inflation data on Tuesday and Wednesday.
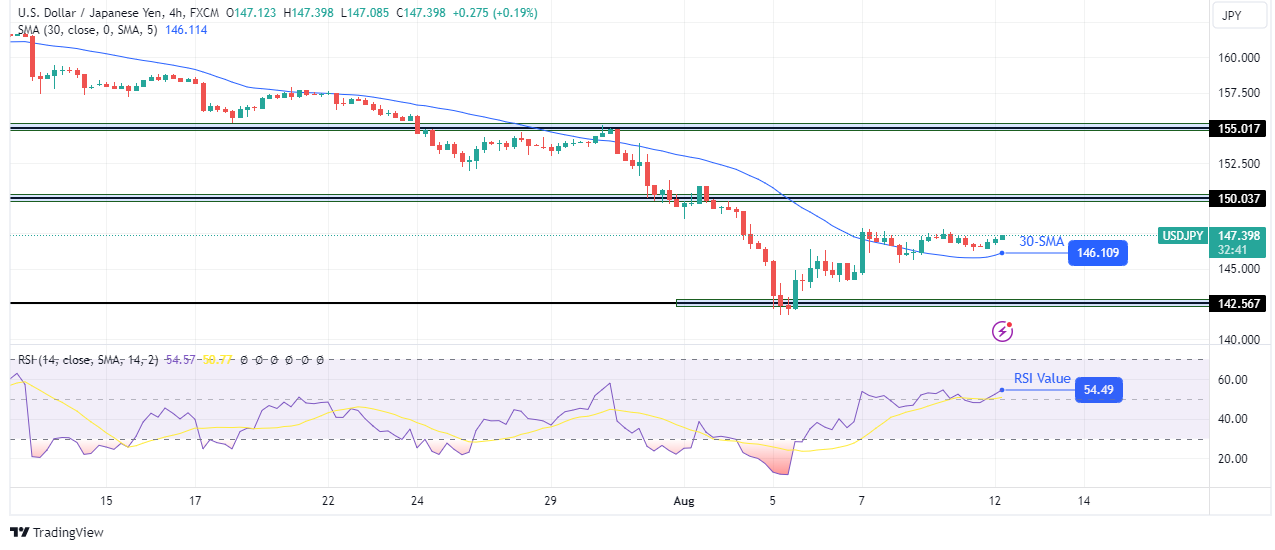
On the technical side, the USD/JPY price trades above the 30-SMA after a recent reversal. At the same time, the RSI trades above 50, supporting bullish momentum. Bulls took charge at the 142.56 key level. However, they are yet to find their feet above the SMA.
–Are you interested in learning more about making money with forex? Check our detailed guide-
Price action shows small-bodied candles, a sign of weak enthusiasm. Moreover, the price stays close to the SMA in a shallow move. If bulls regain momentum, USD/JPY will retest the 150.03 key level; otherwise, bears will trigger a decline in support to 142.56.
Looking to trade forex now? Invest at eToro!
67% of retail investor accounts lose money when trading CFDs with this provider. You should consider whether you can afford to take the high risk of losing your money.
EUR/USD continues to move up and down in a narrow range above 1.0900 after closing the previous week virtually unchanged. The pair’s technical outlook does not offer any directional clues as investors remain on the sidelines while keeping a close eye on geopolitical headlines.
The table below shows the percentage change of Euro (EUR) against listed major currencies last 7 days. Euro was the weakest against the New Zealand Dollar.
| USD | EUR | GBP | JPY | CAD | AUD | NZD | CHF | |
|---|---|---|---|---|---|---|---|---|
| USD | -0.06% | 0.31% | 0.50% | -1.07% | -1.27% | -1.17% | 1.23% | |
| EUR | 0.06% | 0.29% | 0.40% | -1.13% | -1.20% | -1.22% | 1.19% | |
| GBP | -0.31% | -0.29% | 0.17% | -1.40% | -1.48% | -1.50% | 0.89% | |
| JPY | -0.50% | -0.40% | -0.17% | -1.52% | -1.80% | -1.64% | 0.77% | |
| CAD | 1.07% | 1.13% | 1.40% | 1.52% | -0.17% | -0.10% | 2.14% | |
| AUD | 1.27% | 1.20% | 1.48% | 1.80% | 0.17% | -0.02% | 2.41% | |
| NZD | 1.17% | 1.22% | 1.50% | 1.64% | 0.10% | 0.02% | 2.43% | |
| CHF | -1.23% | -1.19% | -0.89% | -0.77% | -2.14% | -2.41% | -2.43% |
The heat map shows percentage changes of major currencies against each other. The base currency is picked from the left column, while the quote currency is picked from the top row. For example, if you pick the Euro from the left column and move along the horizontal line to the US Dollar, the percentage change displayed in the box will represent EUR (base)/USD (quote).
Markets turn cautious at the beginning of the week on growing fears over the Iran-Israel conflict turning into a deepening crisis in the Middle East. Although Euro Stoxx 50 Index is modestly higher in the first trading session of the week, US stock index futures struggle to gain traction.
The economic calendar will not offer any high-impact macroeconomic data releases on Monday. On Wednesday, the US Bureau of Labor Statistics will publish the Consumer Price Index (CPI) data for July.
In case geopolitical tensions escalate further in the second half of the day, major equity indexes in the US could turn south. In this scenario, the US Dollar (USD) could hold its ground against its major rivals and make it difficult for EUR/USD to gain traction. On the other hand, the pair could stretch higher if risk flows return to markets following Wall Street’s opening bell.
The Relative Strength Index (RSI) indicator on the 4-hour chart continues to move sideways near 50, reflecting EUR/USD’s indecisiveness.
First support could be seen at 1.0900 (psychological level, static level) ahead of 1.0880-1.0870, where the 100-period and the 20-day Simple Moving Averages (SMA) are located, and 1.0845 (200-period SMA).
In case the pair breaks above 1.0940 (static level), it could encounter next resistance levels at 1.0960 (static level) and 1.1000 (psychological level, static level).
The Euro is the currency for the 20 European Union countries that belong to the Eurozone. It is the second most heavily traded currency in the world behind the US Dollar. In 2022, it accounted for 31% of all foreign exchange transactions, with an average daily turnover of over $2.2 trillion a day. EUR/USD is the most heavily traded currency pair in the world, accounting for an estimated 30% off all transactions, followed by EUR/JPY (4%), EUR/GBP (3%) and EUR/AUD (2%).
The European Central Bank (ECB) in Frankfurt, Germany, is the reserve bank for the Eurozone. The ECB sets interest rates and manages monetary policy. The ECB’s primary mandate is to maintain price stability, which means either controlling inflation or stimulating growth. Its primary tool is the raising or lowering of interest rates. Relatively high interest rates – or the expectation of higher rates – will usually benefit the Euro and vice versa. The ECB Governing Council makes monetary policy decisions at meetings held eight times a year. Decisions are made by heads of the Eurozone national banks and six permanent members, including the President of the ECB, Christine Lagarde.
Eurozone inflation data, measured by the Harmonized Index of Consumer Prices (HICP), is an important econometric for the Euro. If inflation rises more than expected, especially if above the ECB’s 2% target, it obliges the ECB to raise interest rates to bring it back under control. Relatively high interest rates compared to its counterparts will usually benefit the Euro, as it makes the region more attractive as a place for global investors to park their money.
Data releases gauge the health of the economy and can impact on the Euro. Indicators such as GDP, Manufacturing and Services PMIs, employment, and consumer sentiment surveys can all influence the direction of the single currency. A strong economy is good for the Euro. Not only does it attract more foreign investment but it may encourage the ECB to put up interest rates, which will directly strengthen the Euro. Otherwise, if economic data is weak, the Euro is likely to fall. Economic data for the four largest economies in the euro area (Germany, France, Italy and Spain) are especially significant, as they account for 75% of the Eurozone’s economy.
Another significant data release for the Euro is the Trade Balance. This indicator measures the difference between what a country earns from its exports and what it spends on imports over a given period. If a country produces highly sought after exports then its currency will gain in value purely from the extra demand created from foreign buyers seeking to purchase these goods. Therefore, a positive net Trade Balance strengthens a currency and vice versa for a negative balance.
If we can break above the 50 day EMA, then it’s likely that this market will continue to go much higher, perhaps reaching the 1.2850 level.
Anything above there then really gets things going. But what I would point out is that the 200 day EMA has held as support. And from a technical analysis standpoint, that’s a very bullish and positive turn of events. The candlestick size itself during the trading session on Friday isn’t necessarily anything special, but the candlestick on Thursday most certainly was. It looks as if we are ready to continue to grind higher and that might be the main feature here. The fact that we are grinding and not necessarily shooting straight up in the air. That does make a certain amount of sense.
So, I think ultimately, you’ve got a scenario where traders will continue to look at dips as potential buying opportunities, at least until we break down below the 200 day EMA, which ostensibly means the 1.2650 level below. I do expect a lot of choppy volatility, but that’s not necessarily an indictment on this pair. It’s just the way things have been in most financial markets. I don’t know that much will change as far as the way we are seeing more caution in a lot of markets. GBP/USD is a pair that favors the US Dollar on safety concerns, but the British Pound certainly won’t be as susceptible to few selling as many of the other currencies that I cover.
Ready to trade our Forex daily analysis and predictions? Here’s the best forex trading company in UK to trade with.
Gold price is trading on the back foot near $2,430 early Monday, consolidating the previous week’s late recovery. Traders appear non-committal and refrain from placing fresh bets on Gold price, bracing for an action-packed week, with US Consumer Price Index (CPI) inflation data in the spotlight.
Traders take account of the latest developments surrounding the Middle-East geopolitical tensions, with Israel preparing for an imminent attack by Iran, in retaliation for the assassination of Hamas leader Ismail Haniyeh in Tehran in late July. On Sunday, Axios reported that the Israeli intelligence community is put on a high alert, as it is believed that Iran has decided to attack Israel directly and may do so within days.
Meanwhile, ABC News reported early Monday that the Israel Defense Forces (IDF) intercepted roughly 30 “projectiles” that were identified as crossing from Lebanon into northern Israel. This comes even as Hamas proposed a cease-fire implementation plan after a diplomatic push from the United States, Egypt and Qatar for a new round of talks to take place between Israel and Hamas on Aug. 15 in either Doha or Cairo.
If the Iran-backed militant groups, Hezbollah and Hamas, turn down any cease-fire attempts and attack Israel, the escalation could very well translate into a wider regional conflict. Mounting geopolitical tensions are likely to keep the safe-haven US Dollar (USD) buoyed, weighing negatively on the USD-denominated Gold price.
However, the downside in the Gold price could likely be cushioned by the increased bets that the US Federal Reserve (Fed) will lower interest rates by 50 basis points (bps) in September. Although the odds for such a move have fallen to less than 50% when compared to about 75% a week ago, the CME Group’s FedWatch Tool showed.
This could be attributed to Fed Governor Michelle Bowman’s caution on rate cuts during her speech on Saturday. Bowman noted that there is some further “welcome” progress on inflation even as inflation remains “uncomfortably above” the central bank’s 2% goal.
Markets remain in a wait-and-see mode before taking any calls on the next Gold price direction, as position readjustments could be seen heading into Wednesday’s US CPI showdown. The headline annual CPI is set to rise 2.9% in July after increasing by 3.0% in June. Meanwhile, the core inflation is expected to edge a tad lower to 3.2% YoY in July versus June’s 3.3% print.
As observed on the daily chart, Gold price keeps its range while holding within a symmetrical triangle formation.
The key leading indicator, the 14-day Relative Strength Index (RSI) holds well above the 50 level, suggesting that upside risks remain in place for Gold price in the near term.
Gold buyers also stay hopeful so long as the 21-day Simple Moving Average (SMA) at $2,417 holds.
However, if the pullback extends, sellers need to crack the 21-day SMA on a daily closing basis to unleash further downside.
Further south, the $2,400 threshold will come into play, below which the rising trendline support at $2,388 will be under threat.
Alternatively, the immediate upside barrier is seen at the August 5 high of $2,459, above which the falling trendline resistance at $2,465 and the two-week high of $2,478 will be challenged.
Gold has played a key role in human’s history as it has been widely used as a store of value and medium of exchange. Currently, apart from its shine and usage for jewelry, the precious metal is widely seen as a safe-haven asset, meaning that it is considered a good investment during turbulent times. Gold is also widely seen as a hedge against inflation and against depreciating currencies as it doesn’t rely on any specific issuer or government.
Central banks are the biggest Gold holders. In their aim to support their currencies in turbulent times, central banks tend to diversify their reserves and buy Gold to improve the perceived strength of the economy and the currency. High Gold reserves can be a source of trust for a country’s solvency. Central banks added 1,136 tonnes of Gold worth around $70 billion to their reserves in 2022, according to data from the World Gold Council. This is the highest yearly purchase since records began. Central banks from emerging economies such as China, India and Turkey are quickly increasing their Gold reserves.
Gold has an inverse correlation with the US Dollar and US Treasuries, which are both major reserve and safe-haven assets. When the Dollar depreciates, Gold tends to rise, enabling investors and central banks to diversify their assets in turbulent times. Gold is also inversely correlated with risk assets. A rally in the stock market tends to weaken Gold price, while sell-offs in riskier markets tend to favor the precious metal.
The price can move due to a wide range of factors. Geopolitical instability or fears of a deep recession can quickly make Gold price escalate due to its safe-haven status. As a yield-less asset, Gold tends to rise with lower interest rates, while higher cost of money usually weighs down on the yellow metal. Still, most moves depend on how the US Dollar (USD) behaves as the asset is priced in dollars (XAU/USD). A strong Dollar tends to keep the price of Gold controlled, whereas a weaker Dollar is likely to push Gold prices up.