The main category of Forex News.
You can use the search box below to find what you need.
[wd_asp id=1]
The main category of Forex News.
You can use the search box below to find what you need.
[wd_asp id=1]
Gold price (XAU/USD) trades on a negative note around $2,430 during the early Asian session on Monday. The modest recovery of the US Dollar (USD) drags the yellow metal lower on the day. However, the downside might be limited amid the heightened geopolitical tensions in the Middle East.
Tensions in the Middle East would maintain the XAU/USD bid, with reports showing an intensification of the war. On Sunday, Defence Minister Yoav Gallant informed US Defence Secretary Lloyd Austin that Iran’s military preparations indicated the country is preparing for a large-scale strike on Israel, according to Axios writer Barak Ravid on X, citing a person familiar with the call.
Heightened volatility and elevated geopolitical risks are likely to boost safe-haven flows, benefiting the precious metal. “In the medium term, the outlook for gold remains positive, with any dips likely to be short-lived due to underlying macroeconomic factors,” said Zain Vawda, market analyst at MarketPulse by OANDA.
Investors are split on whether the US Federal Reserve (Fed) would be aggressive in its monetary policy by announcing a 50 basis point (bps) interest rate cut or a 25 bps cut. The key US economic data this week might offer some hints about economic conditions, with the release of the US Producer Price Index (PPI), Consumer Price Index (CPI) and Retail Sales. The stronger-than-expected data might delay or diminish the odds of deeper Fed rate cuts, which weigh on the Gold price.
Gold has played a key role in human’s history as it has been widely used as a store of value and medium of exchange. Currently, apart from its shine and usage for jewelry, the precious metal is widely seen as a safe-haven asset, meaning that it is considered a good investment during turbulent times. Gold is also widely seen as a hedge against inflation and against depreciating currencies as it doesn’t rely on any specific issuer or government.
Central banks are the biggest Gold holders. In their aim to support their currencies in turbulent times, central banks tend to diversify their reserves and buy Gold to improve the perceived strength of the economy and the currency. High Gold reserves can be a source of trust for a country’s solvency. Central banks added 1,136 tonnes of Gold worth around $70 billion to their reserves in 2022, according to data from the World Gold Council. This is the highest yearly purchase since records began. Central banks from emerging economies such as China, India and Turkey are quickly increasing their Gold reserves.
Gold has an inverse correlation with the US Dollar and US Treasuries, which are both major reserve and safe-haven assets. When the Dollar depreciates, Gold tends to rise, enabling investors and central banks to diversify their assets in turbulent times. Gold is also inversely correlated with risk assets. A rally in the stock market tends to weaken Gold price, while sell-offs in riskier markets tend to favor the precious metal.
The price can move due to a wide range of factors. Geopolitical instability or fears of a deep recession can quickly make Gold price escalate due to its safe-haven status. As a yield-less asset, Gold tends to rise with lower interest rates, while higher cost of money usually weighs down on the yellow metal. Still, most moves depend on how the US Dollar (USD) behaves as the asset is priced in dollars (XAU/USD). A strong Dollar tends to keep the price of Gold controlled, whereas a weaker Dollar is likely to push Gold prices up.

These trades gave a total win of 5.57%, averaging a win of 0.62% per asset.
Last week’s key takeaways were:
It will be a busier week ahead in terms of data, with the most important items this coming week expected to be:
I forecast that the EUR/USD currency pair will rise in value for August. The performance of my forecast so far is as follows:

Last week, I forecasted that the following currency crosses would rise in value:
This was a good, profitable forecast.
This week, I gave no weekly forecast, as only one major currency pair or cross fluctuated in value by more than 2%. The odds of profitable reversals are better when several crosses have abnormally large price movements.
Directional volatility in the Forex market fell dramatically last week following a very volatile period. Only 30% of the most important currency pairs and crosses fluctuated by more than 1%.
Last week, the Canadian Dollar was the strongest major currency, while the Swiss Franc was the weakest.
You can trade these forecasts in a real or demo Forex brokerage account.

The US Dollar Index printed a weakly bullish pin bar last week, rejecting both the lower ascending trend line of the consolidating triangle chart pattern, which has been holding the Dollar for almost two years, and the horizontal support level at 102.25. These are bullish signs, although the bounce was not particularly strong. On the other hand, the price is below its levels three months ago and six months ago, indicating a long-term bearish trend in the greenback.
The US Dollar was not the main factor in the markets last week, with several other assets seeing much more dramatic swings, such as the Japanese Yen and Australian Dollar. However, that could probably change this week, as we will get the release of US CPI, which can cause big moves if it is surprising.
This week, I am cautiously bearish on the US Dollar due to the bearish trend. However, it is likely much will depend upon the US CPI data release to determine where the greenback ends this coming week.

I expected the EUR/USD currency pair to have potential resistance at $1.0998.
The H1 price chart below shows how the price action rejected this resistance level with a large bearish inside bar, marked by the down arrow within the price chart below, rejecting this resistance level shortly after the start of last Monday’s London / New York session overlap, signalling the timing of this bearish rejection.
This trade could still be open, but it has been nicely profitable so far, with a maximum reward-to-risk ratio of slightly more than 2 to 1.
Despite this bearish play setting up, I am bullish on this currency pair. It has recently made a new long-term high without making an overly deep bearish retracement, suggesting a valid long-term trend exists. That is why I hold a long position open here right now. I cannot say I am very optimistic about this trade, though, so maybe a smaller position is suitable.

I expected the USD/CHF currency pair to have potential support at $0.8435.
The H1 price chart below shows how the price action rejected this support level with a large bullish engulfing candlestick, marked by the up arrow within the price chart below, rejecting this support level shortly after the start of last Monday’s London / New York session overlap, signalling the timing of this bearish rejection.
This trade could still be open, but it has been nicely profitable so far, giving a maximum reward-to-risk ratio of more than 3 to 1.
The Swiss Franc made a very strong advance over the previous week, and the price bounced back this week.

Gold fell slightly in US Dollar terms last week. It initially dropped during the large risk-off swing early in the week before making a strong recovery. The precious metal ended the week not far from a new record all-time high closing price, which would be a bullish entry signal for trend or breakout traders.
I do not think Gold is looking bullish enough to justify a new long trade entry, but it threatens to make a technically significant bullish breakout, so it is worth watching.
The US Dollar is in a long-term bearish trend, which may help the price of Gold advance.
Bulls will look for a daily close above $2,470 or, even better, the big quarter-number at $2,500 before entering a new long trade here.
However, price action is choppy, with many recent deep retracements within the long, slow, bullish movement we have seen in Gold over recent months.

The S&P 500 Index, like several other risky assets, fell sharply at the start of the week before rebounding strongly enough to close higher, printing quite a large bullish pin bar,
This was the first bullish weekly candlestick we have seen after three consecutive weeks of declines, suggesting that this may be a significant bullish reversal candlestick.
The long-term trend remains bullish, although the decline from the recent record high made only a few weeks ago was deep enough to know out most trend traders.
Over the past few weeks, the S&P 500 Index has begun to outperform the NASDAQ 100 index.
Anyone who sees this as an important supportive bounce in stock markets might prove their conviction with a long trade entry upon a break of last week’s high. I personally prefer to wait for a new all-time high, as we only recently had one a few weeks ago, before entering a new long trade here.

I see the best trading opportunities this week as:
Ready to trade our Forex weekly forecast? We’ve made a list of the best Forex brokers worth reviewing.
There’s also a lot to be said about the copper market and its predictive qualities for Asian markets, as it is used in so much construction in places like China and Indonesia, which of course are the hotbeds of global growth that a lot of people put money into. Because of this, the market is one that a lot of people will pay attention to in order to assess what the Australian dollar is going, Australian stocks, as well as other hard assets that are in such high demand in places like mainland China.
The market recently pulled back to the 50% Fibonacci retracement level, but over the last couple of days has rallied a bit in order to break back above the 50-Day EMA. By doing so, the market looks as if it is ready to continue to go higher, and if we can break above the crucial $10,000 level in the spot market, I think you have a real shot at copper taking off in trying to get back to the previous highs, near the $11,150 level. Whether or not we can break above there remains to be seen, but that is a big enough mood that I think most people would be happy with taking advantage of it.
Keep in mind the Friday as the jobs number in the United States and that can have a major influence on risk appetite, at least in the short term. Pullbacks at this point should see the $9500 level has potential support, as it had been previously. If we break down below there, then we could go looking to the 61.8% Fibonacci retracement level, which is backed up by the crucial 200-Day EMA. All of that being said, I am more bullish than bearish at this point, and I do think copper could be a great trade if you are paying attention to it.
Ready to trade our Forex daily forecast? We’ve shortlisted the best forex broker list for beginners for you to check out.
The USD/JPY forecast shows increased bearish sentiment as the yen surged after the Bank of Japan raised interest rates. At the same time, Japan’s central bank announced plans to reduce its massive economic stimulus. Meanwhile, investors were preparing for the Fed policy meeting.
–Are you interested in learning more about Forex robots? Check our detailed guide-
The yen is heading for a monthly gain of 5%. The recent rally came after the BoJ hiked rates on Wednesday, tightening its monetary policy. Japan’s rates are now at 0.25%, meaning the policy divergence between the BoJ and the Fed is shrinking.
The yen’s rally in July was caused by several factors. First, the Bank of Japan intervened in the markets by buying the yen and selling the dollar, resulting in a brief increase in demand for the yen.
Second, there was more speculation about a possible rate hike at the end of the month. Consequently, investors started pricing in higher rates even before the policy meeting. As it turns out, the BoJ did not disappoint.
Third, markets hoped the BoJ would announce plans to reduce its bond purchases. However, the actual figures came in lower than expected. The central bank expects to halve its bond purchases by the first quarter of 2026.
Elsewhere, there was caution ahead of the Fed policy meeting. The US central bank will likely keep interest rates unchanged. However, traders hope policymakers will signal the first rate cut in September.
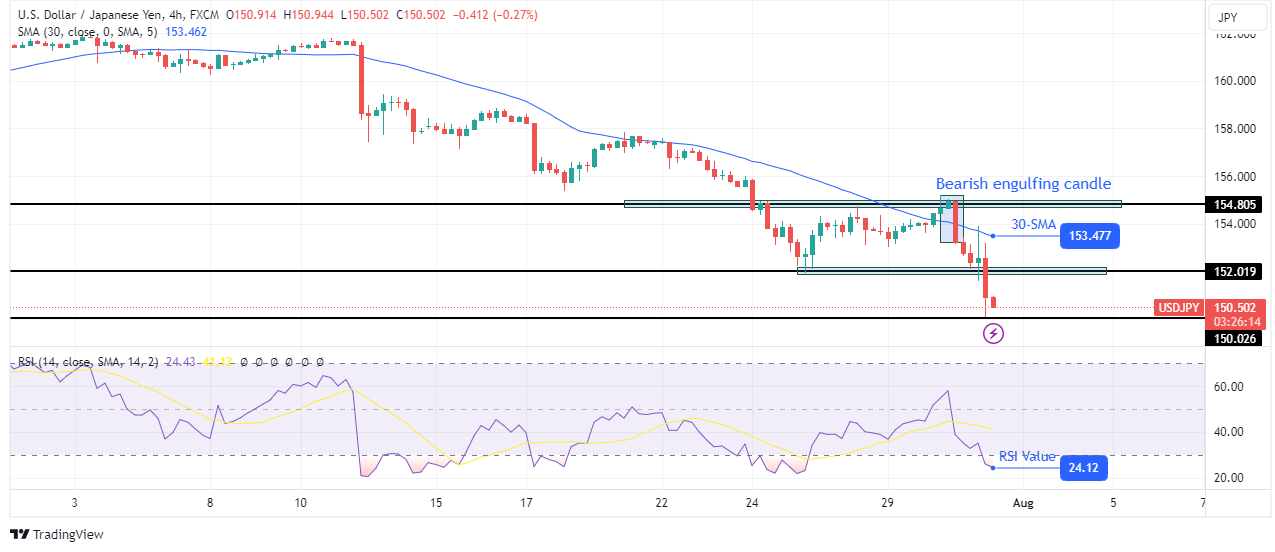
On the technical side, the USD/JPY price has suddenly shifted from bullish to bearish. Initially, bulls took charge by breaking above the 30-SMA. However, they failed to breach the 154.80 key level. Here, the price made a bearish engulfing candle, indicating a looming reversal.
–Are you interested in learning more about XRP price prediction? Check our detailed guide-
The price fell back below the 30-SMA, and the RSI entered the oversold region. After the reversal pattern, bears took over and broke below the 152.01 support level. As a result, the price has made a lower low. If this bearish trend continues, the price will soon take out the 150.02 level.
Looking to trade forex now? Invest at eToro!
68% of retail investor accounts lose money when trading CFDs with this provider. You should consider whether you can afford to take the high risk of losing your money.
On Friday, August 16, US consumer confidence will spotlight the US economy. Economists expect the Michigan Consumer Sentiment Index to increase from 66.4 in July to 66.7 in August.
A larger-than-expected increase could also support bets on the US avoiding a recession. Rising consumer confidence could boost spending and the US economy. However, investors should also consider subcomponents, including inflation expectations.
Consumers could delay purchases if they think inflation will soften in the near term, impacting consumer spending and the US economy. The Fed could signal a more dovish Fed rate path, lowering borrowing costs and increasing disposable income. Higher disposable income trends could boost spending.
FOMC member Michelle Bowman commented on inflation, the labor market, and the Fed rate path, stating,
“I am not confident that inflation will decline in the same way as in the second half of last year. Should the incoming data continue to show that inflation is moving sustainably toward our 2% goal, it will become appropriate to gradually lower the federal funds rate to prevent monetary policy from becoming overly restrictive on economic activity and employment.”
While leaving the door open to a Fed rate cut, Bowman also said,
“But we need to be patient and avoid undermining continued progress on lowering inflation by overreacting to any single data point.”
Softer US inflation and labor market data could bolster the case for multiple 2024 Fed rate cuts. A more dovish Fed rate path may also influence interest rate differentials and support a USD/JPY drop toward 140.
Near-term USD/JPY trends hinge on inflation numbers from Japan and the US, and US labor market data. Softer US inflation and labor market data could fuel bets on multiple 2024 Fed rate cuts and push the USD/JPY below 145. Moreover, higher producer prices and private consumption numbers from Japan could raise bets on a Q4 2024 BoJ rate hike and signal a USD/JPY drop toward 140.
Investors should remain alert in another crucial week for the USD/JPY pairing. Monitor real-time data, central bank views, and expert commentary to adjust your trading strategies accordingly. Stay informed with our latest analysis and news to navigate the FX markets.
The USD/JPY remained well below the 50-day and 200-day EMAs, confirming the bearish price trends.
A USD/JPY break above the 148.529 resistance level and trend line could give the bulls a run at 150. Furthermore, a return to 150 could signal a move toward the 151.684 resistance level and the 200-day EMA. Selling pressure could intensify at the 151.685 resistance level. The 200-day EMA is confluent with the resistance level.
Economic data from Japan and the US and central bank chatter require consideration.
Conversely, a drop below the 145.891 support level could bring the 143.495 support level into play. A fall through the 143.495 support level could signal a drop toward the 141.032 support level.
The 14-day RSI at 28.51 shows the USD/JPY in oversold territory. Buying pressure may increase at the 145.891 support level.
Gold price (XAU/USD) edges lower to $2,435 on Monday during the early Asian session. However, the downside might be capped due to rising expectations of rate cuts by the US Federal Reserve (Fed) and the risk-off mood amid ongoing geopolitical tensions in the Middle East.
The disappointing US July employment data raised fears of a recession and triggered the possibility of Fed rate cuts in September. “The marketplace just now is factoring in a better-than-70% chance for a 50-basis-point cut by the Fed at the September FOMC meeting,” said Jim Wyckoff, senior market analyst at Kitco Metals.
The US Bureau of Labor Statistics (BLS) showed on Friday that US Nonfarm Payrolls (NFP) rose by 114K in July from the previous month of 179K (revised down from 206K), weaker than the expectation of 175K. Meanwhile, the US Unemployment Rate rose to the highest level since November 2021, coming in at 4.3% in July from 4.1% in June.
Investors will take more cues from the US ISM Services Purchasing Managers Index (PMI) on Monday, which is expected to improve to 51.0 in July from 48.8 in June, In the case of the stronger-than-expected data, this might lift the US Dollar (USD) and cap the upside for USD-denominated Gold.
On the other hand, the escalating geopolitical tensions in the Middle East might boost the safe-haven flows, benefiting the yellow metal. The BBC reported that several nations have urged their citizens to leave Lebanon as worries mount about a wider Middle Eastern war. Additionally, the US general in charge of American troops in the Middle East arrived on Saturday as preparations continued for a potential strike against Israel by Iran in retaliation for the killing of senior Hamas and Hezbollah leaders, according to two US sources.
Gold has played a key role in human’s history as it has been widely used as a store of value and medium of exchange. Currently, apart from its shine and usage for jewelry, the precious metal is widely seen as a safe-haven asset, meaning that it is considered a good investment during turbulent times. Gold is also widely seen as a hedge against inflation and against depreciating currencies as it doesn’t rely on any specific issuer or government.
Central banks are the biggest Gold holders. In their aim to support their currencies in turbulent times, central banks tend to diversify their reserves and buy Gold to improve the perceived strength of the economy and the currency. High Gold reserves can be a source of trust for a country’s solvency. Central banks added 1,136 tonnes of Gold worth around $70 billion to their reserves in 2022, according to data from the World Gold Council. This is the highest yearly purchase since records began. Central banks from emerging economies such as China, India and Turkey are quickly increasing their Gold reserves.
Gold has an inverse correlation with the US Dollar and US Treasuries, which are both major reserve and safe-haven assets. When the Dollar depreciates, Gold tends to rise, enabling investors and central banks to diversify their assets in turbulent times. Gold is also inversely correlated with risk assets. A rally in the stock market tends to weaken Gold price, while sell-offs in riskier markets tend to favor the precious metal.
The price can move due to a wide range of factors. Geopolitical instability or fears of a deep recession can quickly make Gold price escalate due to its safe-haven status. As a yield-less asset, Gold tends to rise with lower interest rates, while higher cost of money usually weighs down on the yellow metal. Still, most moves depend on how the US Dollar (USD) behaves as the asset is priced in dollars (XAU/USD). A strong Dollar tends to keep the price of Gold controlled, whereas a weaker Dollar is likely to push Gold prices up.
The GBP/USD weekly forecast is slightly bearish despite the recent rally, as the Bank of England appears more confident about cutting rates further.
The pound had a bearish week but closed far above its lows. The pair started the week down as investors dumped risky assets amid fears of a US recession. Data in the previous week showed weaker-than-expected economic performance.
–Are you interested in learning more about STP brokers? Check our detailed guide-
However, this changed with the US services sector PMI data, which showed expansion. Meanwhile, jobless claims fell, indicating a still-tight labor market. Nevertheless, investors were already pricing a more significant 50 bps Fed rate cut in September.
Additionally, the pound fell as markets contemplated the Bank of England’s first rate cut.
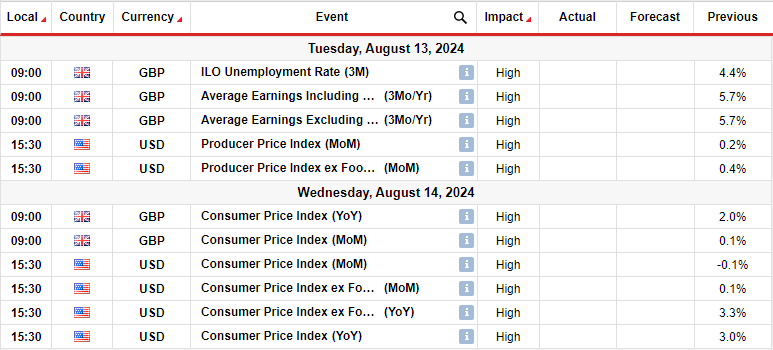

Next week, the pound might experience significant volatility due to US and UK inflation and retail sales data. Additionally, the UK will release data on employment, GDP, and manufacturing production. Markets will focus on the consumer inflation reports, shaping the outlook for monetary policy in the UK and the US.
The Fed is looking to start its rate-cutting cycle in September. Inflation in the US has been on a downtrend, and the economy is beginning to crack. Therefore, further easing inflation will give policymakers enough confidence to cut interest rates.
Meanwhile, the Bank of England recently implemented its first rate cut. However, most policymakers believe underlying inflation remains high. Still, they have gained enough confidence to start lowering borrowing costs.
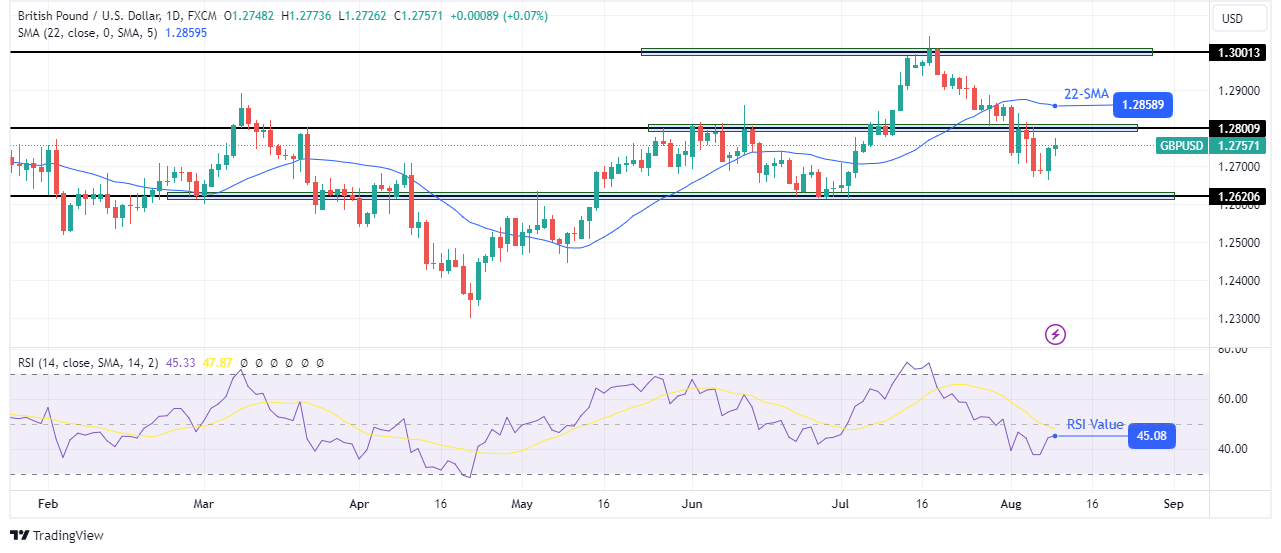
On the technical side, the GBP/USD price trades below the 22-SMA with the RSI below 50. Therefore, bears are in control. However, the price has made higher highs and lows on a larger scale, indicating a bullish trend.
–Are you interested in learning more about making money with forex? Check our detailed guide-
After puncturing the 1.2800 support, bears are now eyeing the 1.2620 level. Initially, GBP/USD reached a higher low at this level. Therefore, it is a strong barrier. However, if bears breach this level, the price will make a lower low, breaking the bullish trend pattern. In this case, GBP/USD would confirm a new bearish trend. On the other hand, if the level holds firm as support, bulls might resurface to make a new high.
Looking to trade forex now? Invest at eToro!
67% of retail investor accounts lose money when trading CFDs with this provider. You should consider whether you can afford to take the high risk of losing your money.
The U.S. dollar initially did try to rally a bit against the Japanese yen during the trading session on Friday, as it looks like we are going to continue to see a lot of back and forth behavior. Ultimately, I think this is a scenario where you look at this through the prism of trying to see whether or not we can break above the 148.50 yen level, which could kick off a deeper move to the upside. That being said, we are currently struggling with the overall a longer term uptrend. And if we can’t get above there, that shows a massive risk of this type of situation.
With that being said, the market is likely to remain somewhat range bound in this area. But if we were to break down below the swing low on Monday, that would be horrific sign for the dollar. And it would show that the Japanese yen should continue to strengthen. A lot of this comes down to deleveraging and the risk of trading. And at this point, we have seen a little bit of a bounce, but really not a lot to get excited about. So, I’m definitely watching this pair, as it can gives us a sign of where risk appetite is going. Ultimately, this is a market that I think will continue to be closely watched by traders in all markets, not just this one.
For a look at all of today’s economic events, check out our economic calendar.
This article was originally posted on FX Empire
A break higher at this point in time opens up the possibility of a move to the 50-day EMA, which is a major indicator that a lot of people pay close attention to. Furthermore, there’s also a gap on the chart in this area, and therefore it’s likely that we will continue to see every dip continue to attract significant attraction.
If we were to turn around and break down below the $71.50 level, then the market could drop down to the $67.50 level, which is also massive support. I think at this point in time, we are very cautious with our optimism in the short term, but I do think it looks like we are trying to squeeze to the upside. Keep in mind, there are a lot of geopolitical factors out there that continue to favor the idea of oil being something that is going to be bullish because of territorial disputes and conflicts.
You also have this time of year, which is typically bullish anyway. So as long as that’s going to be the case, I find it very difficult to short oil anytime soon. That being said, I also recognize that the area right around the $83.50 level is significant resistance, so I don’t think we get above there either. Essentially, we are in some type of summertime range that is squeezing tighter and tighter and will eventually have to be resolved.
Ready to trade the Crude Oil forecast? Here’s a list of some of the best Oil trading platforms to check out.
Silver price (XAG/USD) holds onto gains above the crucial support of $27.00 in Friday’s New York session. The white metal clings to gains as a move towards policy-normalization from the Federal Reserve (Fed) seems certain in September. However, investors divide over the size of interest-rate cuts.
According to the CME FedWatch tool, 30-day Federal Funds Futures pricing data shows that traders see a 56.5% chance that interest rates will be reduced by 50 basis points (bps) in September. The likelihood of 50 bps rate cuts has dropped in a week as fears of global slowdown have diminished after lower-than-expected United States (US) Initial Jobless Claims and hot China’s Consumer Price Index (CPI) data for July.
The US Dollar (USD) exhibits a subdued performance as Fed rate cuts in September seems certain. The US Dollar Index (DXY), which tracks the Greenback’s value against six major currencies, corrects to near 103.15 from four-day high of 103.50. 10-year US Treasury yields slump to near 3.93%.
Historically, lower yields on interest-bearing assets bodes well for the Silver price. But in this case the Silver price is slightly down as investors worry about its global demand as a metal, with application in various industries.
Silver price declines toward the horizontal support plotted from 4 December 2023 high of $25.90 on a daily timeframe. The asset hovers near the 200-day Exponential Moving Average (EMA) around $26.90, suggesting that the overall trend is uncertain.
The 14-day Relative Strength Index (RSI) attempts to return inside the 40.00-60.00 range. A bearish momentum would conclude if the RSI (14) manages to do so.
Silver is a precious metal highly traded among investors. It has been historically used as a store of value and a medium of exchange. Although less popular than Gold, traders may turn to Silver to diversify their investment portfolio, for its intrinsic value or as a potential hedge during high-inflation periods. Investors can buy physical Silver, in coins or in bars, or trade it through vehicles such as Exchange Traded Funds, which track its price on international markets.
Silver prices can move due to a wide range of factors. Geopolitical instability or fears of a deep recession can make Silver price escalate due to its safe-haven status, although to a lesser extent than Gold’s. As a yieldless asset, Silver tends to rise with lower interest rates. Its moves also depend on how the US Dollar (USD) behaves as the asset is priced in dollars (XAG/USD). A strong Dollar tends to keep the price of Silver at bay, whereas a weaker Dollar is likely to propel prices up. Other factors such as investment demand, mining supply – Silver is much more abundant than Gold – and recycling rates can also affect prices.
Silver is widely used in industry, particularly in sectors such as electronics or solar energy, as it has one of the highest electric conductivity of all metals – more than Copper and Gold. A surge in demand can increase prices, while a decline tends to lower them. Dynamics in the US, Chinese and Indian economies can also contribute to price swings: for the US and particularly China, their big industrial sectors use Silver in various processes; in India, consumers’ demand for the precious metal for jewellery also plays a key role in setting prices.
Silver prices tend to follow Gold’s moves. When Gold prices rise, Silver typically follows suit, as their status as safe-haven assets is similar. The Gold/Silver ratio, which shows the number of ounces of Silver needed to equal the value of one ounce of Gold, may help to determine the relative valuation between both metals. Some investors may consider a high ratio as an indicator that Silver is undervalued, or Gold is overvalued. On the contrary, a low ratio might suggest that Gold is undervalued relative to Silver.