The main category of Forex News.
You can use the search box below to find what you need.
[wd_asp id=1]
The main category of Forex News.
You can use the search box below to find what you need.
[wd_asp id=1]
A decisive bullish breakout triggered on Wednesday as natural gas broke out of a bullish descending wedge pattern. Following the breakout upward momentum stayed strong. Each of the past three days closed in the top quarter of the day’s trading range. The 2.15 daily swing high is also a weekly high from last week. This means a weekly bullish signal was also triggered this week. So, a daily close above 2.15 will also confirm the weekly reversal. It follows seven weeks down from the most recent swing high at 3.16.
There could be a pullback before natural gas progresses higher and, in that case, the first price level to watch is the 20-Day MA at 2.09. It was successfully tested as support with today’s low of 2.10. Lower down is the 50% retracement level at 2.04, followed by a price zone around the 2.03 to 2.01 daily lows from Thursday and Wednesday, respectively. That would also be roughly around the top boundary line of the wedge pattern.
The degree of retracement, if it comes before a bullish continuation, may tell us something about the underlying strength in demand for natural gas. Of course, finding support at or above the 20-Day line and then continuing higher would be the more bullish behavior. Nevertheless, the weekly reversal was just triggered, and it indicates there will likely be a continuation to the rally. What is not clear is the aggressiveness of the rally. A prolonged retracement or consolidation prior to a bullish continuation is possible. But, given the clear bullish breakout this week it is also possible that the bulls maintain control into higher price levels.
For a look at all of today’s economic events, check out our economic calendar.
The Pound Sterling continued to register gains on Friday yet found some resistance at 1.2773, shy of hitting the 50-day moving average (DMA) at 1.2785, which, if cleared, could pave the way for further upside. However, the GBP/USD retreats somewhat and registers modest gains of 0.11%, trading at 1.2760.
After seesawing through most of the week, the GBP/USD pair has been range-bound, capped within the 1.2680-1.2785 range for the last four days, with key daily moving averages (DMAs) acting as support/resistance.
Momentum is also mixed, with the Relative Strength Index (RSI) standing bearish yet aiming slightly up.
Hence if GBP/USD clears the top of the range, that could pave the way for higher prices. The first resistance would be the 1.2800 figure. Despite that, buyers need to reclaim the July 29 peak at 1.2888, before challenging the 1.2900 figure.
Conversely, if sellers stepped in, they would test the 200-DMA at 1.2657. Once cleared, the pair would shift bearish, and it can challenge the 1.2600 mark. Underneath this level, bears could drag the spot price to test the latest cycle low of 1.2445, the May 9 low.
The table below shows the percentage change of British Pound (GBP) against listed major currencies today. British Pound was the strongest against the Australian Dollar.
| USD | EUR | GBP | JPY | CAD | AUD | NZD | CHF | |
|---|---|---|---|---|---|---|---|---|
| USD | -0.01% | -0.07% | -0.47% | -0.04% | 0.32% | 0.13% | -0.30% | |
| EUR | 0.00% | -0.04% | -0.40% | -0.03% | 0.33% | 0.14% | -0.29% | |
| GBP | 0.07% | 0.04% | -0.37% | -0.01% | 0.37% | 0.17% | -0.22% | |
| JPY | 0.47% | 0.40% | 0.37% | 0.37% | 0.76% | 0.55% | 0.16% | |
| CAD | 0.04% | 0.03% | 0.00% | -0.37% | 0.35% | 0.17% | -0.23% | |
| AUD | -0.32% | -0.33% | -0.37% | -0.76% | -0.35% | -0.19% | -0.59% | |
| NZD | -0.13% | -0.14% | -0.17% | -0.55% | -0.17% | 0.19% | -0.40% | |
| CHF | 0.30% | 0.29% | 0.22% | -0.16% | 0.23% | 0.59% | 0.40% |
The heat map shows percentage changes of major currencies against each other. The base currency is picked from the left column, while the quote currency is picked from the top row. For example, if you pick the British Pound from the left column and move along the horizontal line to the US Dollar, the percentage change displayed in the box will represent GBP (base)/USD (quote).
Silver (XAG/USD) struggles to capitalize on the previous day’s goodish rebound from the $26.45 area, or the lowest level since early May and seesaws between tepid gains/minor losses through the early European session on Friday. The white metal now seems to have stabilized around the $27.50-$27.55 region and remains below the 23.6% Fibonacci retracement level of the July-August downfall.
The said barrier is pegged near the $27.75 region, which if cleared might trigger a short-covering rally and lift the XAG/USD to the $28.00 mark. The recovery momentum could extend further towards the 38.2% Fibo. level around the $28.50-$28.55 region, though is more likely to remain capped near the 100-day Simple Moving Average (SMA) breakpoint, near the $28.75-$28.80 area. However, some follow-through buying, leading to a subsequent strength beyond the $29.00 mark, might negate any near-term negative bias and pave the way for additional gains.
The XAG/USD might then climb to the $29.45 intermediate hurdle en route to the 61.8% Fibo. level, around the $29.75 region and eventually aim to reclaim the $30.00 psychological mark. That said, technical indicators on the daily chart – though have recovered from lower levels – are still holding deep in negative territory. This, in turn, warrants some caution for bullish traders and positioning for a further intraday appreciating move.
Meanwhile, any meaningful slide now seems to find some support near the $27.30-$27.25 area ahead of the $27.00 mark. A convincing break below has the potential to drag the XAG/USD back towards the $26.50-$26.45 area, or a multi-month low set on Wednesday. The latter should act as a key pivotal point, which if broken will be seen as a fresh trigger for bearish traders and make the white metal vulnerable to test the May monthly swing low, around the $26.00 mark. The commodity could drop further to the $25.60 horizontal support and the $25.00 psychological mark.
Silver is a precious metal highly traded among investors. It has been historically used as a store of value and a medium of exchange. Although less popular than Gold, traders may turn to Silver to diversify their investment portfolio, for its intrinsic value or as a potential hedge during high-inflation periods. Investors can buy physical Silver, in coins or in bars, or trade it through vehicles such as Exchange Traded Funds, which track its price on international markets.
Silver prices can move due to a wide range of factors. Geopolitical instability or fears of a deep recession can make Silver price escalate due to its safe-haven status, although to a lesser extent than Gold’s. As a yieldless asset, Silver tends to rise with lower interest rates. Its moves also depend on how the US Dollar (USD) behaves as the asset is priced in dollars (XAG/USD). A strong Dollar tends to keep the price of Silver at bay, whereas a weaker Dollar is likely to propel prices up. Other factors such as investment demand, mining supply – Silver is much more abundant than Gold – and recycling rates can also affect prices.
Silver is widely used in industry, particularly in sectors such as electronics or solar energy, as it has one of the highest electric conductivity of all metals – more than Copper and Gold. A surge in demand can increase prices, while a decline tends to lower them. Dynamics in the US, Chinese and Indian economies can also contribute to price swings: for the US and particularly China, their big industrial sectors use Silver in various processes; in India, consumers’ demand for the precious metal for jewellery also plays a key role in setting prices.
Silver prices tend to follow Gold’s moves. When Gold prices rise, Silver typically follows suit, as their status as safe-haven assets is similar. The Gold/Silver ratio, which shows the number of ounces of Silver needed to equal the value of one ounce of Gold, may help to determine the relative valuation between both metals. Some investors may consider a high ratio as an indicator that Silver is undervalued, or Gold is overvalued. On the contrary, a low ratio might suggest that Gold is undervalued relative to Silver.
EUR/USD closed the second consecutive day virtually unchanged on Thursday. The pair continues to fluctuate in a tight channel above 1.0900 early Friday as investors await the next catalyst.
The table below shows the percentage change of Euro (EUR) against listed major currencies this week. Euro was the strongest against the Swiss Franc.
| USD | EUR | GBP | JPY | CAD | AUD | NZD | CHF | |
|---|---|---|---|---|---|---|---|---|
| USD | -0.07% | 0.31% | 0.44% | -0.98% | -1.25% | -1.14% | 0.85% | |
| EUR | 0.07% | 0.31% | 0.35% | -1.03% | -1.17% | -1.18% | 0.81% | |
| GBP | -0.31% | -0.31% | 0.11% | -1.31% | -1.47% | -1.48% | 0.51% | |
| JPY | -0.44% | -0.35% | -0.11% | -1.37% | -1.72% | -1.55% | 0.44% | |
| CAD | 0.98% | 1.03% | 1.31% | 1.37% | -0.24% | -0.16% | 1.66% | |
| AUD | 1.25% | 1.17% | 1.47% | 1.72% | 0.24% | -0.01% | 2.00% | |
| NZD | 1.14% | 1.18% | 1.48% | 1.55% | 0.16% | 0.00% | 2.01% | |
| CHF | -0.85% | -0.81% | -0.51% | -0.44% | -1.66% | -2.00% | -2.01% |
The heat map shows percentage changes of major currencies against each other. The base currency is picked from the left column, while the quote currency is picked from the top row. For example, if you pick the Euro from the left column and move along the horizontal line to the US Dollar, the percentage change displayed in the box will represent EUR (base)/USD (quote).
EUR/USD edged lower in the early American session on Thursday after the data from the US showed that the weekly Initial Jobless Claims declined to 233,000 from 250,000. Later in the day, the US Dollar (USD) lost its strength as risk flows started to dominate the action in financial markets, allowing the pair to erase its daily losses.
The economic calendar will not offer any high-tier data releases that could influence EUR/USD’s action ahead of the weekend.
Hence, investors are likely to react to changes in risk perception. At the time of press, the Euro Stoxx 50 Index was up 0.25% on the day and US stock index futures were trading marginally higher.
In case market participants start moving away from risk-sensitive assets to avoid getting caught on the back foot over the weekend, the USD could stay resilient against its rivals and make it difficult for EUR/USD to stretch higher. On the other hand, a bullish opening in Wall Street and a continuation of the risk rally could help the pair hold its ground heading into the weekend.
The Relative Strength Index (RSI) indicator on the 4-hour chart moves sideways slightly above 50, reflecting a lack of directional momentum. On the downside, first support is located at 1.0900 (psychological level, static level) ahead of 1.0870, where the 100-period and the 50-period Simple Moving Averages (SMA) meet the 20-day SMA, and 1.0840 (200-period SMA).
In case the pair breaks above 1.0940 (static level), technical buyers could show interest. In this scenario, 1.0960 (static level) could be seen as interim resistance before 1.1000 (psychological level, static level).
The Euro is the currency for the 20 European Union countries that belong to the Eurozone. It is the second most heavily traded currency in the world behind the US Dollar. In 2022, it accounted for 31% of all foreign exchange transactions, with an average daily turnover of over $2.2 trillion a day. EUR/USD is the most heavily traded currency pair in the world, accounting for an estimated 30% off all transactions, followed by EUR/JPY (4%), EUR/GBP (3%) and EUR/AUD (2%).
The European Central Bank (ECB) in Frankfurt, Germany, is the reserve bank for the Eurozone. The ECB sets interest rates and manages monetary policy. The ECB’s primary mandate is to maintain price stability, which means either controlling inflation or stimulating growth. Its primary tool is the raising or lowering of interest rates. Relatively high interest rates – or the expectation of higher rates – will usually benefit the Euro and vice versa. The ECB Governing Council makes monetary policy decisions at meetings held eight times a year. Decisions are made by heads of the Eurozone national banks and six permanent members, including the President of the ECB, Christine Lagarde.
Eurozone inflation data, measured by the Harmonized Index of Consumer Prices (HICP), is an important econometric for the Euro. If inflation rises more than expected, especially if above the ECB’s 2% target, it obliges the ECB to raise interest rates to bring it back under control. Relatively high interest rates compared to its counterparts will usually benefit the Euro, as it makes the region more attractive as a place for global investors to park their money.
Data releases gauge the health of the economy and can impact on the Euro. Indicators such as GDP, Manufacturing and Services PMIs, employment, and consumer sentiment surveys can all influence the direction of the single currency. A strong economy is good for the Euro. Not only does it attract more foreign investment but it may encourage the ECB to put up interest rates, which will directly strengthen the Euro. Otherwise, if economic data is weak, the Euro is likely to fall. Economic data for the four largest economies in the euro area (Germany, France, Italy and Spain) are especially significant, as they account for 75% of the Eurozone’s economy.
Another significant data release for the Euro is the Trade Balance. This indicator measures the difference between what a country earns from its exports and what it spends on imports over a given period. If a country produces highly sought after exports then its currency will gain in value purely from the extra demand created from foreign buyers seeking to purchase these goods. Therefore, a positive net Trade Balance strengthens a currency and vice versa for a negative balance.
On the stock trading platforms front, German stocks rose. Germany’s DAX rose 0.8% to 17,485 points on Wednesday, tracking gains in its European peers as traders try to shake off concerns about the global economy and as Bank of Japan Deputy Governor Uchida offers investors some confidence by saying the central bank will not raise interest rates when financial markets are unstable. Meanwhile, earnings season continues with Continental up about 5% after the company delivered better-than-expected results despite cutting its full-year sales guidance due to lower car production.
On the other hand, Siemens Energy shares fell about 0.5% despite reporting a smaller net profit loss in the second quarter. Commerzbank lost about 4.6% after reporting a drop in profits and Puma fell more than 12% after reporting a drop in sales and narrowing its full-year operating profit forecast.
In the same context, French stocks break a 4-day losing streak. The CAC 40 index rose 0.8% to 7,189 points on Wednesday, snapping a four-session losing streak, supported by improved investor sentiment as concerns over the global economy eased. Also, sentiment was boosted by Bank of Japan Deputy Governor Uchida’s assurance that the central bank would not raise interest rates amid market volatility. The banking sector was among the best performers, with BNP Paribas, Societe Generale and Credit Agricole adding between 2.2% and 2.3%. Other notable gainers included Carrefour, Saint-Gobain, Schneider Electric, Renault and Legrand, which rose between 1.6% and 2.7%.
On the domestic front, France’s trade deficit narrowed to €6.1 billion in June 2024 from €7.7 billion the previous month and better than expected €7.5 billion. This was the smallest trade deficit in three months, with exports up 3.4% month-on-month to €51.7 billion, while imports fell 0.2% to €57.8 billion.
According to the economic calendar, German import growth below expectations. Imports to Germany rose 0.3% month-on-month to €107.3 billion in June 2024, after a 5.5% decline in the previous period. The latest reading was below expectations of 2.8% growth, as purchases from outside the EU fell by 0.4%, mainly from China (-4.9%), the US (-6.5%) and Russia (-1.5%), while those from the UK (-11.1%) increased. Imports from the EU, meanwhile, grew by 1.0%, supported by purchases from non-EU regions (3.7%). Looking at the January-July 2014 period, purchases contracted by 6.0% compared to the same period last year to €658.9 billion.
Also, exports from Germany fell by 3.4% month-on-month to a six-month low of €127.7 billion in June 2024, worse than market expectations of a 1.5% decline, following a 3.1% decline in the previous month, the sharpest decline since last December. According to the announcement, shipments to the European Union fell by 3.4%, driven by exports from the eurozone (-3.2%) and the non-eurozone area (-3.7%). Exports to third countries also declined by 3.5%, with exports to the United States contracting by 7.7%, while exports to Britain and Russia fell by 0.6% and 3.2%, respectively.
In contrast, exports to China rose by 3.4%. During the first seven months of 2024, exports decreased by 1.1% compared to the same period last year to 798.8 billion euros.

The neutrality of the EUR/USD price performance continues, and the bullish bias will be stronger if it returns to stability above the psychological resistance of 1.1000 again. On the other hand, according to the performance on the daily chart, returning to the support area of 1.0820 will be important for the bears to control the trend again. Therefore, we still prefer to sell the EUR/USD from every upward level.
Ready to trade our daily Forex analysis? We’ve made a list of the best forex demo accounts worth trading with.
After falling to its weakest level since early July below 1.2700 on Thursday, GBP/USD gained traction and closed the day in positive territory. The pair preserves its recovery momentum and continues to stretch higher toward 1.2800 in the European session on Friday.
The table below shows the percentage change of British Pound (GBP) against listed major currencies today. British Pound was the strongest against the Australian Dollar.
| USD | EUR | GBP | JPY | CAD | AUD | NZD | CHF | |
|---|---|---|---|---|---|---|---|---|
| USD | -0.03% | -0.15% | -0.07% | 0.02% | 0.07% | -0.12% | -0.15% | |
| EUR | 0.03% | -0.09% | 0.03% | 0.07% | 0.11% | -0.09% | -0.11% | |
| GBP | 0.15% | 0.09% | 0.11% | 0.14% | 0.21% | 0.00% | 0.00% | |
| JPY | 0.07% | -0.03% | -0.11% | 0.04% | 0.11% | -0.10% | -0.08% | |
| CAD | -0.02% | -0.07% | -0.14% | -0.04% | 0.04% | -0.15% | -0.14% | |
| AUD | -0.07% | -0.11% | -0.21% | -0.11% | -0.04% | -0.20% | -0.20% | |
| NZD | 0.12% | 0.09% | 0.00% | 0.10% | 0.15% | 0.20% | 0.00% | |
| CHF | 0.15% | 0.11% | -0.01% | 0.08% | 0.14% | 0.20% | -0.00% |
The heat map shows percentage changes of major currencies against each other. The base currency is picked from the left column, while the quote currency is picked from the top row. For example, if you pick the British Pound from the left column and move along the horizontal line to the US Dollar, the percentage change displayed in the box will represent GBP (base)/USD (quote).
The US Department of Labor reported on Thursday that the number of first-time applications for unemployment benefits dropped to 233,000 in the week ending August 3 from 250,000 in the previous week. The immediate market reaction to this data helped the US Dollar (USD) gather strength and dragged GBP/USD lower.
Later in the session, the USD lost its footing as risk flows started to dominate the action in financial markets. Reflecting the upbeat mood, Wall Street’s main indexes registered impressive gains, with the Nasdaq Composite leading the rally with a 3% upsurge.
At the time of press, US stock index futures were up between 0.2% and 0.6% on the day. In case the mood remains upbeat in the American session on Friday, the USD could struggle to find demand and allow GBP/USD to extend its recovery.
On the other hand, investors could look to move to the sidelines in case they see a possibility of geopolitical tensions escalating again over the weekend. In this scenario, week-end flows could cause GBP/USD to lose its traction.
GBP/USD broke above the descending trend line and the Relative Strength Index (RSI) indicator on the 4-hour chart rose toward 60, reflecting a bullish tilt in the short term outlook.
On the upside, 1.2780 (Fibonacci 61.8% retracement of the latest uptrend) aligns as first resistance before 1.2810 (200-period Simple Moving Average (SMA)) and 1.2830-1.2835 (Fibonacci 50% retracement, 100-period SMA).
Supports could be seen at 1.2710 (Fibonacci 61.8% retracement), 1.2670 (static level) and 1.2620 (static level, beginning point of the latest uptrend).
The Pound Sterling (GBP) is the oldest currency in the world (886 AD) and the official currency of the United Kingdom. It is the fourth most traded unit for foreign exchange (FX) in the world, accounting for 12% of all transactions, averaging $630 billion a day, according to 2022 data. Its key trading pairs are GBP/USD, aka ‘Cable’, which accounts for 11% of FX, GBP/JPY, or the ‘Dragon’ as it is known by traders (3%), and EUR/GBP (2%). The Pound Sterling is issued by the Bank of England (BoE).
The single most important factor influencing the value of the Pound Sterling is monetary policy decided by the Bank of England. The BoE bases its decisions on whether it has achieved its primary goal of “price stability” – a steady inflation rate of around 2%. Its primary tool for achieving this is the adjustment of interest rates. When inflation is too high, the BoE will try to rein it in by raising interest rates, making it more expensive for people and businesses to access credit. This is generally positive for GBP, as higher interest rates make the UK a more attractive place for global investors to park their money. When inflation falls too low it is a sign economic growth is slowing. In this scenario, the BoE will consider lowering interest rates to cheapen credit so businesses will borrow more to invest in growth-generating projects.
Data releases gauge the health of the economy and can impact the value of the Pound Sterling. Indicators such as GDP, Manufacturing and Services PMIs, and employment can all influence the direction of the GBP. A strong economy is good for Sterling. Not only does it attract more foreign investment but it may encourage the BoE to put up interest rates, which will directly strengthen GBP. Otherwise, if economic data is weak, the Pound Sterling is likely to fall.
Another significant data release for the Pound Sterling is the Trade Balance. This indicator measures the difference between what a country earns from its exports and what it spends on imports over a given period. If a country produces highly sought-after exports, its currency will benefit purely from the extra demand created from foreign buyers seeking to purchase these goods. Therefore, a positive net Trade Balance strengthens a currency and vice versa for a negative balance.
Gold price is consolidating at the weekly high near $2,410, gathering pace to extend the previous rebound. Gold price remains on track to settle the week in the green, staging a sold recovery from the recent correction from two-week highs.
Markets saw an impressive upswing in Gold price on Thursday even as the US Dollar (USD) rebounded firmly in tandem with the Wall Street indices, following the release of the surprisingly strong US weekly Jobless Claims data.
Initial claims for state unemployment benefits fell 17,000 to a seasonally adjusted 233,000 for the week ended August 3, the Labor Department said on Thursday, August 8, the largest drop in about 11 months, suggesting the gradual softening in the labor market remains intact while calming markets nerves over a potential US recession.
The uptick in the Gold price could be attributed to restoring investors’ faith across the financial markets after Monday’s turmoil prompted traders to lock in gains in their Gold longs to cover losses elsewhere.
Meanwhile, conciliatory comments from Richmond Fed President Thomas Barkin and Chicago Fed President Austan Goolsbee also added to the market optimism. However, dovish remarks from Kansas City Fed Chief Jeffrey Schmid spoilt the US Dollar’s party, as the US Treasury bond yields pulled back sharply from the weekly top.
Further, the risk-on market environment also dulled the Greenback’s appeal as a safe-haven asset, helping Gold price settle at the highest level seen so far this week at $2,428.
Additionally, Gold price witnessed chart-based buying after buyers managed to defend a critical support area on the daily timeframe.
In Friday’s trading so far, the buoyant tone in the Asian stock markets keeps the US Dollar on the back foot but Gold buyers seem to have turned cautious heading into the weekly close. The end-of-the-week flows will likely remain in play while traders could also reposition themselves before next week’s crucial US Consumer Price Index (CPI) data.
The absence of any top-tier US economic data on Friday, put the focus back on risk trends and Middle East geopolitical tensions, as Iran considers to pull back in exchange for progress on Gaza peace talks.
This comes after US President Joe Biden and the leaders of Egypt and Qatar said Thursday that they were prepared to present a “final” cease-fire proposal to end the war in Gaza and called on Israel and Hamas to return to the negotiating table next week to settle the conflict.
As observed on the daily chart, Gold price remains within a symmetrical triangle formation, having failed to seek a downside break after defending the key rising trendline support at $2,380.
The key leading indicator, the 14-day Relative Strength Index (RSI), has returned to positive territory, currently near 55.00, suggesting that upside risks remain in place for an extended Gold price rebound.
Adding credence to the bullish potential, Gold buyers recaptured the 21-day Simple Moving Average (SMA) support-turned-resistance at $2,415 on a daily closing basis.
The immediate upside barrier is seen at the August 5 high of $2,459, above which the falling trendline resistance at $2,470 and the two-week high of $2,478 will be challenged.
Conversely, should Gold sellers fight back control, the immediate support is aligned the 21-day SMA at $2,415.
If the downside sustains, the abovementioned rising trendline support at $2,380 will come into play once again.
Thereafter, the 50-day SMA at $2,371 could come to the immediate rescue of Gold buyers.
Gold has played a key role in human’s history as it has been widely used as a store of value and medium of exchange. Currently, apart from its shine and usage for jewelry, the precious metal is widely seen as a safe-haven asset, meaning that it is considered a good investment during turbulent times. Gold is also widely seen as a hedge against inflation and against depreciating currencies as it doesn’t rely on any specific issuer or government.
Central banks are the biggest Gold holders. In their aim to support their currencies in turbulent times, central banks tend to diversify their reserves and buy Gold to improve the perceived strength of the economy and the currency. High Gold reserves can be a source of trust for a country’s solvency. Central banks added 1,136 tonnes of Gold worth around $70 billion to their reserves in 2022, according to data from the World Gold Council. This is the highest yearly purchase since records began. Central banks from emerging economies such as China, India and Turkey are quickly increasing their Gold reserves.
Gold has an inverse correlation with the US Dollar and US Treasuries, which are both major reserve and safe-haven assets. When the Dollar depreciates, Gold tends to rise, enabling investors and central banks to diversify their assets in turbulent times. Gold is also inversely correlated with risk assets. A rally in the stock market tends to weaken Gold price, while sell-offs in riskier markets tend to favor the precious metal.
The price can move due to a wide range of factors. Geopolitical instability or fears of a deep recession can quickly make Gold price escalate due to its safe-haven status. As a yield-less asset, Gold tends to rise with lower interest rates, while higher cost of money usually weighs down on the yellow metal. Still, most moves depend on how the US Dollar (USD) behaves as the asset is priced in dollars (XAU/USD). A strong Dollar tends to keep the price of Gold controlled, whereas a weaker Dollar is likely to push Gold prices up.
The USD/JPY outlook leans bullish as the dollar recovers following upbeat US employment figures. Meanwhile, the yen extended declines as recent recession worries eased and risk appetite improved.
-Are you looking for automated trading? Check our detailed guide-
On Thursday, the US released unemployment claims figures showing a drop to 233,000, the most significant decline in nearly a year. Economists had expected 240,000 claims. The figures eased fears that the labor market was deteriorating rapidly. Last week, data showed a massive jump in the unemployment rate, sparking fears of a slowdown. This panic boosted the yen, considered a haven in times of uncertainty.
However, calm later returned as data showed other sectors of the US economy remained resilient. The dollar traded near a four-month low as Fed rate cut expectations surged. However, this decline paused as the market turmoil eased. Despite signs of weakness, the labor market remains resilient. Nevertheless, last week’s report was a catalyst for the Fed to start lowering borrowing costs to avoid a new downtrend in the sector.
Meanwhile, the yen has remained vulnerable since the Bank of Japan Deputy Governor dashed hopes for a near-term rate hike. He called for a pause because of recent volatility in the global markets. Meanwhile, BoJ minutes on Thursday showed a more hawkish tone, increasing the uncertainty on the central bank’s policy outlook.
It might be a slow end to the week as investors do not expect key reports from Japan or the US.
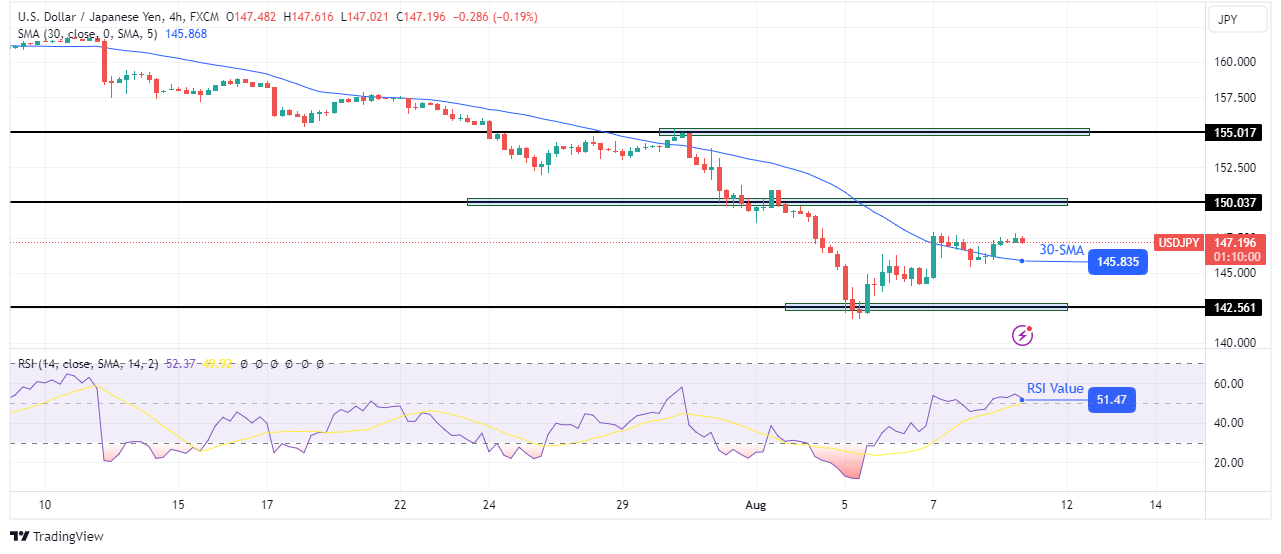
On the technical side, the USD/JPY price trades above the 30-SMA, and the RSI is above 50, indicating a bullish bias. This shift comes after the price reversed at the 142.56 level. Here, the price got deeply oversold, allowing bulls to resurface.
-If you are interested in forex day trading then have a read of our guide to getting started-
The new direction above the SMA will allow the price to revisit the 150.03 resistance level. If it breaks above, it will reach the 155.01 resistance. However, there is also a chance that this is only a deep pullback before the price reverses to the downside. Still, bears will only return if the price breaks below the 30-SMA. Otherwise, USD/JPY will start making higher highs and lows.
Looking to trade forex now? Invest at eToro!
67% of retail investor accounts lose money when trading CFDs with this provider. You should consider whether you can afford to take the high risk of losing your money.
Recently, the US jobs data last Friday increased fears that the US economy is sliding into recession. There are also concerns about increasing tensions in the Middle East. According to reliable trading platforms, the British pound against the euro (GBP/EUR) exchange rate recorded further sharp losses to an 11-week low of 1.1660 before recovering slightly to 1.1690 amid increased volatility. The pound was also somewhat affected by the Bank of England’s interest rate cut last week, although the decline in global risk conditions was the main factor. As is well known, the British currency is closely linked to risk trends. When stock markets are strong and there is strong interest in the carry trade, the pound performs well.
On the economic side, the Office for National Statistics data showed that the UK economy’s post-pandemic growth was stronger than previously expected. According to revised data from the Office for National Statistics (ONS), the UK economy emerged from the Covid-19 pandemic in a stronger state than previously thought. The new estimates put annual GDP growth for 2022 at 4.8%, up from the previous estimate of 4.3%.
The ONS update, released on Wednesday, also includes minor 0.1 percentage point revisions to GDP growth estimates for 2021 and 2020, with previous year figures remaining unchanged. Overall, these revisions reflect a more accurate representation of economic activity, taking into account the full range of administrative and survey data now available to the ONS.
The updated estimate for 2022, a year marked by rising inflation and market turmoil following Liz Truss’s “mini budget”, is partly due to stronger growth in the transport, professional, scientific, and technical services industries. The ONS’s full dataset provided a clearer picture of the contributions of these sectors to the economy. In addition, the revised figures consider the changing economic structure after the pandemic. The health sector, which saw its share of the economy increase during the pandemic, remained larger in 2022 as the National Health Service worked to address the backlog of care. Analogously, the share of the energy sector in economic activity grew due to rising global oil and gas prices following Russia’s invasion of Ukraine.
By contrast, the hospitality sector, which was severely impacted by Covid-19 lockdowns, remains smaller than it was before the pandemic. The manufacturing sector’s share of output has also fallen, impacted by higher energy prices. Also, the ONS has revised its assessment of the rail and air transport sectors during the pandemic. The rail industry, which received government subsidies to maintain operations, was found to be a bigger drag on growth in 2020 and 2021 than previously thought, as airlines largely ceased operations.
This year’s ONS revisions were less dramatic than those conducted in the previous two years. Last year, the agency’s revisions led to a significant reassessment of the UK’s economic performance during the pandemic, showing that the economy was more resilient and less of an international outlier than initially thought. Overall, the latest figures reinforce this revised view, suggesting that cumulative GDP growth from 2020 to 2022 was 2.1%, higher than the previous estimate of 1.9%. In September, the ONS will publish figures that will align GDP estimates for 2023 and 2024 with the updated and reweighted data, providing a clearer view of the ongoing economic recovery.
According to stock trading platforms, the FTSE 100 index of UK shares rose 1% on Wednesday, attempting to recover from a recent stock market slump, with most companies posting gains. Heavyweights such as HSBC Holdings and AstraZeneca saw gains of more than 1%, while Shell and BP rose 0.9% and 0.5% respectively, and Unilever rose 0.5%. Housebuilders also performed well, rising more than 1.3% after data revealed a significant rise in house prices in the country in July.
According to the performance on the daily chart, the bearish performance of the GBP/USD price will remain in place and the break of the 1.2600 support confirms the control of the bears and the readiness for stronger losses. Thus, moving the technical indicators towards strong oversold levels. Technically, the pound may remain under pressure from the Bank of England’s interest rate cut signals and if the risk-averse sentiment among investors continues as it has been recently. On the other hand, and over the same time frame, the break will be the first downtrend is moving towards the resistance 1.2885.
Ready to trade our Forex daily analysis and predictions? Here are the best forex trading platforms UK to choose from.
ARK Invest Founder, CEO, and CIO Cathie Wood recently commented on Treasury yields and the Fed Funds Rate, stating,
“The metal-to-gold ratio suggests that the 10-year Treasury bond yield should be around 2% today, not where it is at 3.8% or last October’s 5%. If the 10-year Treasury should yield ~2% today, should the Fed funds rate be closer to 1%?”
The Bank of Japan’s Summary of Opinions revealed the intention to return the policy interest rate to the neutral rate over time, projected at 1%. If interest rate differentials do matter, the outlook is particularly bearish for the USD/JPY.
On Friday, August 9, investors should track FOMC Member speakers. Insights on the US labor market, the economic outlook, and the interest rate trajectory may influence USD/JPY demand. Concerns about the US labor market and the economy, and calls for multiple rate cuts could push the USD/JPY below 145.
US initial jobless claims data from Thursday, August 8, eased immediate concerns about the US labor market. However, US continuing jobless claims continued to trend higher, affirming a softer labor market.
The unexpected rise in the US unemployment rate and continuing jobless claims trends supported multiple 2024 Fed rate cuts.
Rising expectations of a more dovish Fed rate path could signal a USD/JPY drop toward 140.
Arch Capital Global Chief Economist Parker Ross commented on the jobless claims report, stating,
“Recall that initial claims are flows into unemployment, while continuing claims are a reflection of how many people are unemployed. Flows (i.e. layoffs) have been relatively normal for most of 2024, but unemployed workers are taking longer to find a new job, which is reflected in the much higher level of continuing claims vs initial claims relative to recent non-COVID norms.”
Parker’s observations align with FOMC Member Thomas Barkin’s views on the US Labor Market. On Thursday, Barkin noted that firms were neither hiring nor firing, which could shift in either direction.
USD/JPY trends will hinge on central bank commentary. Support for multiple Fed rate cuts and pressure on the Bank of Japan to prepare for another rate hike could trigger another Yen carry trade unwind and a USD/JPY drop below 140.
Investors should remain alert. Monitor real-time data, central bank insights, and expert commentary to adjust your trading strategies accordingly. Stay updated with our latest news and analysis to manage USD/JPY volatility.
The USD/JPY remained below the 50-day and 200-day EMAs, affirming the bearish price signals.
A USD/JPY break above the 148.529 resistance level and the trend line would support a return to 150. Furthermore, a breakout from 150 could signal a move toward the 151.685 resistance level.
Central bank commentary needs consideration on Friday.
Conversely, a break below 147.500 could signal a fall toward the 145.891 support level. If the USD/JPY drops below the 145.891 support level, the bears could target the 143.495 support level.
The 14-day RSI at 32.39 suggests a USD/JPY drop below 147.500 before entering oversold territory.