The main category of Forex News.
You can use the search box below to find what you need.
[wd_asp id=1]
The main category of Forex News.
You can use the search box below to find what you need.
[wd_asp id=1]
Silver’s price extended its losses for the third straight day and stayed below $27.00 amid increasing geopolitical fears spurred by the Middle East conflict. Despite that, the grey metal failed to gain traction, capped by the rise of US Treasury yields and a strong US Dollar. The XAG/USD trades at $26.59, down 1.38%.
Silver’s struggle to remain above $27.00 could pave the way for a deeper pullback and test key support levels. Momentum favors sellers, as the Relative Strength Index (RSI) remains in bearish territory.
The XAG/USD first support would be the August 5 low of $26.51, followed by the 200-day moving average (DMA) at $26.06. Once those levels are surpassed, the next demand zone will be the March 27 pivot low at $24.33.
Conversely, if XAG/USD makes a U-turn and buyers reclaim $27.00, this can pave the way to test the August 6 peak at $27.56. Once hurdle, the next resistance would be the $28.00 mark ahead of the August 5 high at $28.67.
Silver is a precious metal highly traded among investors. It has been historically used as a store of value and a medium of exchange. Although less popular than Gold, traders may turn to Silver to diversify their investment portfolio, for its intrinsic value or as a potential hedge during high-inflation periods. Investors can buy physical Silver, in coins or in bars, or trade it through vehicles such as Exchange Traded Funds, which track its price on international markets.
Silver prices can move due to a wide range of factors. Geopolitical instability or fears of a deep recession can make Silver price escalate due to its safe-haven status, although to a lesser extent than Gold’s. As a yieldless asset, Silver tends to rise with lower interest rates. Its moves also depend on how the US Dollar (USD) behaves as the asset is priced in dollars (XAG/USD). A strong Dollar tends to keep the price of Silver at bay, whereas a weaker Dollar is likely to propel prices up. Other factors such as investment demand, mining supply – Silver is much more abundant than Gold – and recycling rates can also affect prices.
Silver is widely used in industry, particularly in sectors such as electronics or solar energy, as it has one of the highest electric conductivity of all metals – more than Copper and Gold. A surge in demand can increase prices, while a decline tends to lower them. Dynamics in the US, Chinese and Indian economies can also contribute to price swings: for the US and particularly China, their big industrial sectors use Silver in various processes; in India, consumers’ demand for the precious metal for jewellery also plays a key role in setting prices.
Silver prices tend to follow Gold’s moves. When Gold prices rise, Silver typically follows suit, as their status as safe-haven assets is similar. The Gold/Silver ratio, which shows the number of ounces of Silver needed to equal the value of one ounce of Gold, may help to determine the relative valuation between both metals. Some investors may consider a high ratio as an indicator that Silver is undervalued, or Gold is overvalued. On the contrary, a low ratio might suggest that Gold is undervalued relative to Silver.
Overnight, officials from the Bank of Japan suggested that they were not going to raise interest rates anytime soon as the markets had gotten far too volatile. That makes a certain amount of sense, considering that the Nikkei 225 at one point had lost 20% in just 3 trading sessions. Because of this, Japan has found itself in serious trouble, and as a result it makes sense that we would see the Bank of Japan turned back around. All things being equal, the market is likely to continue to see a lot of dangers moves in both directions, but at this point in time I think it’s going to be difficult to get into a huge position in any currency pair, let alone one that is as volatile as this one.

This has been all about the carry trade recently, and therefore it’s likely that the narrative starts to shift back toward whether or not the carry trade is going to continue. Quite frankly, this is a market that has been absolutely decimated, so a bounce does make a certain amount of sense, but whether or not it can actually hold its own remains to be seen. The ¥190 level above of course is an area that is a large, round, psychologically significant figure, and that is something that is worth paying attention to.
The size of the candlestick for the session on Wednesday certainly shows that there are a lot of people jumping into the market, so it’s possible that we could see a little bit of follow through, but I will be paying close attention to the ¥190 level for a sign that momentum could be picking up.
Not sure which broker to choose? We’ve made a list of the best forex brokers for you.
Oil prices climbed in Asian trade on Thursday due to a significant drop in U.S. inventories, which raised hopes for sustained demand in the world’s largest fuel consumer. Bargain buying helped oil prices rebound from multi-month lows, but the rally is losing momentum.
Negative economic data from China, particularly regarding crude imports, has stymied further gains. Both oil contracts have faced sharp losses recently due to fears of a potential U.S. recession impacting demand.
The Fed may respond with more aggressive rate cuts to bolster the US economy. However, more aggressive rate cuts could sharply narrow interest rate differentials between the US and Japan and trigger another Yen carry trade unwind.
Bets on a more dovish Fed rate path could support a USD/JPY drop toward 140.
Arch Capital Chief Economist Parker Ross commented on the labor market, saying,
“The 1-month private sector job diffusion index, which measures the share of industries recording an expansion of payrolls during the most recent month, dipped below 50 for the first time since the pandemic in July to 49.6.”
USD/JPY trends will hinge on US jobless claims and central bank commentary. An unexpected increase in continuing jobless claims and dovish Fed chatter could support a USD/JPY fall toward 140.
Investors should remain alert. Monitor real-time data, central bank monetary policy decisions, and expert commentary to adjust your trading strategies accordingly. Stay updated with our latest news and analysis to manage USD/JPY volatility.
The USD/JPY hovered below the 50-day and 200-day EMAs, confirming the bearish price trends.
A USD/JPY return to 147.500 would support a move toward the 148.529 resistance level and the trend line. A breakout from the trend line could give the bulls a run at 150. However, selling pressure could intensify at the trend line. The trend line is confluent with the 148.529 resistance level.
Central bank commentary and US jobless claims need consideration on Thursday.
Conversely, a drop below the 145.891 support level could signal a fall toward the 143.495 support level. A fall through the 143.495 support level could bring the 141.032 support level into play.
The 14-day RSI at 25.98 shows the USD/JPY in oversold territory. Buying pressure may increase at the 145.891 support level.
The US dollar has shot straight up in the air against the Japanese yen during trading on Wednesday after overnight trading saw one of the officials out of the Bank of Japan suggesting that they were not going to continue to raise interest rates in an unstable market environment. The Nikkei 225 lost 20% in three days, so that of course really shook the foundations of the financial world.
With this, it looks like carry traders are starting to come back into the market, but from a technical analysis standpoint, we have to pay close attention to the fact that we are testing the bottom of a major uptrend line. By doing so, we are setting up a fight right around the 148.50 yen level. For me, that’s the demarcation line of going long. While it does look rather intriguing, you can see clearly that a massive trend line has been tested by us have pulled back from.
That means I’m going to observe. I’m going to see how this closes, but as things stand right now, this might be more of a story heading into the weekend, but we definitely have made inroads into supporting this pair. I love the carry trade. You get paid at the end of every day.
And of course, at the end of Wednesday, you’ll get paid triple through most retail brokerage firms. So that does count as well. If we can get above the 150 yen level, I think that’s when we really start to see momentum build up. If we were to turn around and fall below the lows of just a couple of days ago, that would be a very, very bad sign.
For a look at all of today’s economic events, check out our economic calendar.
This article was originally posted on FX Empire
Spot Gold stabilized just below the $2,400 mark, with the US Dollar out of investors’ radar amid a better market mood. The Greenback eased unevenly across the FX board, appreciating only against safe-haven JPY and CHF. XAU/USD, in the meantime, trades near its daily opening at $2,390.34.
Most of the market’s relief came from Asia. Bank of Japan (BoJ) Deputy Governor Shinichi Uchida hit the wires and said the BoJ would not raise interest rates if global markets remained unstable, cooling down the chance of a near-term hike. The news put a halt to the Japanese Yen (JPY) rally, as the currency soared after the BoJ hiked rates last week by 15 basis points (bps), while Governor Kazuo Ueda stated afterwards that interest rates are still at a “very low” level. Even further, government bond yields extended their weekly recovery after plummeting to multi-year lows earlier in the month.
Data-wise, the calendar had nothing relevant to offer, with speculative interest still focusing on what policymakers could do next. The US Federal Reserve (Fed) is also in the eye of the storm, as concerns about economic growth triggered by the latest macroeconomic data spurred speculation that the central bank may trim interest rates before the next monetary policy meeting scheduled for September.
In such a scenario, Gold will likely remain strong as uncertainty usually fuels demand for the safe-haven metal. XAU/USD dailt chart shows technical indicators have pared losses and turned marginally higher, within neutral or negative levels, limiting the bullish potential in the upcoming sessions. Even further, the pair develops below a bullish 20 Simple Moving Average (SMA), which currently extends its advance above the 38.2% Fibonacci retracement of the June/July rally at $2,411.20, an immediate resistance level. Finally, the longer moving averages keep advancing far below the current price, supporting the long-term bullish stance.
In the near term, XAU/USD is neutral. The 4-hour chart shows a bearish 20 SMA keeps heading south below the current level after crossing below a flat 100 SMA. The 200 SMA, in the meantime, provides dynamic support at around $2,385.00. Finally, technical indicators have bounced from their recent lows but turned flat within neutral levels, somehow suggesting absent buying interest as per XAU/USD holding just below their midlines.
Support levels: 2,385.00 2,372.90 2,366.00
Resistance levels: 2,411.20 2,424.10 2,438.80
The EUR/USD pair stabilized above the 1.0900 mark on Wednesday as the market mood continues to improve. The better sentiment partially resulted from comments from Bank of Japan (BoJ) Deputy Governor Shinichi Uchida, whose dovish words poured cold water on Asian markets. Uchida said the BoJ would not raise interest rates if global markets remained unstable, cooling down the chance of a near-term hike. The Japanese Yen (JPY) soared after the BoJ hiked rates last week by 15 basis points (bps), and Governor Kazuo Ueda stated afterwards that interest rates are still at a “very low” level.
Also, government bond yields are recovering after collapsing at the beginning of the month. The United States (US) 10-year Treasury note currently offers 3.93%, while the 2-year note yields roughly 4.0%. As a result, global stocks trade with a better tone, weighing unevenly on the US Dollar.
Meanwhile, the macroeconomic calendar remains scarce. Germany published the June Trade Balance, which posted a surplus of €20.4 billion, missing expectations. Also, industrial Production rose 1.4% in the same month from May but edged 4.1% lower from a year earlier. The US released MBA Mortgage Applications for the week ended August 2, which rose 6.9%. The country will later publish the June Consumer Credit Change.
Heading into Wall Street’s opening, the Euro is among the USD’s weakest rivals. The daily chart for the EUR/USD pair shows it trades in the red, at the lower end of Tuesday’s range. Furthermore, the Momentum indicator struggles to remain within positive levels, currently neutral, while the Relative Strength Index (RSI) indicator heads lower above its 50 level. On a positive note, the pair keeps trading well above its moving averages, with the 20 Simple Moving Average (SMA) maintaining its bullish slope at around 1.0875.
In the near term, and according to the 4-hour chart, the pair is neutral-to-bearish. EUR/USD trades a handful of pips below a firmly bullish 20 SMA while far above directionless 100 and 200 SMAs. Technical indicators, however, head south within neutral levels, with limited momentum but still pointing to another leg lower. The pair needs to break with volume the 1.0890 support level to extend its slide in the upcoming sessions.
Support levels: 1.0890 1.0845 1.0800
Resistance levels: 1.0950 1.1005 1.1045
Things have taken a bad turn for the Middle East. Asia, by far the largest demand hub for Saudi Arabia, Iraq or the United Arab Emirates, seems to be going through the same stage of weakness that Europe and the United States were in the spring. Not buying enough, depleting crude inventories and generally expecting flat prices to drop lower before they come back. Perhaps there is no better example of this than China, a country that was supposed to lead summer demand recovery yet ended up buying the least crude this year as its maritime imports dropped to 10 million b/d. Such a general trend of weaker demand and sluggish physical activity inevitably impacted the Middle Eastern futures market, with the Dubai cash-to-futures spread shedding 60 cents per barrel compared to May and averaging only $0.95 per barrel. Seeing that refinery margins have been struggling to move any higher – to be fair they did not decline either – the market was preparing for a substantial price cut for August-loading cargoes across the Middle East.
Chart 1. Saudi Aramco’s Official Selling Prices for Asian Cargoes (vs Oman/Dubai average).
Source: Saudi Aramco.
Saudi Aramco did exactly what was expected. Having already cut formula prices for July cargoes, it lowered Asian OSPs across the board. The lighter Arab Extra Light and Arab Light were slashed by 60 cents per barrel, whilst the heavier grades Arab Medium and Arab Heavy saw an even bigger downward correction, by 70 cents per barrel. With this, Asian formula prices were basically back to May pricing levels, with Arab Light trading at a $1.80 per barrel premium to Oman/Dubai and Arab Medium set $1.25 per barrel higher than the benchmark. The lower pricing was in great measure brought about by very low nominations from term buyers. Total volumes departing for China in June averaged only 1.15 million b/d, the lowest monthly nomination since the first full-impact COVID-19 month of March 2020, whilst India hit a three-year low with a mere 530,000 b/d of June loadings. Even though both countries lifted more in July, the sentiment remained weak and Saudi Aramco needed to react.
Related: OPEC: Oil Is Indispensable for Global Electrification
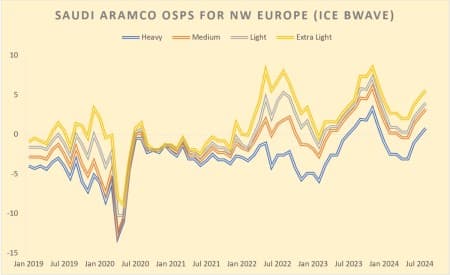
Chart 2. Formula prices of Saudi cargoes bound for Northwest Europe by selected grades (vs ICE Brent).

Source: Saudi Aramco.
Compared to Asia which did not really experience notable weakness in buying up until June this year, Europe was already one phase ahead – it saw an all-round collapse of differentials earlier and was rebounding strongly into the summer. Saudi Aramco lifted its Europe-bound August formula prices by a hefty (and uniform) 90 cents per barrel. By not cutting when regional differentials were collapsing and hiking when conditions were ripe, Aramco managed to bring its European OSPs to the highest level since December 2023. Arab Light is at a $4 per barrel premium to ICE Brent, and even Arab Heavy is trading at a premium to the European futures benchmark. That would seem extraordinary in the spring months, but it has gone down well for the summer. In fact, according to market reports all the European term deal holders nominated full monthly amounts for August, suggesting that even despite high prices demand for medium sour crude remains high.
Chart 3. Kuwait Export Blend official selling prices into Asia, compared with Arab Medium and Iranian Heavy (vs Oman/Dubai average).

Source: KPC.
Kuwait doesn’t necessarily share the concerns and qualms of Saudi Arabia, after all the main reason why the country’s exports have been going down so heavily in the past years stems from its own refining. Not only is the 615,000 b/d Al Zour refinery firing on all cylinders, the 230,000 b/d Duqm refinery in Oman that the Kuwaiti state oil company co-operates has reached full production capacity, too. Depending equally on South Korea, China, and Vietnam as its key contractual partners, KPC nevertheless followed Saudi Aramco’s suit and slashed the Asian formula prices for Kuwait Export crude by 70 cents per barrel, taking it to a $1.25 per barrel premium over the Oman/Dubai average. Even the extra light KSLC grade, relatively minor in terms of volumes as KPC has been loading an average of three tankers per month, was cut by 60 cents per barrel vs the July OSP, fully in line with Arab Extra Light.
In the meantime, Kuwait has registered probably one of the largest oil discoveries of past years, claiming that the offshore al-Nokhatha field contains some 2.1 billion barrels of light oil and 5.1 trillion cubic feet of natural gas. As Kuwait has allocated a $300 billion upstream investment budget for its production capacity increases but genuinely lacked any high-impact greenfield project to work on, the field might be a game-changer for the Middle Eastern country’s long-term target of increasing crude production capacity to 4 million b/d.
Chart 4. ADNOC Official Selling Prices for 2017-2024 (set outright, here vs Dubai).

Source: ADNOC.
As has become customary, the national oil company of Abu Dhabi ADNOC is the one to start the price-setting spree in the Middle East and for August (once again), the news weren’t particularly upbeat. They weren’t bad either as the monthly average of Murban traded on the IFAD exchange amounted to $82.52 per barrel, down $1.41 per barrel compared to July’s price. Although Murban is still assessed slightly above Dubai swaps, it is nowhere near as spectacular as it used to be a year or two years ago. The pricing plight of Murban is largely driven by there being significantly more of it in the market as exports of the light sour grades jumped to 1.3-1.4 million b/d since the beginning of this year and have stayed high since. ADNOC’s refinery flexibility project that aimed to send heavier grades into the domestic refining system has finally come to a close, albeit at the expense of Murban’s past premiums. The UAE’s oil champion has also brought Upper Zakum (UZ), the country’s answer to Saudi Arabia’s Arab Light, to parity with Murban after it traded at slight premia to Murban over several months, but seeing weaker demand for UZ in Dubai trades, ADNOC decided to react.
ADNOC is increasingly diversifying its portfolio into gas. In fact, the largest announcement coming out of the Emirates in July was linked to its planned 9.6 mtpa Ruwais LNG export terminal. Western oil majors TotalEnergies, Shell, BP as well as Japan’s Mitsui have all taken 10% equity stakes, with Shell and Mitsui also signing long-term supply agreements. Following ADNOC’s natural gas-focused acquisitions in Mozambique this May and the mulled purchase of Australia’s upstream firm Santos, gas seems to be at the forefront of the UAE’s strategic growth.
Chart 5. Iraqi Official Selling Prices for Asia-bound cargoes (vs Oman/Dubai).

Source: SOMO.
Sticking to its course of mirroring Saudi Aramco’s pricing changes but keeping its grades comparatively cheaper, Iraq has also committed to a cut of 70 cents per barrel for its flagship grade Basrah Medium. For August-loading cargoes, the price will be coming in at a slight discount to Oman/Dubai, just $0.10 per barrel lower than the average of the two benchmarks. In contrast to Saudi Arabia, Iraqi exports weren’t really impacted by lower demand, if anything seaborne flows in May were the highest in five years according to Kpler data, even though since then Iraq has mended its ways and lowered exports to 3.35 million b/d (down about 200,000 b/d month-over-month). As the strength of Dated Brent has preferentially benefited Iraqi formula prices that are linked to the physical benchmark – Saudi Arabia is pricing its barrels based on ICE Brent – the increases carried out by the state oil marketing company SOMO for Europe-bound cargoes were much smaller than Aramco’s. Basrah Medium was hiked by 45 cents per barrel from July to a -$2.40 per barrel discount to Dated, whilst the heavier Basrah Heavy grade saw an uplift of 60 cents per barrel to a -$4.95 per barrel discount.
Chart 6. Iraqi official selling prices in Europe (vs Dated Brent).

Source: SOMO.
Whilst SOMO still sets formula prices for the Kirkuk grade which has historically been sourced from Kurdish-origin production, the deadlock around halted pipeline supplies along the Kirkuk-Ceyhan pipeline remains just as difficult to resolve as it was a year ago. Nevertheless, Kurdish production keeps on increasing with every month, aggravating Baghdad’s woes in meeting its OPEC+ production target. Even though SOMO reports production of 3.83 million b/d in the regions controlled by Baghdad, substantially below the 4 million b/d target, there might be an additional 350,000 b/d produced in Kurdistan. At least half of the Kurdish output is smuggled into the neighboring countries of Turkey and Iran, ultimately making it close to impossible for federal authorities in Iraq to control the rampant trade.
Chart 7. Iranian Official Selling Prices for Asia-bound cargoes (vs Oman/Dubai average).

Source: NIOC.
The election of former health minister Masoud Pezeshkian in the second round of Iran’s presidential elections held on 5 July was hardly a transformative event for the country’s oil industry. There is no discussion of easing sanctions on Tehran – if anything, Donald Trump’s potential re-election would worsen that squeeze – and for as long as Chinese buyers are still buying Iranian crude, Iran will just stick to relying on its key importer. That is not to say Tehran would not seek some form of de-escalation, and the recent release of the Chevron-chartered Advantage Sweet tanker as well as the Iraqi Basrah cargo that was sailing towards Turkey when it was seized by Iran’s navy in January. Iran’s pricing policy remains a largely academic exercise as delivered prices to China are significantly below the formula prices that the country’s state oil firm NIOC publishes, dropping as low as -$7 or -$8 per barrel to Brent futures. Yet in doing so, Iran has remained consistent and followed the line toed by Saudi Aramco. NIOC cut its Asian August formula prices by 50-70 cents per barrel, lowering the nominal value of Iran Light to a $2.10 per barrel premium against the Oman/Dubai average.
By Gerald Jansen for Oilprice.com
More Top Reads From Oilprice.com:
The Pound Sterling bounced off daily/weekly lows and rose above the 1.2700 figure on Wednesday as risk appetite improved after a Bank of Japan (BoJ) official commented the BoJ wouldn’t raise rates amid market instability. Therefore, the GBP/USD trades at 1.2720 after touching a low of 1.2680.
The GBP/USD is neutral to bearishly biased after diving below the 50-day moving average (DMA) at 1.2785. Sellers piercing of the latter sounded buyers’ alarms, which entered below the 1.2700 mark, yet remained in the backfoot as the Greenback strengthened.
The August 6th low at 1.2672 could be tested if GBP/USD slips under 1.2700, and losses could be deeper if it slumps beneath the 200-DMA at 1.2651.
Conversely, if buyers keep the GBP/USD above 1.2700 and lift the spot price toward the 50-DMA, that could exacerbate a test of the 1.2800 mark.
The table below shows the percentage change of British Pound (GBP) against listed major currencies today. British Pound was the strongest against the Japanese Yen.
| USD | EUR | GBP | JPY | CAD | AUD | NZD | CHF | |
|---|---|---|---|---|---|---|---|---|
| USD | -0.02% | -0.25% | 2.21% | -0.45% | -0.62% | -1.21% | 1.68% | |
| EUR | 0.02% | -0.24% | 2.24% | -0.44% | -0.63% | -1.18% | 1.72% | |
| GBP | 0.25% | 0.24% | 2.46% | -0.20% | -0.40% | -0.90% | 1.95% | |
| JPY | -2.21% | -2.24% | -2.46% | -2.59% | -2.79% | -3.31% | -0.52% | |
| CAD | 0.45% | 0.44% | 0.20% | 2.59% | -0.18% | -0.72% | 2.15% | |
| AUD | 0.62% | 0.63% | 0.40% | 2.79% | 0.18% | -0.50% | 2.36% | |
| NZD | 1.21% | 1.18% | 0.90% | 3.31% | 0.72% | 0.50% | 2.87% | |
| CHF | -1.68% | -1.72% | -1.95% | 0.52% | -2.15% | -2.36% | -2.87% |
The heat map shows percentage changes of major currencies against each other. The base currency is picked from the left column, while the quote currency is picked from the top row. For example, if you pick the British Pound from the left column and move along the horizontal line to the US Dollar, the percentage change displayed in the box will represent GBP (base)/USD (quote).