The main category of Forex News.
You can use the search box below to find what you need.
[wd_asp id=1]
The main category of Forex News.
You can use the search box below to find what you need.
[wd_asp id=1]
The USD/JPY forecast points North as the pair reverses its sharp decline. The yen plummeted after a Bank of Japan official dampened hopes for a near-term rate hike. Meanwhile, the dollar steadied as Fed rate cut expectations eased slightly.
-Are you looking for automated trading? Check our detailed guide-
On Wednesday, BoJ Deputy Governor Shinichi Uchida said the central bank should pause due to the recent volatility in global markets. These remarks reduced the likelihood of a near-term rate hike in Japan.
The Bank of Japan raised rates for the second time last week, boosting the yen and reducing the gap in interest rates between Japan and the US. As a result, investors gave up the carry trade that had thrived amid wide interest rate differentials.
Initially, investors had borrowed the yen at low rates to buy dollar assets for higher returns. However, the carry trade could lose popularity now that the BoJ is hiking and the Fed is about to cut rates. Consequently, the yen might recover beyond the recent 7-month peak. However, this depends on how fast the BoJ will tighten its monetary policy. A slow pace might keep pressure on Japan’s currency.
Meanwhile, the US dollar steadied as Fed rate cut expectations eased slightly. After last week’s jobs report, markets moved to price an 85% chance of a 50-bps rate cut in September. However, upbeat US service activity data eased recession fears and lowered the chances of this rate cut. Currently, there is a lower 70% chance of a rate cut in September.
Investors might pause and reflect on the recent volatility as there are no high-impact releases from the US or Japan.
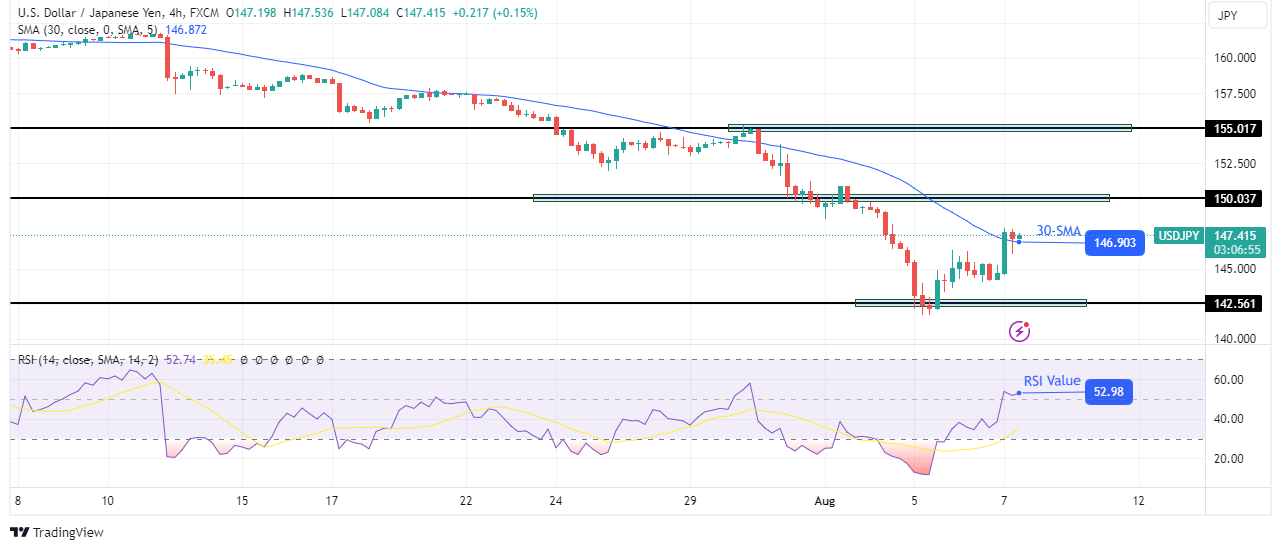
On the technical side, the USD/JPY price has broken above the 30-SMA with a solid bullish candle. At the same time, the RSI now trades above 50, in bullish territory. These changes indicate a shift in sentiment to bullish. The previous bearish trend paused near the 142.56 key level, where bulls resurfaced.
-If you are interested in forex day trading then have a read of our guide to getting started-
If the price sustains a move above the 30-SMA, it might retest the 150.03 resistance level. However, the price must start making higher highs and lows to confirm a new trend.
Looking to trade forex now? Invest at eToro!
67% of retail investor accounts lose money when trading CFDs with this provider. You should consider whether you can afford to take the high risk of losing your money.
Netherlands coffee and tea group JDE Peet’s has raised its full year forecast as it looks to increase pricing amidst ongoing “volatility” in green bean coffee prices.
In its latest half year results, the group raised its total company full year performance from mid-single-digit growth to a forecasted increase in organic adjusted EBIT of “around” 10%.
The coffee roaster and supplier’s organic sales growth is now expected to be in the higher end of its medium range of 3-5%. It was previously in the lower end.
In its half year results for 2024 for the six months ended 30 June, JDE Peet’s posted revenue of €4.2bn ($4.6bn), increasing 3.6% organically year on year and 5.6% on a reported basis. The group booked a profit increase of 86.5% to €360m.
“Given our strong performance in the first half, and our expectations for the remainder of the year – including the ongoing inflation and volatility in green coffee prices, along with the additional pricing that this will require – we are confident in raising our full-year outlook across top-line, profitability and cash flow,” JDE Peet’s interim CEO Luc Vandevelde said.
Robusta coffee bean prices in the second half of JDE Peet’s financial year were up by 54% on the year prior, while Arabica was up 13%.
Access the most comprehensive Company Profiles
on the market, powered by GlobalData. Save hours of research. Gain competitive edge.

Company Profile – free
sample
Your download email will arrive shortly
We are confident about the
unique
quality of our Company Profiles. However, we want you to make the most
beneficial
decision for your business, so we offer a free sample that you can download by
submitting the below form
By GlobalData
Speaking to investors on an earnings call last week, Vandevelde explained that the company would look to increase prices to defend its future gross profits.
He said: “The green coffee inflation of the last quarters will hit our P&L [profit and loss] in the coming quarters and thus inevitably [requires] additional price increases and continued cost discipline which I think are essential in protecting our gross profit so we can ensure that we can maintain the right investment levels behind our brands, products, channels, which is crucial for driving growth and shareholder value, both short-term and long-term.”
He added: “The negotiations are actually ongoing right now. We seem to be getting better reception this time around than we did on previous occasions. Actually the first quarter of this year was hit by some retailer retaliation, as we call it, but that levelled out quite nicely in the second quarter.”
A report from GlobalData, Just Drinks’ parent company, showed coffee futures prices surged in March and early April, with cheaper Robusta beans closing as high as $3,700 per tonne and more premium Arabica hitting $2.10 per pound, the highest level in over a year and a half.
Weather condition concerns in the key coffee growing regions of Vietnam and Brazil are driving the surge in prices, alongside the impact of ongoing conflicts in Ukraine and Gaza.
More recent analysis from the data analytics and consulting group suggested that prices stablised in June but are still “at still-high levels”. It said the supply of Arabica beans was in “surplus”, although “another Robusta deficit” looked likely.
In March, JDE Peet’s announced the departure of its 2020 CEO appointment, Fabien Simon. No reasons were given for the change at the top of the business.
Vandevelde was the former Marks and Spencer chairman and CEO and is now a lead independent director at JDE Peet’s. He took over the CEO role on an interim basis while the company looks for a permanent replacement for Simon.
JDE Peet’s has said the search for its CEO successor is still on going. Vandevelde added that the company had brought candidates down to a “very short” list.
“The search and selection process is progressing very well and I do intend to contract my successor before the end of the year,” Vandevelde said.
When asked by an analyst if he was on that short list Vandevelde responded: “I’m really thoroughly enjoying the role of CEO, but I’ve learned in life not to climb the same mountain too many times. So I’ll be very happy to hand over to my successor.”

Also, traders in Europe have increased their expectations for rate cuts by the European Central Bank, now expecting an additional 90 basis points cut this year, with a further 50 basis points likely at the September meeting. On the economic data front, German factory orders unexpectedly rose 3.9% in July, offering a glimmer of hope for a recovery in the struggling manufacturing sector.
On the stock trading front, European stocks closed a volatile session with mixed performance. According to trading, the major European bourses closed with mixed performance, with the Stoxx 50 index down 0.1% and the Stoxx 600 index up 0.2% after a brief recovery in morning trading, as concerns over the economic outlook persisted.
On the data front, factory orders in Germany unexpectedly rose 3.9%, beating market expectations for a 0.8% increase, sparking optimism about the struggling manufacturing industry. On the other hand, retail sales in the euro zone fell more than expected. Financial stocks led the losses, with BNP Paribas, UniCredit, Instesa Sanpaolo and Deutsche Börse falling more than 1.3%. Bayer shares also fell about 6% after reporting a sharp decline in quarterly profit for the three months ended in June. In the meantime, ASML shares added nearly 6% to enjoy some relief from the recent sell-off, while Airbus and Saab shares advanced more than 2%.
On another front, the yield on 10-year German bonds rose to 2.2% after touching a six-month low of 2.16% earlier in the month, as traders continue to assess monetary and economic forecasts. Weak US economic data has raised concerns about a significant slowdown or potential recession in the world’s largest economy, raising bets that the Federal Reserve will need to cut interest rates more aggressively. Also, European traders have increased their expectations for interest rate cuts by the European Central Bank, now anticipating an additional 90 basis point cut this year, with a possible 50 basis point cut at the September meeting.
On the economic calendar front, Eurozone construction PMI points to another significant contraction. The HCOB Eurozone Construction PMI fell to 41.4 in July, its lowest level in six months, from 41.8 in June. The reading showed that the construction sector remained firmly in contraction territory as activity fell markedly again, with output falling by the most in six months, driven once again by large contractions in housing activity. Likewise, New work fell amid weak demand and a drop in new orders, sparking another round of job losses, with employment falling at a slightly sharper rate.
Additionally, the downsizing and cost-cutting were reflected in a sharp contraction in input purchasing and marked reductions in the use of subcontractors. However, cost burdens rose only modestly. “Eurozone builders see little light at the end of the tunnel,” said Norman Lipke, economist at Hamburg Commercial Bank. Added, “Pessimism has deepened in Germany and France, fearing weaker demand in the next 12 months, while optimism in Italy has eased to a 22-month low.”

If the bulls give up the psychological resistance level of 1.1000, there may be opportunities for selling operations for the EUR/USD pair. According to the performance on the daily chart, breaking the support of 1.0820 will end the hopes of rising and the bears will control the trend again. Moreover, our recommendation to sell the Euro Dollar from the resistance of 1.1000 is still valid and profitable. Technically, the price of the Euro Dollar will continue to be affected by the future policies of global central banks and the extent of investors’ appetite for risk or not.
Ready to trade our daily Forex analysis? We’ve made a list of the best forex trading platforms for beginners worth trading with.
Oil prices are expected to drop to the mid-$70s next year amid a surplus on the market, according to Morgan Stanley.
Currently, the oil market is tight and warrants the $80s per barrel price range, but with seasonal demand starting to abate in the fourth quarter, market balances are set to return, the investment bank said in a note carried by Reuters on Monday.
In the fourth quarter of 2024, the market would be balanced “when seasonal demand tailwinds abate and both OPEC and non-OPEC supply return to growth,” Morgan Stanley’s analysts wrote.
Next year, the market will even tip into a surplus amid rising supply from both OPEC+ and non-OPEC+ producers, the bank’s commodity strategists reckon.
According to the bank, global refinery runs will hit their 2024 peak in August and are not expected to reach this level again until July next year.
That’s why Morgan Stanley expects Brent Crude prices to drop from current levels to the mid $70s to high $70s per barrel range in 2025.
Early on Monday, Brent Crude prices were up by 0.52% at $83.07, while the U.S. benchmark, WTI Crude, was trading 0.49% higher at $80.46.
Morgan Stanley reiterated in the note its price forecast of $86 per barrel Brent oil for the third quarter of 2024.
Goldman Sachs has also recently reaffirmed its outlook from June that
Brent crude prices are set to rise to $86 per barrel this summer amid strong consumer demand which will put the market into a sizeable deficit in the third quarter.
The Joint Ministerial Monitoring Committee (JMMC), the OPEC+ panel monitoring the oil market, is not expected to recommend in August any changes to the current production policy plan of the group, OPEC+ delegates told Bloomberg last week.
When the panel meets again on August 1, the meeting is expected to be a routine one, and no recommendations on oil production policy – other than the OPEC+ group has already announced – are expected to be issued, according to Bloomberg’s anonymous sources among the OPEC+ delegates.
By Tsvetana Paraskova for Oilprice.com
More Top Reads From Oilprice.com:
However, a break below $102.710 could trigger significant selling pressure.
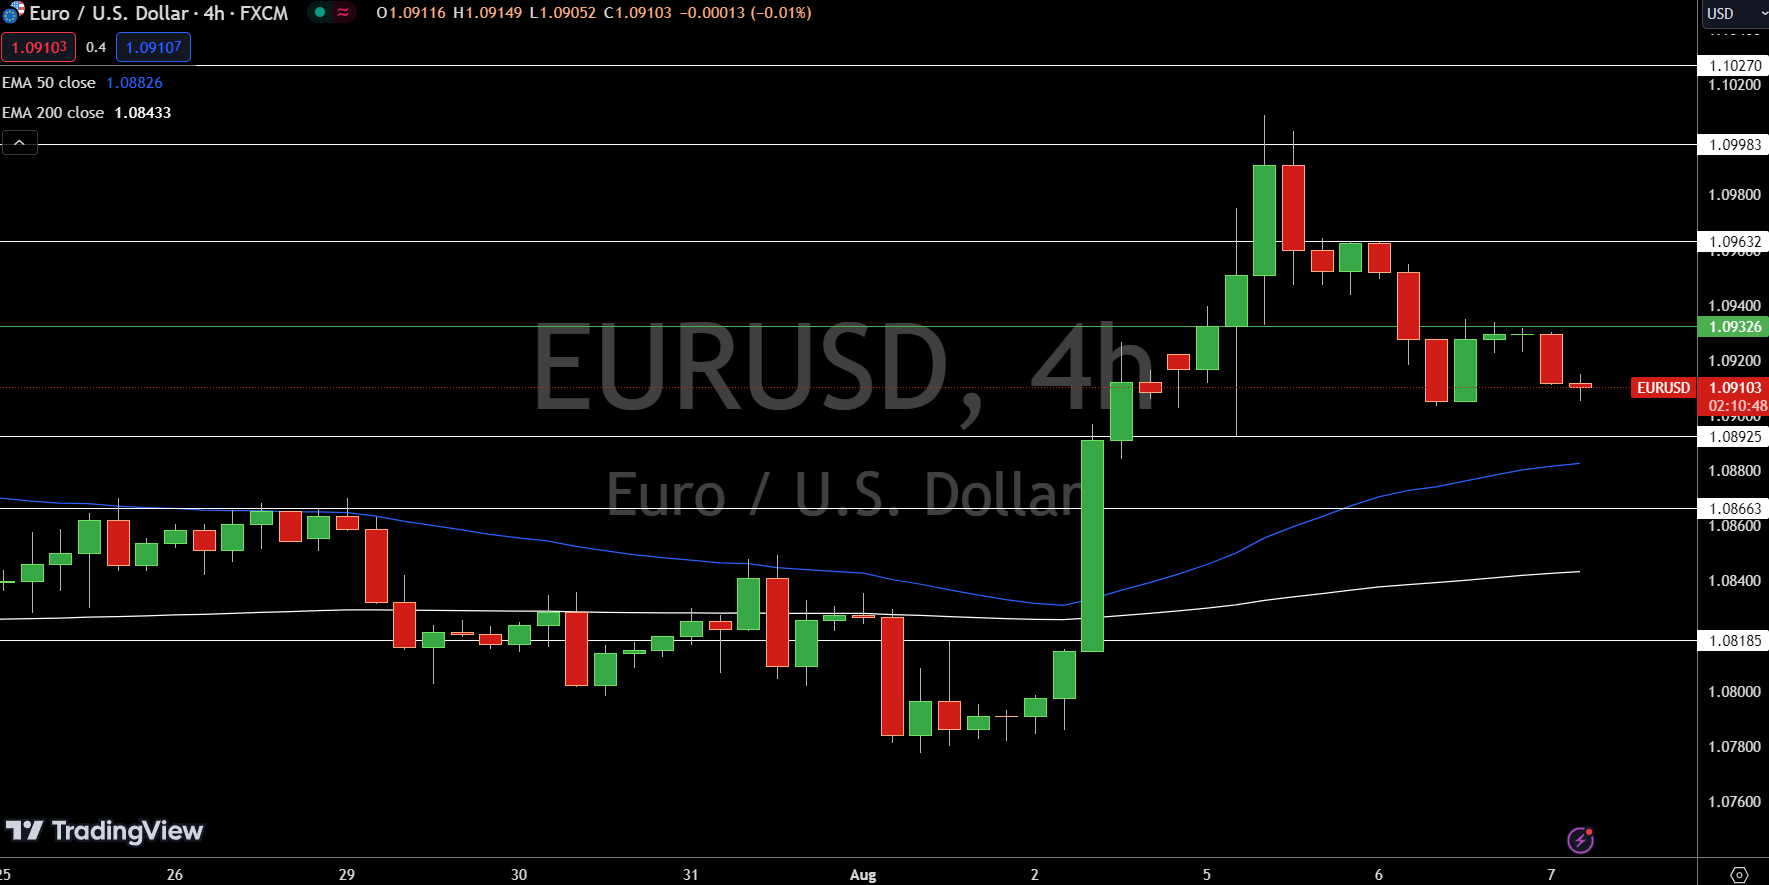
The EUR/USD is trading at $1.09103, down 0.14%, reflecting a bearish sentiment as it stays below the pivot point at $1.09326. Immediate resistance is at $1.09632, with additional resistance levels at $1.09983 and $1.10270.
Support is positioned at $1.08925, $1.08663, and $1.08185, suggesting potential areas of further decline. The 50-day EMA is at $1.08826, and the 200-day EMA is at $1.08433, indicating downward pressure.
The outlook remains bearish below $1.09326, and a break above this level could shift momentum to a bullish bias.
Gold price is extending its losing momentum into the fifth straight day on Wednesday, approaching the weekly low of $2,364 amid a broadly firmer US Dollar (USD) and an uptick in the US Treasury bond yields.
Gold price remains vulnerable despite dovish Fed bets
The US Dollar has come under renewed buying pressure, courtesy of the latest leg higher in the USD/JPY pair and renewed upside in the US Treasury bond yields. Markets appear to have stabilized after the recent turmoil, reducing the haven demand for the US government bonds while lifting the US Treasury bond yields higher across the curve.
The US S&P 500 futures, a risk barometer, reversed early losses to trade 0.55% higher on the day. Meanwhile, Asian markets advance, led by a 4% rally in the Japanese equity indices.
The surge in the Japanese stock markets could be attributed to a fresh sell-off in the Yen after dovish remarks from the Bank of Japan (BoJ) Deputy Governor Shinichi Uchida. Uchida said that the bank “won’t raise rates further if markets are unstable”, adding that it is “appropriate to adjust the degree of monetary easing.”
With the Japanese Yen under fresh downward pressure, USD/JPY spiked nearly 200 pips to 147.50, driving the US Dollar Index higher in tandem. This, in turn, remains a drag on the USD-denominated Gold price even as markets continue to price in aggressive interest-rate cut by the US Federal Reserve (Fed) this year.
Markets are now wagering a 70% chance of the Fed cutting rates by 50 bps in September, the CME Group’s FedWatch tool showed, compared with an 85% chance a day earlier, with major brokerages also anticipating a large rate cut in the next meeting, per Reuters.
Looking ahead, Gold price will remain at the mercy of the risk trends, the USD/JPY moves driven Greenback price action and the expectations surrounding the Fed easing, in the absence of any top-tier US economic data releases. Further, traders will pay close attention to any updates on the geopolitical front, especially with the looming risks of an Iran-Israel war.
Following recent days of volatility on US economic slowdown concerns, the sentiment on Wall Street will also play a pivot role in influencing the value of the US Dollar and Gold price going forward.
Gold price technical analysis: Daily chart
As observed on the daily chart, Gold price finally yielded a daily candlestick closing below the key 21-day Simple Moving Average (SMA) support, then at $2,411.
The decisive break of the latter triggered a renewed downside for Gold price, with the key leading indicator, the 14-day Relative Strength Index (RSI), swinging back into bearish territory. The RSI is currently trading below 50, at 47.50.
With sellers commanding the game, Gold price is set to chart a downside break from a seven-week-old symmetrical triangle formation should the rising trendline support at $2,378 give way on a sustained basis.
If the triangle breakdown is confirmed, the immediate support would be seen at the 50-day SMA of $2,368, below which the $2,350 psychological level will get tested.
Further south, the 100-day SMA at $2,344 could act as a tough nut to crack for Gold sellers.
On the flip side, Gold price needs to recapture $2,400 on a potential rebound, above which the 21-day SMA support-turned-resistance, now at $2,415 will come into the picture.
The next relevant upside target is aligned at static resistance at $2,425.
Gold has played a key role in human’s history as it has been widely used as a store of value and medium of exchange. Currently, apart from its shine and usage for jewelry, the precious metal is widely seen as a safe-haven asset, meaning that it is considered a good investment during turbulent times. Gold is also widely seen as a hedge against inflation and against depreciating currencies as it doesn’t rely on any specific issuer or government.
Central banks are the biggest Gold holders. In their aim to support their currencies in turbulent times, central banks tend to diversify their reserves and buy Gold to improve the perceived strength of the economy and the currency. High Gold reserves can be a source of trust for a country’s solvency. Central banks added 1,136 tonnes of Gold worth around $70 billion to their reserves in 2022, according to data from the World Gold Council. This is the highest yearly purchase since records began. Central banks from emerging economies such as China, India and Turkey are quickly increasing their Gold reserves.
Gold has an inverse correlation with the US Dollar and US Treasuries, which are both major reserve and safe-haven assets. When the Dollar depreciates, Gold tends to rise, enabling investors and central banks to diversify their assets in turbulent times. Gold is also inversely correlated with risk assets. A rally in the stock market tends to weaken Gold price, while sell-offs in riskier markets tend to favor the precious metal.
The price can move due to a wide range of factors. Geopolitical instability or fears of a deep recession can quickly make Gold price escalate due to its safe-haven status. As a yield-less asset, Gold tends to rise with lower interest rates, while higher cost of money usually weighs down on the yellow metal. Still, most moves depend on how the US Dollar (USD) behaves as the asset is priced in dollars (XAU/USD). A strong Dollar tends to keep the price of Gold controlled, whereas a weaker Dollar is likely to push Gold prices up.
Crude oil prices were set for a weekly decline despite earlier gains made largely on the back of economic data.
The latest update that caused the benchmarks to climb higher was U.S. inflation data, which showed a monthly decline for June—the first in four years. On an annual basis, however, inflation was up by 3%.
The news of the monthly decline supported prices, with Brent regaining territory to top $85 per barrel after it slipped below this level earlier in the week on CPI data from China where the decline in consumer prices was seen by analysts as a negative rather than a positive, and a potential sign of weaker oil demand in the coming months.
The monthly CPI dip also fueled hopes of an interest rate cut, which has been in the focus of oil traders’ attention for months.
“Cooling US inflation numbers may support the case for the Fed to kickstart its policy easing process earlier rather than later, but it also adds to the series of downside surprises in U.S. economic data, which points to a clear weakening of the US economy,” IG market strategist Yeap Jun Rong told Reuters.
Oil also received some support from OPEC’s latest monthly report, in which the cartel reiterated its expectations of strong demand for crude, seeing growth at some 2.25 million barrels daily for this year.
“Expected strong mobility and air travel in the Northern Hemisphere during the summer driving/holiday season is anticipated to bolster demand for transportation fuels and drive growth in the United States,” OPEC wrote.
If this does pan out, OPEC may decide to go ahead with the rollback of some of its production cuts to avoid what ING’s Warren Patterson called “a large deficit” in a recent second-half forecast. If it doesn’t, however, OPEC will likely stick to its production controls.
By Irina Slav
More Top Reads From Oilprice.com
“The reality is that, beyond the risk of a US recession, there is also a problem in Japan, namely how to exit an ultra-lax monetary policy after so long. Still, a huge amount of short positions in Yen will be unwinding putting appreciation on the Yen, adding to the volatility. Fasten your seatbelts!”
Later in the session on Wednesday, investors should monitor FOMC Member commentary.
Views on inflation, the labor market, the economic outlook, and the Fed rate path are crucial. Hints of a hard landing and calls for multiple rate cuts to bolster the US economy could spook investors.
According to the CME FedWatch Tool, the probability of a 50 basis point September Fed rate cut to the 475-500 target range surged from 13.2% on July 30 to 85.05% on August 5.
Investors also raised bets on a November Fed rate cut. The chances of a November Fed rate cut to the 450-475 target range jumped from 8.2% on July 30 to 45.0% on August 5.
Fidelity Director of Global Macro Jurrien Timmer commented on the US economy, stating,
“Is this the end of the bull market, and is that long-feared recession finally imminent now that the jobless rate is up to 4.3%? I don’t think so, but clearly the jobs market is slowing, as evidenced by both the JOLTS report and Friday’s jobs data. But I think of this more as an unwinding of COVID-era excesses rather than the start of a new downturn.”
On the Fed rate path, Timmer added,
“The forward curve has gone from 3.5% (7 rate cuts) to 3.0% (9 rate cuts). The market is now pricing in three rate cuts this year.”
USD/JPY trends will hinge on central bank chatter, US jobless claims, and the BoJ’s Summary of Opinions on Thursday. Rising fears of a US recession and hawkish BoJ commentary could signal a USD/JPY drop below 140.
Investors should remain alert. Monitor real-time data, central bank monetary policy decisions, and expert commentary to adjust your trading strategies accordingly. Stay updated with our latest news and analysis to manage USD/JPY volatility.
The USD/JPY remained well below the 50-day and 200-day EMAs, affirming the bearish price signals.
A USD/JPY break above the 145.891 resistance level would support a move toward the 148.529 resistance level and trend line. A breakout from the trend line would bring 150 into view.
Central bank commentary and economic indicators from Japan need consideration on Wednesday.
Conversely, a break below the 143.495 support level could give the bears a run at the 141.032 support level. A drop below the 141.032 support would bring sub-140 into play.
The 14-day RSI at 15.35 shows the USD/JPY in oversold territory. Buying pressure could intensify at the 143.495 support level.
The U.S. Energy Information Administration (EIA) has raised its forecast for crude oil demand in the United States, according to the agency’s Short-Term Energy Outlook released today—although its price outlook for this year and next has been revised down.
The EIA now sees U.S. petroleum and other liquid fuels consumption averaging 20.5 million barrels per day in 2024—that’s up from the agency’s forecast in July of 20.4 million bpd.
Globally, the EIA left its total world consumption of crude oil and liquid fuels unchanged at 102.9 million bpd for 2024, revising its 2025 global fuels consumption slightly downward to 104.5 million bpd from 104.7 million bpd. These figures represent growth of 1.1 million bpd this year, and 1.6 million bpd next year.
For Brent pricing, the EIA reduced its forecast for this year and next, lowering its projections by $2 per barrel to $84 per barrel for the full year 2024. For next year, the EIA also revised its forecast down by $2 per barrel to an average of $86 for the full year.
While prices have been recently on a downward trend and the full-year 2024 guidance has been reduced, the EIA continues to expect crude oil prices to rise in the second half of 2024. The Brent spot price ended July at $81 per barrel, the EIA said, but averaged $85 per barrel for the month. The EIA sees Brent returning to between $85 per barrel and $90 per barrel by the end of the year.
The EIA sees these prices rising as we head into the latter part of the year on the back of global crude oil inventories decreasing by 800,000 bpd in the second half.
By Julianne Geiger for Oilprice.com
More Top Reads From Oilprice.com
Initial resistance levels start with the 20-Day MA at 2.11. However, the most recent interim swing high of 2.15 carries greater significance as it makes up part of the downtrend price structure of lower swing highs. A rise above 2.15 opens the door to the next higher interim swing high of 2.27. Once there is a rise above daily close above the 20-Day MA natural gas will be showing indications of a bullish reversal. Further signs of strength will then be needed.
An enhanced view is provided once a falling bullish wedge is identified on the chart. The pattern is bordered by two orange trendlines. It is a bullish pattern as it shows sellers becoming exhausted, which creates space for buyers to take back control. Nonetheless, a breakout trigger would be needed. That is provided on a rise above the top boundary line of the pattern. There are a couple things to be aware of regarding this pattern in natural gas. First, a bullish breakout should be accompanied by strong bullish momentum. Enough to quickly break above the 20-Day line.
Also, the wedge pattern may not be done forming. There may be more of the pattern to complete before a bullish breakout is ready to trigger. If so, natural gas could fall to its next lower target zone that begins at 1.85 yet maintain the parameters of the falling wedge. The lower target zone is identified down to 1.80. If today’s bullish reversal fails before another bullish reversal is triggered, then natural gas is likely heading to the lower price zone before the correction is over.
For a look at all of today’s economic events, check out our economic calendar.