The main category of Forex News.
You can use the search box below to find what you need.
[wd_asp id=1]
The main category of Forex News.
You can use the search box below to find what you need.
[wd_asp id=1]
XAU/USD extends Monday’s losses and trades in the $2,380 price zone as markets abandon panic. On the one hand, stocks are in better shape after collapsing at the beginning of the week, with United States (US) indexes trading in the green after mixed results among their overseas counterparts. The better tone of equities undermines demand for Gold.
On the other hand, government bond yields recovered, with the 10-year Treasury note yield up over 20 basis points (bps) after falling to fresh multi-year lows, supporting the US Dollar against the bright metal. Nevertheless, market players are still concerned about the United States (US) economic health and maintain bets on massive interest rate cuts before year-end.
XAU/USD trades around the 50% Fibonacci retracement of its June/July rally at $2,388.70, and technical readings in the daily chart show that the risk is skewed to the downside. The pair met intraday buyers around the 38.2% retracement of the same run at $2,411.20, while the 20 Simple Moving Average (SMA) converges with the mentioned level, losing its bullish strength. Technical indicators, in the meantime, head south within negative levels, in line with a downward extension.
In the near term, and according to the 4-hour chart, the bearish case is even stronger. Technical indicators resumed their slides within negative levels and after correcting oversold conditions. At the same time, the 20 SMA gains downward traction well above the current level, while XAU/USD keeps putting pressure on a mildly bullish 200 SMA.
Support levels: 2,372.90 2,366.00 2,352.40
Resistance levels: 2,411.20 2,424.10 2,438.80
The Japanese Yen (JPY) extends its winning streak against the US Dollar (USD) for the fifth successive session on Monday. This momentum is supported by expectations that the Bank of Japan (BoJ) may further tighten monetary policy, along with the unwinding of carry trades, which could provide continued support for the JPY in the near term.
The safe-haven Yen could benefit from heightened geopolitical tensions in the Middle East. An Israeli airstrike on Sunday hit two schools, resulting in at least 30 casualties, according to Reuters. Additionally, US Secretary of State Tony Blinken indicated that Iran and Hezbollah might launch an attack against Israel as early as Monday, based on information from three sources briefed on the call, as reported by Axios.
The US Dollar faces pressure following Friday’s disappointing labor market data, which strengthened expectations for a US Federal Reserve interest rate cut in September. The CME’s FedWatch Tool now indicates a 74.5% probability of a 50-basis point rate cut on September 18, up from 11.5% a week prior.
USD/JPY trades around 142.00 on Monday. The daily chart analysis shows that the pair is continuing its losing streak. The 14-day Relative Strength Index (RSI) is moving below 30, suggesting an oversold currency asset situation and a potential short-term rebound.
The USD/JPY pair navigates the region around lows since December 2023. The pair may test the throwback support at the 140.25 level.
On the upside, the USD/JPY pair might encounter resistance around the nine-day Exponential Moving Average (EMA) at 150.13. A break above this level could weaken the bearish bias and support the pair to test the “throwback support turned resistance” at 154.50, followed by the 50-day EMA at 155.58 level.
The table below shows the percentage change of Japanese Yen (JPY) against listed major currencies today. Japanese Yen was the strongest against the Australian Dollar.
| USD | EUR | GBP | JPY | CAD | AUD | NZD | CHF | |
|---|---|---|---|---|---|---|---|---|
| USD | -0.53% | -0.04% | -2.61% | 0.01% | 1.09% | 0.52% | -1.04% | |
| EUR | 0.53% | 0.41% | -2.24% | 0.42% | 1.62% | 0.94% | -0.63% | |
| GBP | 0.04% | -0.41% | -2.54% | 0.02% | 1.21% | 0.53% | -1.04% | |
| JPY | 2.61% | 2.24% | 2.54% | 2.76% | 3.76% | 3.26% | 1.66% | |
| CAD | -0.01% | -0.42% | -0.02% | -2.76% | 1.11% | 0.51% | -1.24% | |
| AUD | -1.09% | -1.62% | -1.21% | -3.76% | -1.11% | -0.68% | -2.07% | |
| NZD | -0.52% | -0.94% | -0.53% | -3.26% | -0.51% | 0.68% | -1.56% | |
| CHF | 1.04% | 0.63% | 1.04% | -1.66% | 1.24% | 2.07% | 1.56% |
The heat map shows percentage changes of major currencies against each other. The base currency is picked from the left column, while the quote currency is picked from the top row. For example, if you pick the Japanese Yen from the left column and move along the horizontal line to the US Dollar, the percentage change displayed in the box will represent JPY (base)/USD (quote).
On Monday, interest rate futures pointed to a total of 56 basis points of cuts this year, compared to the 47 basis points expected on Friday. In addition, the yield on two-year government bonds, which reflect changes in borrowing costs, fell 8 basis points to 3.526%, the lowest since April 2023. Last week, the Bank of England cut its benchmark interest rate from a 16-year high of 5.25% to 5.0%, the first cut since 2020.
And love electronic trading platforms, the yield on the UK’s 10-year bond fell to a six-month low. According to the performance, the yield on the UK’s 10-year bond fell below 3.8%, the lowest level in six months, as investors increasingly bet on the Bank of England implementing further rate cuts in response to concerns about a possible recession in the United States. Concurrently, markets are expecting a quarter-point rate cut by December, with futures pointing to a 56-basis point cut by the end of the year, up from 47 basis points on Friday.
Last week, the Bank of England cut interest rates by 25 basis points to 5% from a 16-year high of 5.25%, the first cut since 2020. Meanwhile, the UK’s new chancellor of the exchequer announced a series of public spending cuts and strongly hinted that there would be tax increases in the autumn budget to offset part of the £22 billion funding gap.
According to stock trading platforms, the US stock market faced significant declines as trading entered its final hour on Monday, continuing a recent trend of increased volatility. According to trading, the S&P 500 index fell 3.3%, with losses fluctuating throughout the day. During the morning session, the index fell 4.3%, but by lunchtime, it had managed to trim its decline to around 1.8%.
The S&P 500’s 3.3% drop mirrored the broader market’s struggles, but the tech-heavy Nasdaq Composite saw even sharper losses. The Nasdaq fell 3.8% as tech stocks, which have been under pressure in recent days, resumed selling. Additionally, the Russell 2000, which focuses on small-cap companies, also saw a sharp decline, falling 3.7%.
Adding to the market turmoil, the yield on the policy-sensitive 2-year Treasury note saw notable volatility. It ended the day slightly higher at 3.89%. Overnight, the yield fell to a 16-month low but managed to rally to 3.95% in the afternoon. Furthermore, the reversal in Treasury yields underscores the uncertain environment investors are navigating.
The continued volatility in the US stock market was driven by a combination of economic data, geopolitical concerns and investor sentiment. Moreover, the sharp decline in the morning followed by a partial recovery and then another decline suggests that the market is struggling to find direction amidst conflicting signals. Investors are grappling with various factors, including the Fed’s monetary policy stance, inflationary pressures and a potential economic slowdown. Overall, the technology sector, which was previously an important driver of market gains, is now witnessing a clear sell-off, contributing to broader market instability.

According to the performance on the daily chart, the downward trajectory of the GBP/USD price is strengthening. As we mentioned before, moving around and below the 1.2700 level will strengthen the bears’ control over the trend and thus prepare for stronger losses. Technically, the next important support will be 1.2580. On the other hand, and over the same time frame, the psychological resistance of 1.3000 will remain the most important for the general trend to turn to the upside.
Ready to trade our daily Forex forecast? Here’s a list of some of the top forex brokers UK to check out.
The USD/JPY outlook is slightly bullish as the yen pauses its five-session rally. At the same time, the dollar recovered after data in the previous session revealed a rebound in the US services sector in July.
-Are you looking for automated trading? Check our detailed guide-
The yen retreated after reaching a new high in the previous session amid safe-haven demand. Notably, there was panic in the markets on Monday that the US economy was heading for a recession. These fears came from recent economic data showing a surge in the unemployment rate to a three-year high of 4.3%.
Furthermore, US equities sold off due to poor earnings reports, which fueled recession fears. Traditional safe-haven assets like the yen have gained amid these concerns. However, this rally paused Monday after the US released service sector activity data.
The ISM reported that the services PMI rose from 48.8 in June to 51.4 in July, which was higher than the forecast of 51.0. The services sector returned to expansion, reducing some of the fears of a recession. Additionally, rate cut expectations eased slightly. Markets are now pricing in a 75% chance of a 50-bps Fed rate cut in September.
Nevertheless, rate-cut expectations will remain high if inflation continues easing and the economy slows. This will weigh on the dollar and keep the yen strong. At the same time, if the BoJ continues tightening monetary policy, the outlook for USD/JPY will remain bleak.
There won’t be any major releases from the US or Japan. Therefore, the pair might consolidate.
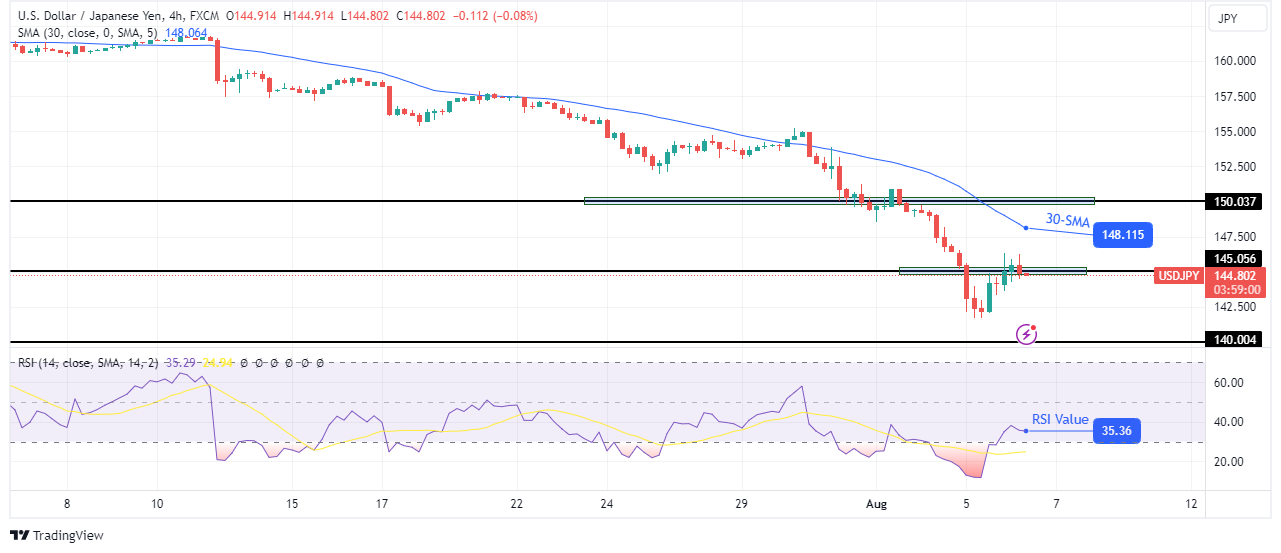
On the technical side, the USD/JPY price has pulled back to retest the 145.05 key level. Although the downtrend has paused, the bearish bias remains strong. The price trades below the 30-SMA, and the RSI is below 50.
-If you are interested in forex day trading then have a read of our guide to getting started-
Therefore, if the pullback continues, the price might retest the 30-SMA resistance before making new lows. However, if bears are ready, they might return at the 145.05 level, to push the price to the next support at 140.00. A lower low will confirm the continuation of the downtrend.
Looking to trade forex now? Invest at eToro!
67% of retail investor accounts lose money when trading CFDs with this provider. You should consider whether you can afford to take the high risk of losing your money.
Important DisclaimersThe content provided on the website includes general news and publications, our personal analysis and opinions, and contents provided by third parties, which are intended for educational and research purposes only. It does not constitute, and should not be read as, any recommendation or advice to take any action whatsoever, including to make any investment or buy any product. When making any financial decision, you should perform your own due diligence checks, apply your own discretion and consult your competent advisors. The content of the website is not personally directed to you, and we does not take into account your financial situation or needs.The information contained in this website is not necessarily provided in real-time nor is it necessarily accurate. Prices provided herein may be provided by market makers and not by exchanges.Any trading or other financial decision you make shall be at your full responsibility, and you must not rely on any information provided through the website. FX Empire does not provide any warranty regarding any of the information contained in the website, and shall bear no responsibility for any trading losses you might incur as a result of using any information contained in the website.The website may include advertisements and other promotional contents, and FX Empire may receive compensation from third parties in connection with the content. FX Empire does not endorse any third party or recommends using any third party’s services, and does not assume responsibility for your use of any such third party’s website or services.FX Empire and its employees, officers, subsidiaries and associates, are not liable nor shall they be held liable for any loss or damage resulting from your use of the website or reliance on the information provided on this website.Risk DisclaimersThis website includes information about cryptocurrencies, contracts for difference (CFDs) and other financial instruments, and about brokers, exchanges and other entities trading in such instruments. Both cryptocurrencies and CFDs are complex instruments and come with a high risk of losing money. You should carefully consider whether you understand how these instruments work and whether you can afford to take the high risk of losing your money.FX Empire encourages you to perform your own research before making any investment decision, and to avoid investing in any financial instrument which you do not fully understand how it works and what are the risks involved.
We are well above the 50 day EMA, as well as the 200 day EMA indicators. This means that a lot of technical traders will look at this as a market that has completely changed its overall trajectory.
The real question is whether or not the 0.84 level ended up being the absolute “floor in the market.” I think that will end up being the case eventually, because quite frankly we have shot straight up in the air, and when you look at the monthly chart, it’s an area that has been crucially important more than once. Short-term pullbacks should be thought of as a potential buying opportunity, with the 200-Day EMA perhaps offering a bit of support near the 0.8540 level. Underneath there, we have the 0.85 level also offering support. As long as we can stay above the 0.85 level, I suspect that the British pound will continue to suffer at the hands of the euro strength (EUR/GBP currency pair).
A lot of what we are seeing comes down to the Federal Reserve and the fact that they may start aggressively cutting rates. If that’s going to be the case, then it makes a lot of sense that we would continue to see the euro do fairly well, because it is considered to be the “anti-dollar.” In that environment, you do get a significant amount of “knock on effect” in this pair, as well the other euro related once. In general, this is a pair that is typically very choppy and noisy, so the fact that we have had 3 very impulsive days to the upside will not go unnoticed by traders around the world. At this point, I think the buyers are definitely starting to flex their muscles.
Ready to trade our daily Forex analysis? We’ve made a list of the best forex demo accounts worth trading with.
GBP/USD failed to benefit from the broad-based selling pressure surrounding the US Dollar (USD) on Monday and closed the day in negative territory. The pair stays on the back foot early Tuesday and declines toward 1.2700.
The table below shows the percentage change of British Pound (GBP) against listed major currencies this week. British Pound was the weakest against the Japanese Yen.
| USD | EUR | GBP | JPY | CAD | AUD | NZD | CHF | |
|---|---|---|---|---|---|---|---|---|
| USD | -0.03% | 0.72% | -1.32% | -0.19% | 0.36% | 0.52% | -0.38% | |
| EUR | 0.03% | 0.67% | -1.44% | -0.29% | 0.38% | 0.44% | -0.46% | |
| GBP | -0.72% | -0.67% | -2.04% | -0.93% | -0.27% | -0.21% | -1.12% | |
| JPY | 1.32% | 1.44% | 2.04% | 1.16% | 1.63% | 1.86% | 0.97% | |
| CAD | 0.19% | 0.29% | 0.93% | -1.16% | 0.58% | 0.71% | -0.37% | |
| AUD | -0.36% | -0.38% | 0.27% | -1.63% | -0.58% | 0.04% | -0.85% | |
| NZD | -0.52% | -0.44% | 0.21% | -1.86% | -0.71% | -0.04% | -0.89% | |
| CHF | 0.38% | 0.46% | 1.12% | -0.97% | 0.37% | 0.85% | 0.89% |
The heat map shows percentage changes of major currencies against each other. The base currency is picked from the left column, while the quote currency is picked from the top row. For example, if you pick the British Pound from the left column and move along the horizontal line to the US Dollar, the percentage change displayed in the box will represent GBP (base)/USD (quote).
Escalating geopolitical tensions triggered an intense flight to safety at the beginning of the week. The broad market selloff weighed heavily on the USD but the risk-sensitive Pound Sterling failed to find demand in the risk-averse market environment.
Although there are no fresh developments that point to a de-escalation of the conflict in the Middle East, investors seem to be breathing a sigh of relief for now. At the time of press, US stock index futures were up between 0.4% and 0.8%, while the UK’s FTSE 100 Index was trading flat. It’s worth noting that US stock index futures were up more than 1% earlier in the session, suggesting that risk flows are losing steam already.
The economic calendar will not offer any high-tier data releases that could impact the USD’s valuation in a meaningful way. Hence, market participants will pay close attention to changes in risk perception.
GBP/USD was last seen trading near the 1.2710-1.2700 support area, where the Fibonacci 78.6% retracement of the latest uptrend and a psychological level align. In case that region turns into resistance, additional losses toward 1.2620 (static level, beginning point of the uptrend) and 1.2600 (psychological level, static level) could be seen.
On the upside, resistances could be seen at 1.2780 (Fibonacci 61.8% retracement, descending trend line), 1.2810 (200-period Simple Moving Average) and 1.2830 (Fibonacci 50% retracement).
The Pound Sterling (GBP) is the oldest currency in the world (886 AD) and the official currency of the United Kingdom. It is the fourth most traded unit for foreign exchange (FX) in the world, accounting for 12% of all transactions, averaging $630 billion a day, according to 2022 data. Its key trading pairs are GBP/USD, aka ‘Cable’, which accounts for 11% of FX, GBP/JPY, or the ‘Dragon’ as it is known by traders (3%), and EUR/GBP (2%). The Pound Sterling is issued by the Bank of England (BoE).
The single most important factor influencing the value of the Pound Sterling is monetary policy decided by the Bank of England. The BoE bases its decisions on whether it has achieved its primary goal of “price stability” – a steady inflation rate of around 2%. Its primary tool for achieving this is the adjustment of interest rates. When inflation is too high, the BoE will try to rein it in by raising interest rates, making it more expensive for people and businesses to access credit. This is generally positive for GBP, as higher interest rates make the UK a more attractive place for global investors to park their money. When inflation falls too low it is a sign economic growth is slowing. In this scenario, the BoE will consider lowering interest rates to cheapen credit so businesses will borrow more to invest in growth-generating projects.
Data releases gauge the health of the economy and can impact the value of the Pound Sterling. Indicators such as GDP, Manufacturing and Services PMIs, and employment can all influence the direction of the GBP. A strong economy is good for Sterling. Not only does it attract more foreign investment but it may encourage the BoE to put up interest rates, which will directly strengthen GBP. Otherwise, if economic data is weak, the Pound Sterling is likely to fall.
Another significant data release for the Pound Sterling is the Trade Balance. This indicator measures the difference between what a country earns from its exports and what it spends on imports over a given period. If a country produces highly sought-after exports, its currency will benefit purely from the extra demand created from foreign buyers seeking to purchase these goods. Therefore, a positive net Trade Balance strengthens a currency and vice versa for a negative balance.
Gold price is consolidating the previous swift rebound to near the $2,410 region early Tuesday, as traders absorb Monday’s volatile trading. Gold price struggles to build on the recovery mode amid a solid comeback staged by the US Dollar, alongside the US Treasury bond yields.
Following the assurances by the US and Japanese authorities to calm nerves, markets are witnessing a massive positive shift in risk sentiment. The Asian stocks attempt a turnaround, with the Japanese benchmark index – the Nikkei 225, jumping nearly 10% so far, reversing the 12% historic sell-off seen Monday.
With the return of risk flows, the haven demand for the US government bonds fades, putting a fresh bid under the US Treasury bond yields and helping lift the US Dollar across the board at the expense of the non-interest-bearing Gold price.
San Francisco Fed President Mary Daly said early Tuesday, “none of the labor market indicators she looks at are flashing red at present, but she is monitoring carefully.” Daly, however, added that her mind was open to cutting interest rates as necessary and policy needed to be proactive.
Meanwhile, Japanese Finance Minister Shunichi Suzuki said that he is “seeing bright aspects in the economy on wages, investment front.”
Further, diplomats from the US and Arab nations attempt to de-escalate the tensions between Iran and Israel that flared up since Wednesday, when Hamas leader Ismail Haniyeh was killed in Tehran in an attack. Iran blamed Israel, vowing to retaliate, with US intelligence noting that the attack could be panned over multiple days.
The diplomatic efforts to diffuse the situation seem to provide some support to the recovery in risk sentiment. However, traders remain wary of Iran striking back against Israel, as the former said “it didn’t care if the response triggered a war.”
Iran’s foreign ministry spokesperson, Nasser Kanaani, stated on Monday that while Iran does not intend to heighten regional tensions, it believes it must punish Israel to deter further instability.
As the Middle East geopolitical situation remains in a delicate spot, traders are glued to the upcoming developments, refraining from placing any fresh position in the Gold price. However, the downside in Gold price could remain limited, as markets continue pricing in a nearly 90% chance that the US Federal Reserve (Fed) will cut interest rates by 50 basis points (bps) in September, according to the CME Group’s FedWatch Tool.
Additionally, the market has around 115 basis points of easing priced in for this year, and a similar amount for 2025, per Reuters.
Monday’s sell-off in Gold price, despite broad risk-aversion, could be attributed to investors locking in gains in their Gold longs to cover losses elsewhere. Global stock markets were in turmoil amid escalating Middle East tensions and US economic slowdown fears, following the weak US jobs report on Friday.
As observed on the daily chart, Gold price closed Monday above the key 21-day Simple Moving Average (SMA) support, then at $2,411.
Meanwhile, the 14-day Relative Strength Index (RSI) holds above the 50 level, currently near 52.50, suggesting that the bullish potential remains intact for Gold price.
Gold buyers, however, need acceptance above the static resistance at $2,425 to resume the recovery momentum toward the previous record highs of $2,450.
Further up, the lifetime high of $2,484, reached on July 17, will be on buyers’ radar.
On the flip side, if Gold sellers seek a strong foothold below the 21-day SMA, now at $2,712, the door will open up for a retest of the key confluence support near $2,370. The rising trendline support closes in on the 50-day SMA at that level.
The next relevant downside target is the 100-day SMA at $2,342.
Gold has played a key role in human’s history as it has been widely used as a store of value and medium of exchange. Currently, apart from its shine and usage for jewelry, the precious metal is widely seen as a safe-haven asset, meaning that it is considered a good investment during turbulent times. Gold is also widely seen as a hedge against inflation and against depreciating currencies as it doesn’t rely on any specific issuer or government.
Central banks are the biggest Gold holders. In their aim to support their currencies in turbulent times, central banks tend to diversify their reserves and buy Gold to improve the perceived strength of the economy and the currency. High Gold reserves can be a source of trust for a country’s solvency. Central banks added 1,136 tonnes of Gold worth around $70 billion to their reserves in 2022, according to data from the World Gold Council. This is the highest yearly purchase since records began. Central banks from emerging economies such as China, India and Turkey are quickly increasing their Gold reserves.
Gold has an inverse correlation with the US Dollar and US Treasuries, which are both major reserve and safe-haven assets. When the Dollar depreciates, Gold tends to rise, enabling investors and central banks to diversify their assets in turbulent times. Gold is also inversely correlated with risk assets. A rally in the stock market tends to weaken Gold price, while sell-offs in riskier markets tend to favor the precious metal.
The price can move due to a wide range of factors. Geopolitical instability or fears of a deep recession can quickly make Gold price escalate due to its safe-haven status. As a yield-less asset, Gold tends to rise with lower interest rates, while higher cost of money usually weighs down on the yellow metal. Still, most moves depend on how the US Dollar (USD) behaves as the asset is priced in dollars (XAU/USD). A strong Dollar tends to keep the price of Gold controlled, whereas a weaker Dollar is likely to push Gold prices up.
There is an area right around the 142 yen level and the 141 yen level that offers significant support. We have just broken through a major trend line and therefore it’s likely that we will continue to see a lot of noise in general. Keep in mind that this is about the carry trade unwinding where people had borrowed in Japanese Yen to buy AI stocks and at this point it looks like that trade is all but over.
The interest rate differential still favors the US dollar but quite frankly at this point everybody is so worried about whether or not the Federal Reserve will cut that it is working against the greenback in general if we can turn around and break above the 147.50 yen level then the market could make a move towards the 150 yen level if we break down below the 140 yen level that would be extraordinarily negative and that could send this market much lower at that point the bottom will have fallen out
Quite frankly, we are on the precipice of something big and you’re better served simply standing on the sidelines instead of trying to become a hero or worse yet, getting wiped out. Being patient will protect your account and perhaps keep you in the game period I have seen moves like this wipe out traders and completely remove them from trading forever. Caution is advised.
Ready to trade our daily forex forecast? Here are the best forex brokers in Japan to choose from.
Silver’s price extended its losses below the 100-day moving average (DMA) of $28.67 and is down over 4.50% as risk appetite deteriorated following weaker data from the United States (US). This reignited recession fears, as ISM Manufacturing PMI and Nonfarm Payrolls report disappointed investors, who flock to safe-haven assets, mostly US Treasuries. The XAG/USD trades at $27.23 after hitting a daily high of $28.67.
The grey metal tumbled to a three-month high, with buyers battling to reclaim July’s low of $27.31, which would keep them hopeful of higher prices. However, momentum favors sellers, as shown by the Relative Strength Index (RSI), near hitting oversold conditions in normal trading environments.
If XAG/USD drops and achieves a daily close below $27.00, buyers will be pressured to hold forth at the 200-DMA at $26.02. If broken, sellers will drive Silver spot prices to the latest cycle low at $24.33, the March 27 low.
Conversely, if buyers reclaim $28.00, the next resistance would be the August 2 peak at $29.22. Further upside is seen once cleared, with the next supply area at the 50-DMA at $29.79
Silver is a precious metal highly traded among investors. It has been historically used as a store of value and a medium of exchange. Although less popular than Gold, traders may turn to Silver to diversify their investment portfolio, for its intrinsic value or as a potential hedge during high-inflation periods. Investors can buy physical Silver, in coins or in bars, or trade it through vehicles such as Exchange Traded Funds, which track its price on international markets.
Silver prices can move due to a wide range of factors. Geopolitical instability or fears of a deep recession can make Silver price escalate due to its safe-haven status, although to a lesser extent than Gold’s. As a yieldless asset, Silver tends to rise with lower interest rates. Its moves also depend on how the US Dollar (USD) behaves as the asset is priced in dollars (XAG/USD). A strong Dollar tends to keep the price of Silver at bay, whereas a weaker Dollar is likely to propel prices up. Other factors such as investment demand, mining supply – Silver is much more abundant than Gold – and recycling rates can also affect prices.
Silver is widely used in industry, particularly in sectors such as electronics or solar energy, as it has one of the highest electric conductivity of all metals – more than Copper and Gold. A surge in demand can increase prices, while a decline tends to lower them. Dynamics in the US, Chinese and Indian economies can also contribute to price swings: for the US and particularly China, their big industrial sectors use Silver in various processes; in India, consumers’ demand for the precious metal for jewellery also plays a key role in setting prices.
Silver prices tend to follow Gold’s moves. When Gold prices rise, Silver typically follows suit, as their status as safe-haven assets is similar. The Gold/Silver ratio, which shows the number of ounces of Silver needed to equal the value of one ounce of Gold, may help to determine the relative valuation between both metals. Some investors may consider a high ratio as an indicator that Silver is undervalued, or Gold is overvalued. On the contrary, a low ratio might suggest that Gold is undervalued relative to Silver.