The main category of Forex News.
You can use the search box below to find what you need.
[wd_asp id=1]
The main category of Forex News.
You can use the search box below to find what you need.
[wd_asp id=1]
The USD/JPY fell from a July 31 high of 153.889 to an August 5 low of 141.684 due to carry trade unwinding.
Equity and crypto market moves following the BoJ policy decision also reflected the effects of unwinding carry trades.
Multiple 2024 Fed rate cuts and a US economic recession could narrow interest rate differentials further, weakening the USD/JPY and delivering more pain to the markets.
Brookings Institution Senior Fellow Robin Brooks commented on the Yen carry trade, stating,
“Price action since Friday offers a good lens on where the Yen carry trade is concentrated. EM currencies that have been most hit are the Mexican Peso and Colombian Peso, both of which have been known to harbor lots of carry trades. South Africa and Turkey are also getting hit…”
Later in the Tuesday session, the RCM/TIPP Economic Optimism Index needs consideration.
Economists expect the Index to rise from 44.2 in July to 45.0 in August, potentially influencing the USD/JPY pairing amid US recession fears.
The Index reflects consumer views on the US economy, personal finances, inflation, and the labor market. A higher-than-expected Index would suggest increasing consumer spending, easing concerns about the economic outlook as it contributes over 60% to GDP.
Moreover, higher spending trends could fuel demand-driven inflation, reducing the need for multiple 2024 Fed rate cuts. A less dovish Fed rate path may support a USD/JPY move toward 150.
Bloomberg Chief Markets Editor David Ingles said,
“Govt bonds as a group up 8 straight days, longest streak in 4 years. Growth outlook souring, rate cuts starting to come out of the kitchen. Swaps signal 3 Fed cuts now fully priced this year. Eerily enough, last time we had an 8-day streak was when pandemic lockdowns pummeled the global economy.”
USD/JPY trends will hinge on household spending and wage growth numbers from Japan. Upbeat numbers could raise investor bets on a Q4 2024 BoJ rate hike and a USD/JPY fall below 140.
Investors should remain alert. Monitor real-time data, central bank monetary policy decisions, and expert commentary to adjust your trading strategies accordingly. Stay updated with our latest news and analysis to manage USD/JPY volatility.
The USD/JPY sat well below the 50-day and 200-day EMAs, confirming the bearish price trends.
A USD/JPY return to 145 would support a move toward 150. Furthermore, a breakout from 150 could bring the 151.685 resistance level into view.
Japan’s household spending and the RCM/TIPP Economic Optimism Index require consideration on Tuesday.
Conversely, a drop below the 143.495 support level could signal a fall to the 141.032 support level. A break below the 141.032 support could bring sub-140 into play.
The 14-day RSI at 13.96 shows the USD/JPY in oversold territory. Buying pressure may increase at the 143.495 support level.
This is not to suggest that the market is likely to look at this as a “floor in the market”, but at this point in time I do think it will lease cause a bit of hesitation. If we break down below the $2.00 level, then it’s likely that the market goes looking to the $1.90 level. I do believe that there is an opportunity here, but you need to be cautious about jumping in with a huge position right away.

Keep in mind that there is a cycle to the natural gas markets, and I am going to play this as an investment. I like the idea of buying little bits and pieces with no leverage, in order to set up for the eventual rally as we head toward the cooler temperatures later this year. That being said, you have to be very patient and wait for the market to turn things around in order to get long again, at least with any size. However, if you don’t have any leverage and are using a small position, you can build up a position that will pay you later in the year, all things being equal.
If the market were to turn around and break above the $2.20 level, then we have a situation where the market will continue to go higher, perhaps reaching toward the 200-Day EMA. While I don’t necessarily think this is completely impossible, I think it’s very unlikely at this point in time. For what it is worth, there is a lot of noise just below the $2.00 level that could keep this market somewhat buoyed.
Ready to trade daily Forex analysis? We’ve made a list of the best commodity broker platforms worth trading with.
Risk aversion hit hard financial markets at the beginning of the week, triggering volatile movements across all boards. XAU/USD plummeted to $2,364.19 ahead of Wall Street’s opening, bouncing afterwards to trade around the $2,400 mark at the time of writing, still sharply down on the day. The US Dollar surged against the battered bright metal as concerns about the United States (US) economic performance and escalating tensions in the Middle East put markets in panic mode.
On the one hand, US growth and employment-related data released last week triggered alarms about a potential recession in the world’s largest economy, up to the point that speculative interest began considering an out-of-schedule interest rate cut in the upcoming days. On the other, airstrikes between Israel and the Palestinian Hamas group led to multiple deaths over the weekend, particularly hitting schools and hospitals. Menaces of retaliation came from both sides, spurring concerns they would fall into an all-out war.
Stock markets plummeted in Asia, with the Nikkei 225 having its second-worst day ever. European and American indexes also edged lower, although things stabilized after the US released the ISM Services PMI, which surged in July to 51.4 after posting 48.8 in June. The reading also surpassed the expected 51, pouring some cold water on market concerns.
Helping Gold, government bond yields trimmed early losses after the US opening. The 10-year note Treasury yield fell to its lowest in a year, backing the case for a XAU/USD slide. The note offered as low as 3.66%, with the latter recovery towards the current 3.78% level supporting the current intraday bounce.
The daily chart for XAU/USD shows the pair met buyers around the 61.8% Fibonacci retracement of its June/July rally at around $2,366, a critical support area. However, technical indicators keep heading south, reflecting continued selling interest. Even further, the pair is developing below the 38.2% retracement of the aforementioned rally and a still bullish 20 Simple Moving Average (SMA), both located around $2,411.20.
In the near term, and according to the 4-hour chart, the case for a continued advance seems limited. Technical indicators have lost their ascendant strength below their midlines and after correcting oversold conditions, skewing the risk back to the downside. At the same time, the pair trades below the 20 and 100 SMAs, with the shorter one gaining downward traction, supporting the case for another leg south.
Support levels: 2,388.70 2,372.90 2,366.00
Resistance levels: 2,411.20 2,424.10 2,438.80
EUR/USD added to Friday’s robust comeback and briefly trespassed the psychological 1.1000 hurdle in quite a positive start to the new trading week.
The strong move higher in spot followed an equally deep retracement in the US Dollar (USD), which sent the US Dollar (USD) to levels last seen in January near the 102.00 neighbourhood.
Meanwhile, investors continued to gauge last week’s discouraging prints from the US docket vs. the likelihood that the US economy might tip into recession this year, all requiring a probable inter-meeting rate cut by the Fed as well as more interest rate reductions.
Meanwhile, stocks around the world plummeted on (exaggerated?) fears that the world’s top economy could lose traction to the point of entering recession.
Looking at the money markets, US yields rebounded on the short end of the curve while trimming some losses in the belly and the long term. In Germany, 10-year bund yields bounced off fresh lows near 2.10%.
Back to the Fed, Austan Goolsbee, President of the Chicago Fed Bank, argued on Monday that Fed rate setters must closely watch changes in the US economy to avoid being overly restrictive with interest rates. He observed that, despite weaker-than-expected employment growth, there are currently no indicators of a recession. Goolsbee also warned against overinterpreting the global stock market sell-off.
The policy divergence between the Fed and the ECB could shrink in the event of more and deeper rate cuts by the Fed. However, fresh weakness in US fundamentals has flagged risks to the view of a soft landing, mirroring a loss of momentum in the Eurozone’s recovery. This opens the door to a potentially weaker Dollar in the near term and extra gains in EUR/USD.
EUR/USD daily chart
Further north, EUR/USD’s first obstacle is the August high of 1.1008 (August 5), followed by the December 2023 top of 1.1139 (December 28).
On the downside, the next target for the pair is the 200-day SMA at 1.0827 prior to the weekly low of 1.0777 (August 1) and the June low of 1.0666 (June 26), all preceding the May low of 1.0649 (May 1).
Looking at the larger picture, the pair’s constructive bias should hold if it climbs above the critical 200-day SMA in a convincing fashion.
So far, the four-hour chart suggests renewed bullish momentum. Against it, the initial resistance is at 1.1008, ahead of 1.1139. On the flip side, initial support aligns at 1.0777, seconded by 1.0709. The relative strength index (RSI) eased to about 68.
GBP/USD closed in positive territory on Friday but failed to build preserve its recovery momentum at the beginning of the week. At the time of press, the pair was trading in the red slightly above 1.2750.
The selling pressure surrounding the US Dollar (USD) helped GBP/USD erase a portion of its weekly losses in the American session on Friday. The US Bureau of Labor Statistics (BLS) reported that Nonfarm Payrolls rose 114,000 in July. This reading missed the market expectation for an increase of 175,000 by a wide margin. Read more…
Recording a third consecutive weekly decline, the Pound Sterling (GBP) reached its lowest level in a month against the US Dollar (USD), leaving GBP/USD to battle the 1.2700 threshold.
GBP/USD remained at the losing end, despite the persistent divergent monetary policy outlooks between the US Federal Reserve (Fed) and the Bank of England (BoE), as the pair witnessed more of a risk trade rather than a rate trade. Read more…
The EUR/USD pair trades at fresh multi-month highs near the 1.1000 mark in a chaotic start to the week. Concerns about the state of the United States (US) economy hit hard the US Dollar as market players increased bets on an out-of-schedule rate cut from the Federal Reserve (Fed) as soon as next week. It seems a bit overstretched, but as expected last week, financial markets are all about sentiment and will likely remain so in the upcoming days.
Adding fuel to the fire, weekend news showed increased tensions in the Middle East. Israel responded to the latest Hamas attack and air-striked Gaza, killing at least 30 people, while Hamas’s political leader, Ismail Haniyeh, was killed in Tehran. Fears of an escalating war in the region as Iran vowed retaliation further fueled the dismal mood.
The US Dollar trades mixed, under strong selling pressure against European rivals and safe-haven currencies, but firmer against Gold amid plummeting Treasury yields, with the 10-year note offering as low as 3.67% ahead of Wall Street’s opening, a fresh 52-week low. Yields on the 2-year note also plummeted and practically match the 10-year ones.
Data-wise, the Hamburg Commercial Bank (HBOC) published the final estimates of the July PMIs for the Eurozone, with the EU Composite PMI upwardly revised to 50.2, slightly better than the previous 50.1. Additionally, the Producer Price Index (PPI) fell 3.2% YoY in June, while it rose 0.5% MoM. The readings were higher than expected but far from concerning.
The American session will bring the final July US S&P Global Services PMI and the official ISM report on non-manufacturing output.
The EUR/USD pair is sharply up for a second consecutive day and poised to extend its advance. In the daily chart, the pair has run beyond all its moving averages, while the 20 Simple Moving Average (SMA) gains upward momentum above the longer ones, yet over 100 pips below the current level. Technical indicators, in the meantime, head north within positive levels, far from reaching overbought readings and without signs of upward exhaustion.
In the near term, and according to the 4-hour chart, the bullish momentum remains strong despite technical indicators standing at extreme overbought levels. At the same time, the 20 SMA heads firmly north above the 200 SMA, although still below a pretty much flat 100 SMA. Overall, EUR/USD seems poised to storm through the 1.1000 figure in the upcoming sessions.
Support levels: 1.0960 1.0915 1.0875
Resistance levels: 1.1005 1.1040 1.1085
Silver price (XAG/USD) is down by more than 5%, skids below $28.00 in Monday’s European session. The white metal nosedives to an almost three-month low as fears of a global economic slowdown has intensified after a string of United States (US) economy data indicated that the nation is moving towards a recession.
Recent US data showed signs of slower labor demand and sheer weakness in the manufacturing sector. The US Unemployment Rate rose to its highest since November 2021 at 4.3%. Meanwhile, the Manufacturing PMI for July contracted at a faster pace to 46.8. The demand of the Silver as an metal with application in various industries, such as: Electric Vehicles, renewable energy, and wires and cables etc.
Investors have remained concerned over the Silver’s demand due to China’s economic vulnerability. The Chinese economy is going though a rough phase due to weak demand conditions in the domestic and the overseas market.
Meanwhile, a sharp decline in US bond yields and the US Dollar (USD) due to growing speculation that the Federal Reserve (Fed) will deliver a bulk rate-cut in its September meeting fails to lift the Silver price. 10-year US Treasury yields plunge to near 3.67%. The US Dollar Index (DXY), which tracks the Greenback’s value against six major currencies, plummet to more than annual low near 102.60.
Silver price weakens after discovering strong selling interest near the prior breakdown zone around $28.60. The asset has declined to near the 200-day Exponential Moving Average (EMA), which trades around $26.85, suggesting that the overall trend is uncertain.
The 14-period Relative Strength Index (RSI) slips into the 20.00-40.00 range, indicating that the overall momentum is bearish.
Silver is a precious metal highly traded among investors. It has been historically used as a store of value and a medium of exchange. Although less popular than Gold, traders may turn to Silver to diversify their investment portfolio, for its intrinsic value or as a potential hedge during high-inflation periods. Investors can buy physical Silver, in coins or in bars, or trade it through vehicles such as Exchange Traded Funds, which track its price on international markets.
Silver prices can move due to a wide range of factors. Geopolitical instability or fears of a deep recession can make Silver price escalate due to its safe-haven status, although to a lesser extent than Gold’s. As a yieldless asset, Silver tends to rise with lower interest rates. Its moves also depend on how the US Dollar (USD) behaves as the asset is priced in dollars (XAG/USD). A strong Dollar tends to keep the price of Silver at bay, whereas a weaker Dollar is likely to propel prices up. Other factors such as investment demand, mining supply – Silver is much more abundant than Gold – and recycling rates can also affect prices.
Silver is widely used in industry, particularly in sectors such as electronics or solar energy, as it has one of the highest electric conductivity of all metals – more than Copper and Gold. A surge in demand can increase prices, while a decline tends to lower them. Dynamics in the US, Chinese and Indian economies can also contribute to price swings: for the US and particularly China, their big industrial sectors use Silver in various processes; in India, consumers’ demand for the precious metal for jewellery also plays a key role in setting prices.
Silver prices tend to follow Gold’s moves. When Gold prices rise, Silver typically follows suit, as their status as safe-haven assets is similar. The Gold/Silver ratio, which shows the number of ounces of Silver needed to equal the value of one ounce of Gold, may help to determine the relative valuation between both metals. Some investors may consider a high ratio as an indicator that Silver is undervalued, or Gold is overvalued. On the contrary, a low ratio might suggest that Gold is undervalued relative to Silver.
GBP/USD closed in positive territory on Friday but failed to build preserve its recovery momentum at the beginning of the week. At the time of press, the pair was trading in the red slightly above 1.2750.
The table below shows the percentage change of British Pound (GBP) against listed major currencies last 7 days. British Pound was the weakest against the Japanese Yen.
| USD | EUR | GBP | JPY | CAD | AUD | NZD | CHF | |
|---|---|---|---|---|---|---|---|---|
| USD | -0.87% | 0.77% | -7.48% | 0.33% | 1.48% | -0.66% | -3.75% | |
| EUR | 0.87% | 1.64% | -6.65% | 1.25% | 2.43% | 0.21% | -2.89% | |
| GBP | -0.77% | -1.64% | -8.19% | -0.41% | 0.76% | -1.40% | -4.49% | |
| JPY | 7.48% | 6.65% | 8.19% | 8.40% | 9.70% | 7.37% | 4.02% | |
| CAD | -0.33% | -1.25% | 0.41% | -8.40% | 1.18% | -1.00% | -4.08% | |
| AUD | -1.48% | -2.43% | -0.76% | -9.70% | -1.18% | -2.12% | -5.20% | |
| NZD | 0.66% | -0.21% | 1.40% | -7.37% | 1.00% | 2.12% | -3.14% | |
| CHF | 3.75% | 2.89% | 4.49% | -4.02% | 4.08% | 5.20% | 3.14% |
The heat map shows percentage changes of major currencies against each other. The base currency is picked from the left column, while the quote currency is picked from the top row. For example, if you pick the British Pound from the left column and move along the horizontal line to the US Dollar, the percentage change displayed in the box will represent GBP (base)/USD (quote).
The selling pressure surrounding the US Dollar (USD) helped GBP/USD erase a portion of its weekly losses in the American session on Friday.
The US Bureau of Labor Statistics (BLS) reported that Nonfarm Payrolls rose 114,000 in July. This reading missed the market expectation for an increase of 175,000 by a wide margin. Other details of the jobs report showed that the Unemployment Rate climbed to 4.3% from 4.1% in June and the annual wage inflation softened to 3.6% from 3.8% in the same period. Following these labor market figures, markets started to price in a 50 basis points Federal Reserve (Fed) rate cut in September and caused the USD to weaken.
Over the weekend, several news outlets reported that Iran was preparing to attack Israel. Investors grow increasingly worried about a deepening conflict in the Middle East and it’s potential negative impact on markets. Early Monday, the UK’s FTSE 100 Index is down more than 2% on the day and US stock index futures lose between 1.6% and 4%, reflecting the intense flight to safety.
In the second half of the day, the ISM Services PMI data for July will be featured in the US economic docket. Investors see the headline PMI rising into the expansion territory above 51 from 48.8 in June. A disappointing PMI print could make it difficult for the USD to find demand and help GBP/USD find support. Nevertheless, the pair could struggle to gain traction unless risk mood improves in a noticeable way.
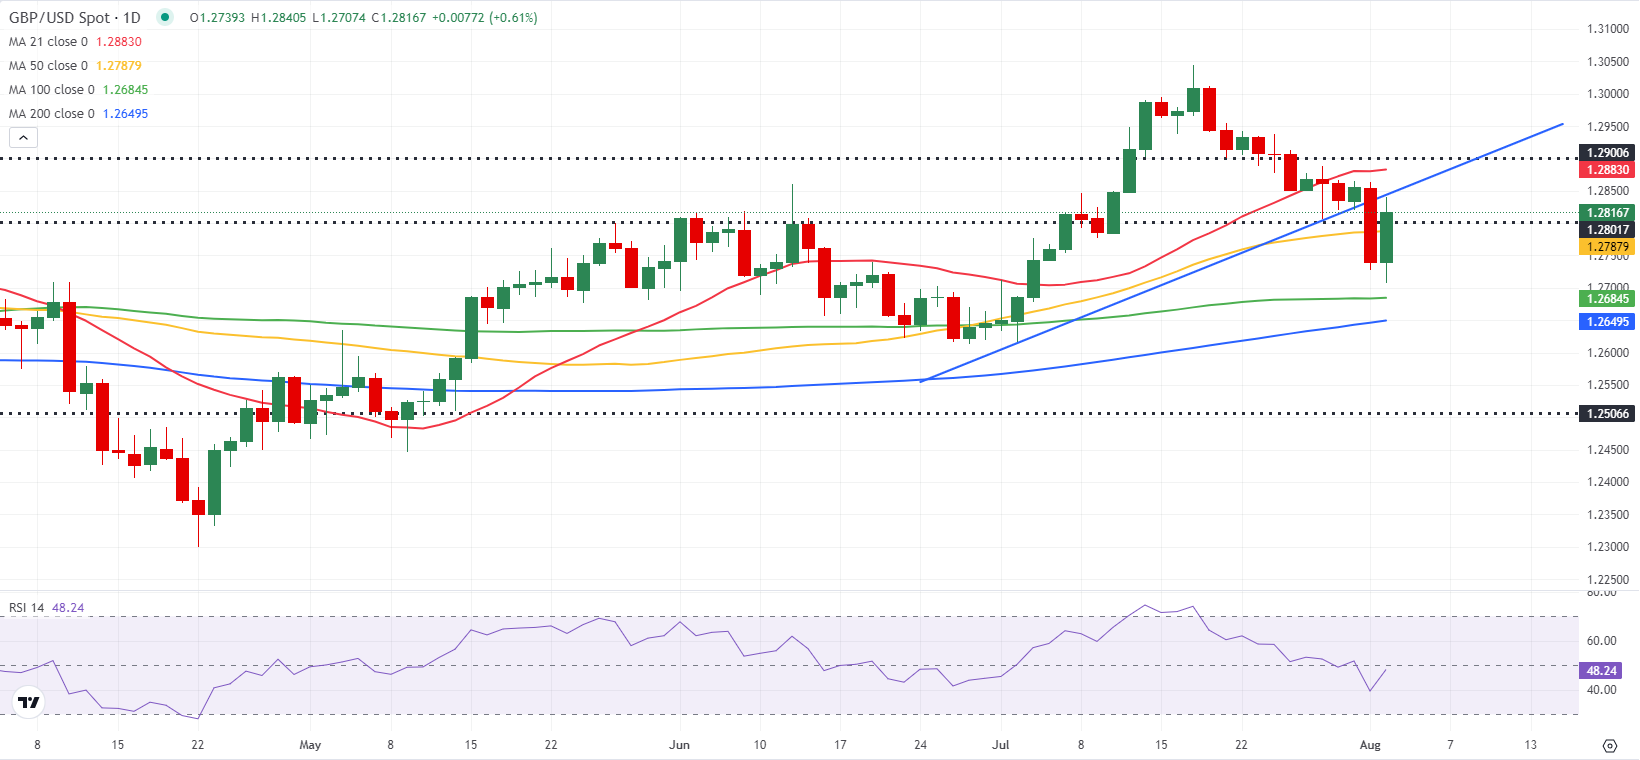
The Relative Strength Index (RSI) indicator turned south and declined below 40 after rising to 50 on Friday, suggesting that sellers look to retain control of GBP/USD’s action. A break below 1.2710-1.2700 support area, where the Fibonacci 78.6% retracement of the latest uptrend, could open the door for an extended decline toward 1.2620 (static level, beginning point of the uptrend).
On the upside, 1.2780 (Fibonacci 61.8% retracement) and 1.2800 (200-period Simple Moving Average, descending trend line) align as immediate resistance levels before 1.2830 (Fibonacci 50% retracement).
In the world of financial jargon the two widely used terms “risk-on” and “risk off” refer to the level of risk that investors are willing to stomach during the period referenced. In a “risk-on” market, investors are optimistic about the future and more willing to buy risky assets. In a “risk-off” market investors start to ‘play it safe’ because they are worried about the future, and therefore buy less risky assets that are more certain of bringing a return, even if it is relatively modest.
Typically, during periods of “risk-on”, stock markets will rise, most commodities – except Gold – will also gain in value, since they benefit from a positive growth outlook. The currencies of nations that are heavy commodity exporters strengthen because of increased demand, and Cryptocurrencies rise. In a “risk-off” market, Bonds go up – especially major government Bonds – Gold shines, and safe-haven currencies such as the Japanese Yen, Swiss Franc and US Dollar all benefit.
The Australian Dollar (AUD), the Canadian Dollar (CAD), the New Zealand Dollar (NZD) and minor FX like the Ruble (RUB) and the South African Rand (ZAR), all tend to rise in markets that are “risk-on”. This is because the economies of these currencies are heavily reliant on commodity exports for growth, and commodities tend to rise in price during risk-on periods. This is because investors foresee greater demand for raw materials in the future due to heightened economic activity.
The major currencies that tend to rise during periods of “risk-off” are the US Dollar (USD), the Japanese Yen (JPY) and the Swiss Franc (CHF). The US Dollar, because it is the world’s reserve currency, and because in times of crisis investors buy US government debt, which is seen as safe because the largest economy in the world is unlikely to default. The Yen, from increased demand for Japanese government bonds, because a high proportion are held by domestic investors who are unlikely to dump them – even in a crisis. The Swiss Franc, because strict Swiss banking laws offer investors enhanced capital protection.
Oil prices remained steady on Wednesday, with Brent crude hovering near a one-month low of $83.30 hit on Tuesday. This stability comes as weakening demand growth in China contrasts with the expected decline in U.S. oil stockpiles.
Concerns over Chinese demand weigh on sentiment, but U.S. inventory drawdowns help limit the downside. China’s economic growth slowed to 4.7% in Q2, its weakest since early 2023.
According to the economic calendar, recent data also showed that Japanese authorities spent 5.53 trillion yen to support the currency through intervention in July. Meanwhile, the Japanese government said a weaker yen could erode household purchasing power by pushing inflation higher than wage growth, highlighting the urgent need for officials to support the currency.
According to forex trading, the Japanese yen continued to strengthen against the US dollar, (USD/JPY) but it may have come at the expense of Japanese financial markets. The yen had fallen to a four-decade low before authorities intervened to support the currency. However, officials may have triggered a bear market for the country’s stock market. To end the trading week, Japan’s benchmark Nikkei 225 index fell about 6% to close Friday’s session at 35,909.70. Japan’s consumer price index recorded its worst single-day performance in March 2020, falling below 36,000 for the first time since January.
Also, Japanese government bond yields fell, with the benchmark 10-year yield falling below 1%, its lowest level in two months.
Meanwhile, financial markets in Tokyo weakened, the yen staged a dramatic reversal. Moreover, this was driven by the Bank of Japan surprising most economists by raising interest rates and planning to buy fewer bonds over the coming years. Furthermore, the decision was made after BoJ Governor Kazuo Ueda suggested that a weaker yen could raise inflationary threats and force struggling Japanese households to bear the brunt of higher prices.
Generally, investors are expecting another rate hike before the end of the year. “Today’s move supports USD/JPY’s return below 150.00. There could be further declines ahead as the BoJ supports a stronger yen to combat inflation, and as the yield spread between the US and Japan narrows further,” analysts at XTB said.
Whether this translates into further yen support remains to be seen. The US dollar has weakened amid the Federal Reserve’s signal of a September rate cut. According to electronic trading platforms, US financial markets have been falling over the past two sessions, with the technology-based Nasdaq Composite sliding into correction territory.
Meanwhile, the Japanese yen has fallen 4% against the US dollar since the start of the year. Global demand concerns for crude oil have recently outweighed supply risks from rising geopolitical tensions in the Middle East.
According to the economic calendar, data released on Friday showed that job growth in the United States slowed sharply, the unemployment rate rose to 4.3% and wage growth slowed. This comes on top of weak manufacturing data. The ISM manufacturing purchasing managers’ index revealed a larger-than-expected contraction in factory activity in the United States, while factory activity in China unexpectedly contracted, the first decline since last October.
Meanwhile, markets are closely watching Iran’s response to the assassination of Hamas leader Ismail Haniyeh, which followed the killing of Hezbollah’s top commander in an airstrike in Beirut.
According to the performance on the daily chart below, the USD/JPY is in a downward channel path and the support of 146.00 confirms the bears’ control, while at the same time moving the technical indicators towards strong oversold levels. You can buy without risk from the support levels of 145.45 and 144.00 respectively. On the other hand, over the same period of time, stability above the resistance of 152.85 will give bulls a new opportunity to control. The USD/JPY price will continue to be affected by the future policies of global central banks, in addition to the extent of investors’ appetite for risk or not.
Ready to trade our daily forex forecast? Here are the best forex brokers in Japan to choose from.