
Green tea consumption and cerebral white matter lesions in community-dwelling older adults without dementia
Study population
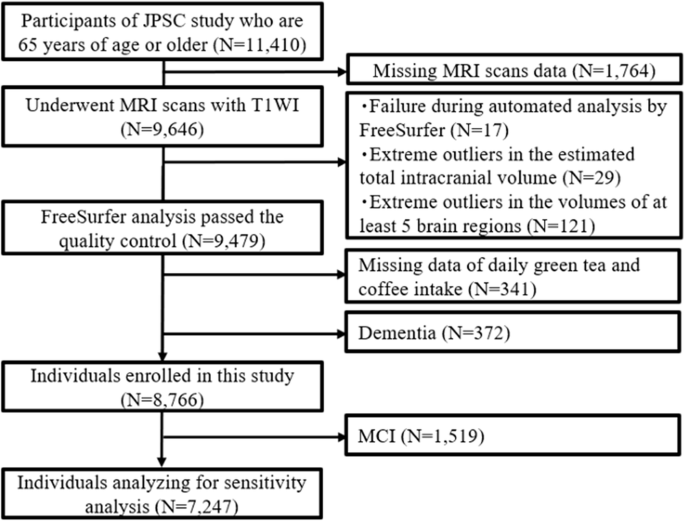
Among the 11,410 participants in the JPSC-AD study aged ≥ 65 years, 9646 underwent three-dimensional T1-weighted MRI. After excluding 167 participants who did not pass the quality control of the FreeSurfer analysis; 103 participants who did not have hippocampal measurement data; 341 participants without available data on green tea, black tea, and/or coffee intake; and 372 participants with dementia at baseline, 8766 participants were enrolled in the study (Fig. 1).
Ethical approvals and patient consents
This study was approved by the Kyushu University Institutional Review Board for clinical research (approval number 686-10) and by each of the local ethics committee of the eight research institutes: Kanazawa University (approval numbers 2185 and 437), Hirosaki University (approval number 2019-064-3), Iwate Medical University (approval number HG2020-017), Keio University School of Medicine (approval number 20160214), Matsue Medical Center (approval number H28-14), Ehime University (approval numbers 1610004 and 2210016), Kumamoto University (approval number 333), and Tohoku University (approval number 2021-1-245). This study complied with the principles outlined in the Declaration of Helsinki. Written informed consent was obtained from all participants.
Brain MRI analysis
The MRI equipment was set to T1-weighted imaging parameters according to the brain MRI protocol for the Alzheimer Disease Neuroimaging Initiative study38. Segmentation and volume measurements of cortical and subcortical brain structures, including WMLV, HV, and eTIV, were performed automatically using FreeSurfer (version 7.0; http://surfer.nmr.mgh.harvard.edu). TBV was calculated from brain segmentation volumes without ventricles. Cortical parcellation was performed using the Desikan-Killiany atlas39.
To adjust for head size, TBV, HV, and WMLV were calculated as percentages of eTIV (i.e., TBV-to-eTIV ratio (TBV/eTIV) [%], HV-to-eTIV ratio (HV/eTIV) [%], and WMLV-to-eTIV ratio (WMLV/eTIV) [%]).
Dietary survey
The daily intake of green tea and coffee was calculated based on FFQ. Dietary surveys, using a weighing and dietary recording method to measure the average intake of each food and nutrient, were performed for 4 consecutive days (three weekdays and one weekend day) over 16 days across all four seasons. The participants completed FFQ at a health center or at home and were provided with a dietary recording form, recording manual, digital weighing scale, measuring spoons, camera photography scale (standard graphic tool used in the National Health and Nutrition Survey), instant camera (for those unable to take pictures with mobiles or smartphones), and instructions on usage. Nutritional values were calculated according to the Japanese Standard Tables of Food Composition, 2015 (7th revision). The validity of the intake data was evaluated using Pearson’s correlation coefficients. The daily intake of green tea and coffee was classified into four groups: 0–200, 201–400, 401–600 and ≥ 601 ml, with one glass being approximately 200 ml.
Other risk factor measurements
Each participant completed a self-administered questionnaire collecting sociodemographic data (age, sex, and educational level), medical history (diabetes mellitus, hypertension, and past history of stroke), smoking and drinking habits, and regular exercise (defined as physical activity specifically undertaken for at least 30 min twice per week over the most recent year or longer). Completed questionnaires were reviewed by trained researchers to identify inconsistent or unanswered items. Depressive symptoms were evaluated using GDS (short form)40 cognitive function was evaluated using MMSE. The details have been previously described16. Blood pressure was measured thrice using a sphygmomanometer with intervals of at least 5 min, and the average of the three measurements was used for the analysis. Electrocardiographic abnormalities were defined as one or more of the following: left ventricular hypertrophy (Minnesota Code, 3-1), atrial flutter/fibrillation (8-3), and ST-segment depression (4-1, 2, 3). Hypertension was defined as blood pressure levels of ≥ 140/90 mmHg or the current use of antihypertensive agents. BMI (kg/m2) was used as an indicator of obesity. Serum HDL and LDL cholesterol levels were enzymatically measured17. ApoE polymorphisms were identified using a multiplex PCR-based targeted sequencing method, with two single-nucleotide polymorphisms (rs429358 and rs7412) genotyping, as previously reported41.
Statistical analyses
Clinical characteristics were evaluated using the t-test, Jonckheere-Terpstra test, chi-square test, or Mantel-Haenszel test for continuous and categorical variables. Analysis of covariance was performed to estimate and compare the multivariate-adjusted values and 95% confidence intervals (CIs) for the TBV/eTIV, HV/eTIV, and WMLV/eTIV ratios. The WMLV/eTIV ratio was transformed using a common logarithm due to its skewed distribution. The shape of the associations of daily green tea consumption levels with the geometric mean of WMLV/eTIV among older adults without dementia in the multivariable-adjusted model was examined using a general linear model with restricted cubic splines, in which knots were positioned at the 5th, 35th, 65th, and 95th percentiles (0, 300, 600, and 1500 ml/day) of daily green tea consumption.
The association between daily green tea consumption and the WMLV/eTIV ratio relative to the reference value in older adults without dementia was also analyzed using multivariate-adjusted models. The reference value was set at 200 ml/day, which corresponds to one cup of green tea.
Model 1 was adjusted for age, sex, research site, and education level. Model 2 was further adjusted for hypertension, diabetes mellitus, ApoE ε4 allele, BMI, serum LDL and HDL cholesterol levels, smoking and drinking habits, electrocardiogram abnormalities, history of stroke, depressive symptoms (GDS score), cognitive function (MMSE score), and regular exercise. Statistical significance was set at P < 0.05. All statistical analyses were performed using the SPSS software package (version 29; SPSS Inc., Chicago, IL, USA) and SAS version 9.4 (SAS Institute, Cary, NC).
After excluding 1519 participants with MCI at baseline, a sensitivity analysis was conducted for all participants. The relationship between green tea consumption and cerebral white matter lesions was also analyzed based on the presence or absence of the ApoE ε4 allele and depression.
Source link










Share this article: