
Category: Forex News, News
Natural Gas Price Forecast: Breaks Out but Awaits Confirmation Above Key Level
Bottom Satisfied with Daily Close Above 2.30
Once a bottom is satisfied with an upside breakout, plus a daily close above the signal price level, the trend should be ready to progress. Higher, being the more likely direction given the confirmation of the double bottom breakout that defines a bullish trend reversal, from down to up. When measuring the pattern and projecting forward a potential target of 2.72 is suggested. The 61.8% Fibonacci retracement is just below that level at 2.67. Together, they point to a range of potential resistance from 2.67 to 2.72.
Higher Target Starts at 2.89
A higher possible target is identified up around the downtrend line. It converges with a price zone around the 78.6% retracement at 2.89 and a previous interim swing high at 2.92. Natural gas is progressing inside a large symmetrical triangle pattern. The advance off the second bottom recently confirms the pattern.

It also strengthens the possibility of an eventual test of resistance at the top of the triangle. Once the bottom of a swing within the pattern is reversed, there is the potential to test the other side of the pattern to see if resistance is retained or determine when a bullish breakout may be occurring.
Strength Seen Relative to 200-Day MA
One bullish feature of the trend is that today’s session is likely to end with the price of natural gas closing back above the 200-Day MA, after falling below the 200-Day line for the prior couple of days. This type of price behavior shows strength. Nevertheless, the market will be watching for another advance above 2.30, followed by a daily close above that level.
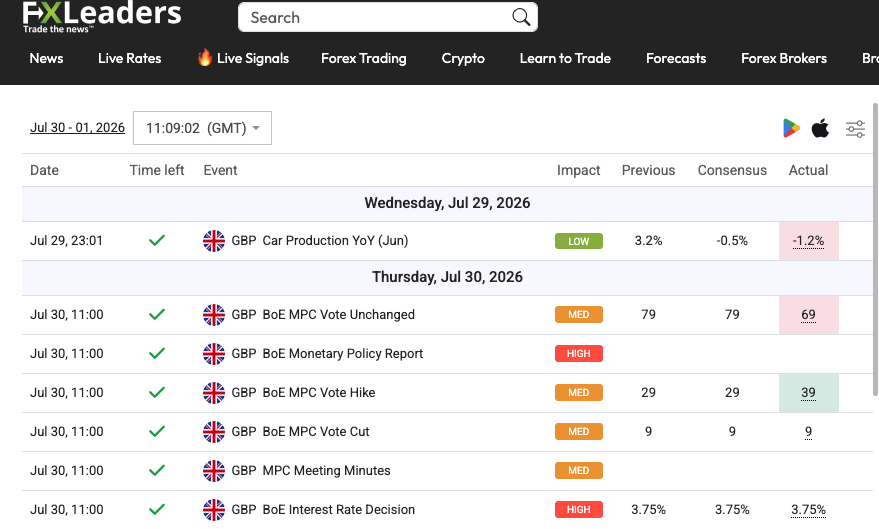
For a look at all of today’s economic events, check out our economic calendar.
Source link


Written by : Editorial team of BIPNs
Main team of content of bipns.com. Any type of content should be approved by us.


Share this article: