The main category of All News Articles.
You can use the search box below to find what you need.
[wd_asp id=1]
The main category of All News Articles.
You can use the search box below to find what you need.
[wd_asp id=1]
GBP/USD moved away from recent lows as traders took some profits off the table after the strong move. In the UK, traders focused on the GfK Consumer Confidence report for September. The report showed that Consumer Confidence improved from -14 to -13, compared to analyst forecast of -16.
If GBP/USD moves above the 1.3250 level, it will head towards the resistance at 1.3285 – 1.3300. In case GBP/USD manages to settle above 1.3300, it will move towards the 50 MA at 1.3345. RSI is in the moderate territory, so there is plenty of room to gain momentum in case the right catalysts emerge.
In Finland, the cost of a grocery basket is forecast by the research organization Pellervo Economic Research (PTT) to increase by an average of 1.5% in 2026 and 2.5% in 2027. YLE News reported this, citing PTT calculations.
PTT expects the price of coffee to rise somewhat compared with its current level. Senior agricultural economist Päivi Kujala noted that there is no upward price pressure this year, but the risks concern next year.
The El Niño weather phenomenon may affect coffee harvests in Africa and South America. If drought reduces the harvest, coffee prices will rise, Kujala explained. In Finland, coffee had become more expensive for several years, with prices peaking in 2025, when they rose by almost one-third compared with 2024. Prices later stabilized, so a similarly sharp increase is not currently forecast.
More current news is available on the UA.News Telegram channel Telegram.
According to PTT’s assessment, beef prices in Finland will remain high but will not rise further. Due to the high cost of beef, consumers are more often choosing chicken and pork; analysts expect this trend to continue.
Kujala said there had been pressure to raise beef producers’ prices in order to offset rising production costs. At the same time, PTT forecasts that both producer prices and retail prices will remain at their current levels. Food prices are also partly affected by the war in the Middle East, which raises the cost of energy and fertilizers and, accordingly, food production costs.
Read us on

Download our app


The article covers the following subjects:
Consider short positions from corrections below the level of 1.1496 with a target of 1.1120–1.0895.
Breakout and consolidation above 1.1496 will allow the pair to continue rising to the levels of 1.1790–1.2088.
On the weekly time frame, an ascending wave of larger degree B is developing, with wave (A) of B forming as its part. On the daily time frame, the third wave 3 of (A) is apparently unfolding. Within it, wave i of 3 has formed and a downward corrective wave ii of 3 is unfolding. Wave (c) of ii is developing on the H4 time frame, with the third wave of smaller degree iii of (c) developing inside. If the presumption is correct, EUR/USD will continue to decline to the levels of 1.1120–1.0895. The level of 1.1496 is critical in this scenario. A breakout above it will allow the pair to continue rising to the levels of 1.1790–1.2088.
This forecast is based on the Elliott Wave Theory. When developing trading strategies, it is essential to consider fundamental factors, as the market situation can change at any time.
The content of this article reflects the author’s opinion and does not necessarily reflect the official position of LiteFinance broker. The material published on this page is provided for informational purposes only and should not be considered as the provision of investment advice for the purposes of Directive 2014/65/EU.
According to copyright law, this article is considered intellectual property, which includes a prohibition on copying and distributing it without consent.
The major support zone is $4,319.61 to $4,230.51. It has been tested successfully three times since early September. The first resistance zone is $4,384.59 to $4,405.59. Sitting inside this zone is the main top at $4,399.67.
Trader reaction to the resistance cluster at $4,317.93 to $4,319.61 is likely to set the tone on Friday. A sustained move over $4,319.61 could generate the upside momentum needed to challenge $4,384.59 to $4,405.59. A sustained move under the 50-day MA would indicate that sellers are still in control with $4,230.51 the next potential target.
Gold has buyers after a third successful test of the support zone since early September. The 50-day at $4,317.93 and the 50% level at $4,319.61 are sitting directly above the market. That cluster is where Friday’s session gets decided.
The dollar eased Friday but is still up more than 1% for the week with back-to-back weekly gains. Treasury yields are off Thursday’s highs without reversing the move. Crude is lower on the Hormuz-talks headline. Gold is bouncing on the combination. University of Michigan and durable-goods data are the next inputs. The bond market has been repricing on strong numbers all week. Friday’s data tells the market whether the repricing continues or the week ends with a pause.
If you’d like to know more about how to trade gold, please visit our educational area.
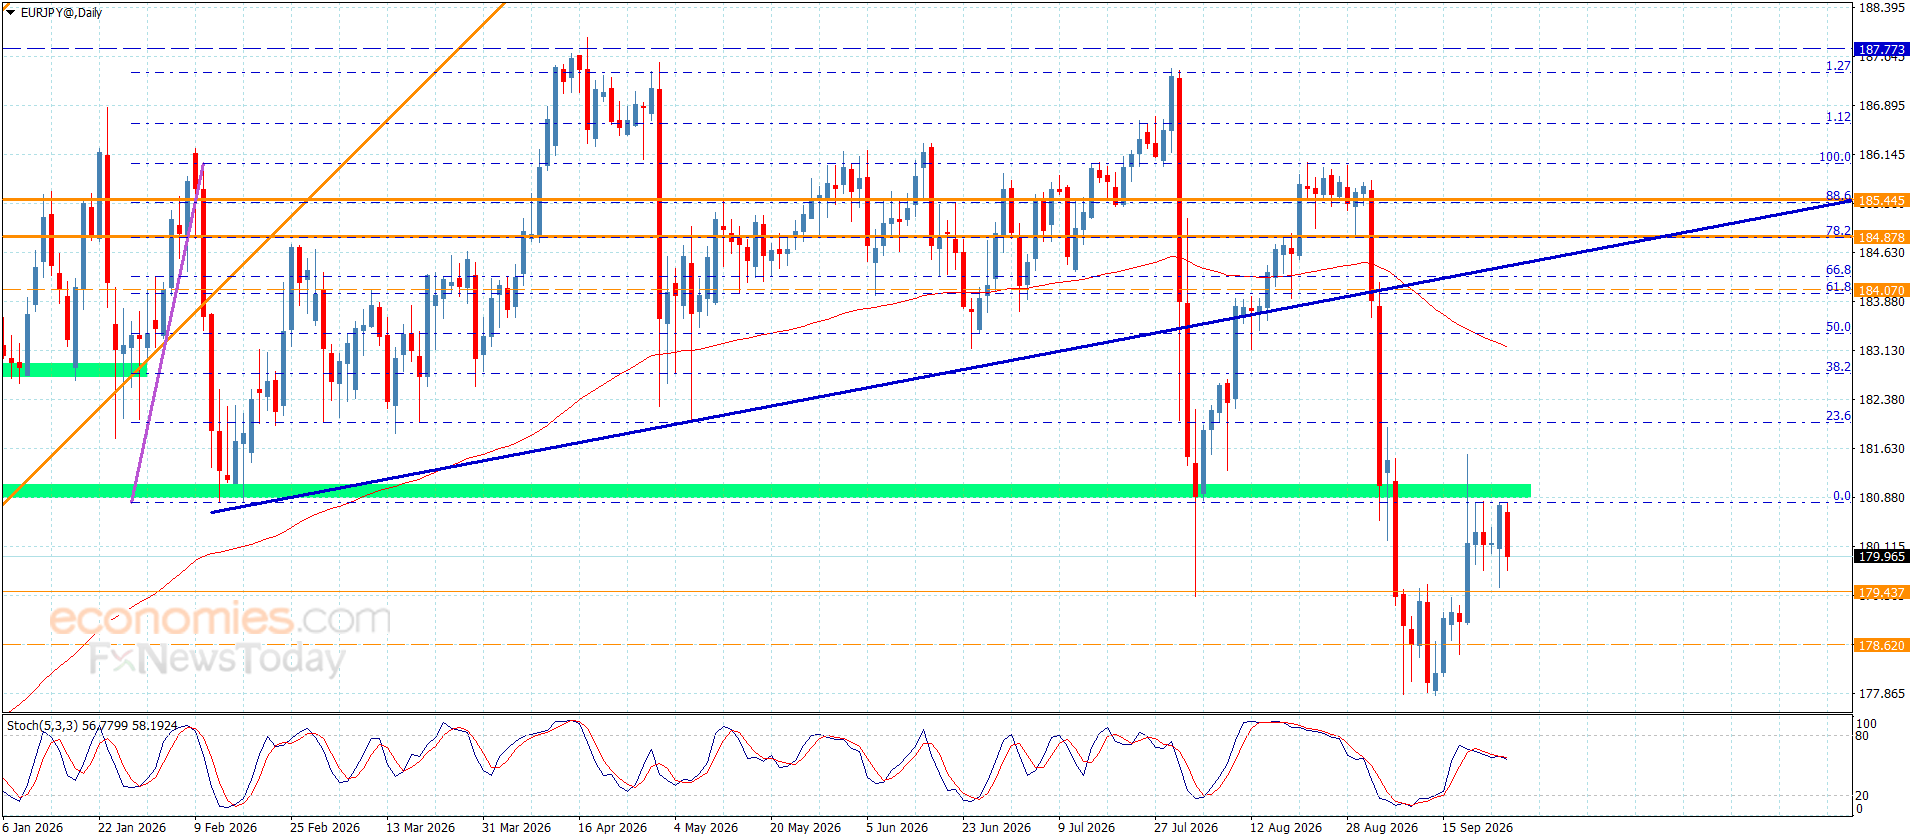
EURJPY saw some mixed trading yesterday; however, its repeated stability below the barrier at 180.80 confirms the bearish path, with the pair currently slipping toward 179.75. Moreover, the continued alignment of the main indicators in providing negative momentum will increase the chances of resuming the bearish attack, with expectations of renewed pressure on the barrier at 179.45. Breaking below this level would pave the way for additional bearish targets at 178.60 and 177.80, respectively.
The expected trading range for today is between 178.60 and 180.80
Trend forecast: Bearish
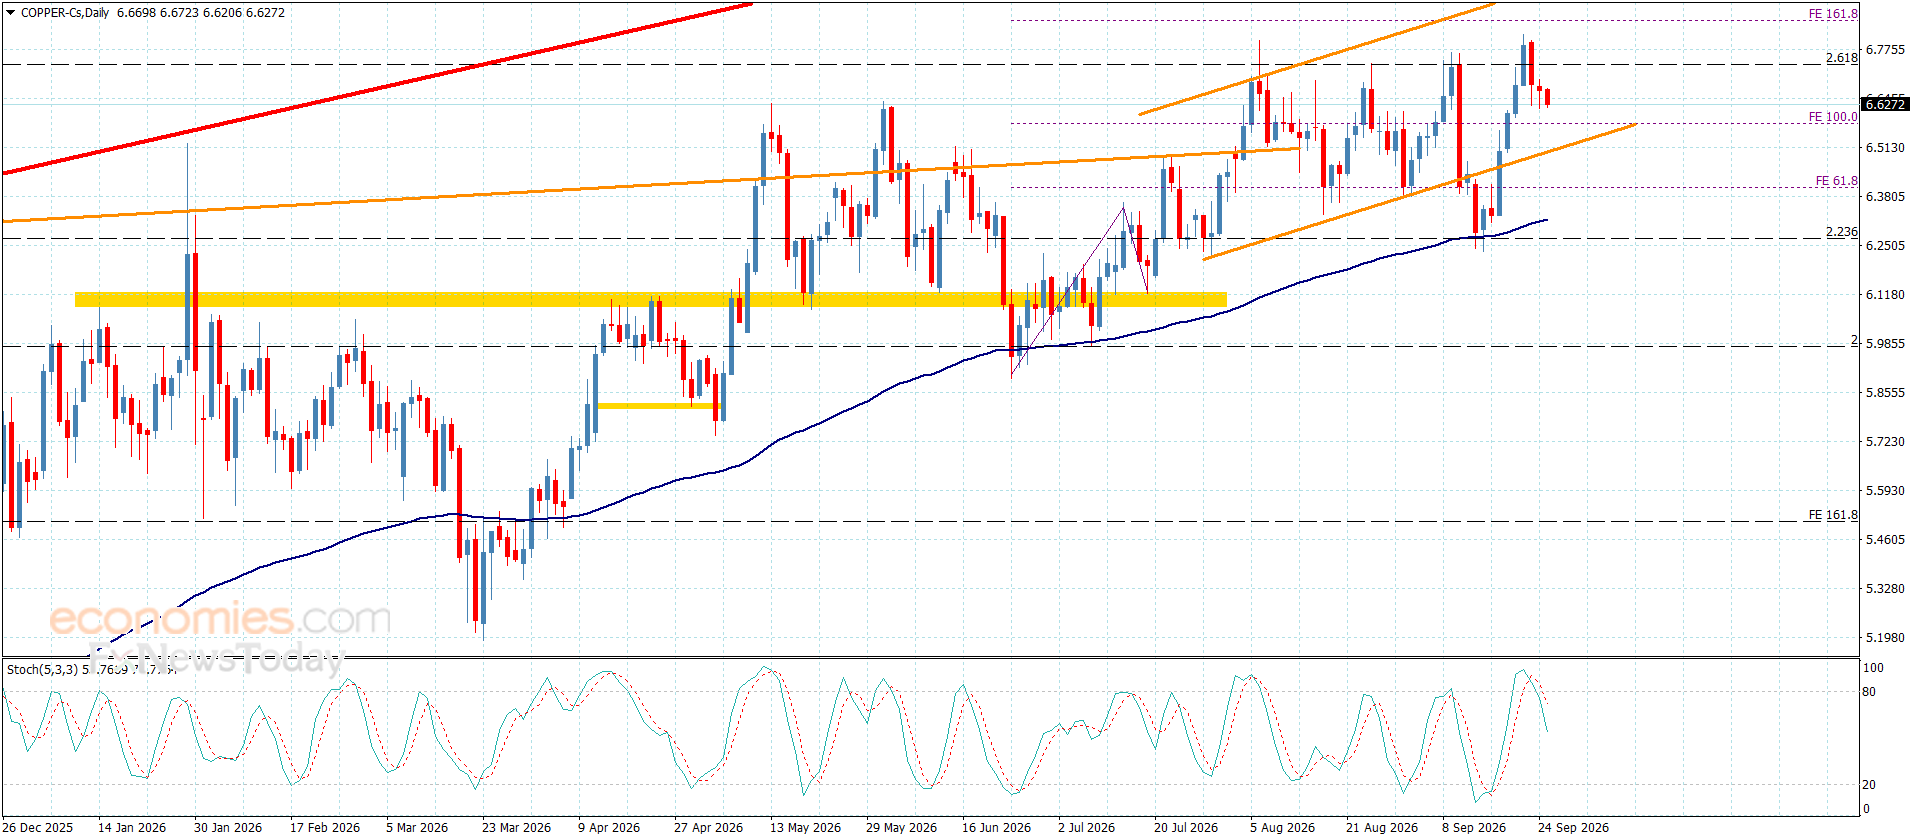
Copper price continues to lack positive momentum, as it posts further negative closes below the established barrier at $6.7400, forcing it to incur some losses and slip toward $6.6200.
The continued conflict between the main indicators confirms that the price is currently succumbing to a temporary corrective path, increasing the chances of slipping toward the additional support extending to $6.5100. Meanwhile, breaking above the barrier and holding above it would increase the chances of recording further gains, potentially starting at $6.9300.
The expected trading range for today is between $6.5100 and $6.7500
Trend forecast: Fluctuating
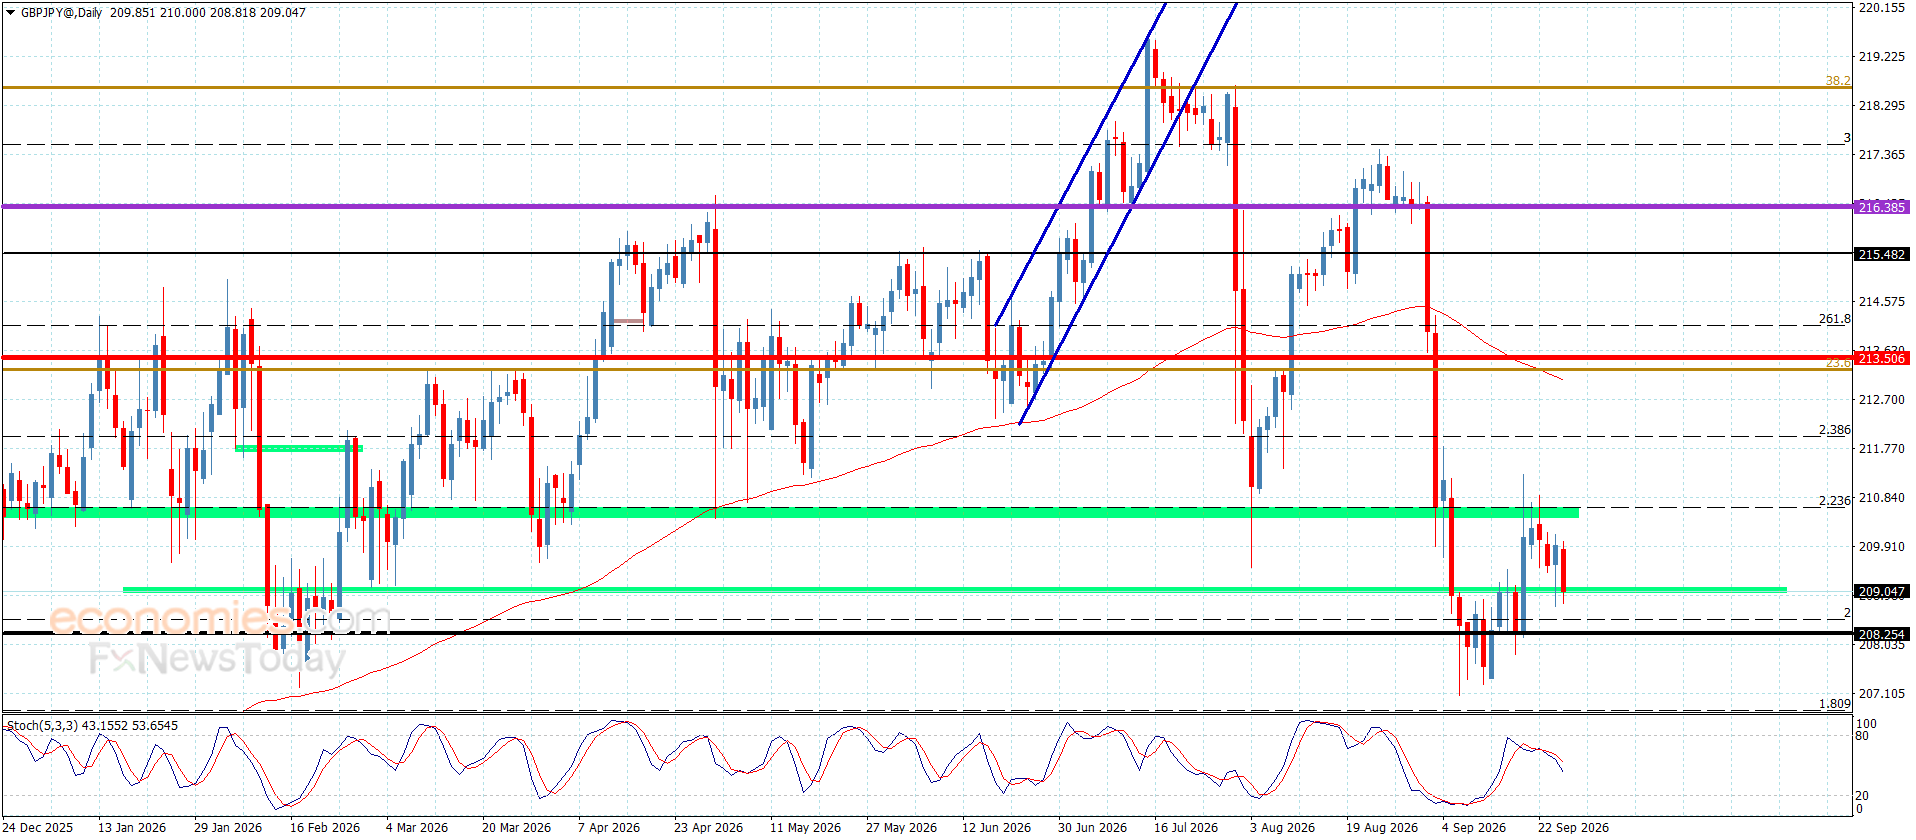
GBPJPY remains affected by the stability of the barrier near 210.40, prompting the pair to form some negative trades and currently target the 208.80 level. We note that the availability of negative momentum will increase the chances of soon attacking the additional support at 208.10, which, if broken, would push the pair to resume its bearish pressure, directly targeting 207.40 and then 206.80.
Meanwhile, failure to break below 208.10 would force the pair into mixed trading, with an opportunity to renew pressure on the barrier at 210.40, which in turn represents the key level for confirming the expected direction of trading in the near and medium term.
The expected trading range for today is between 208.10 and 210.00.
Trend forecast: Bearish
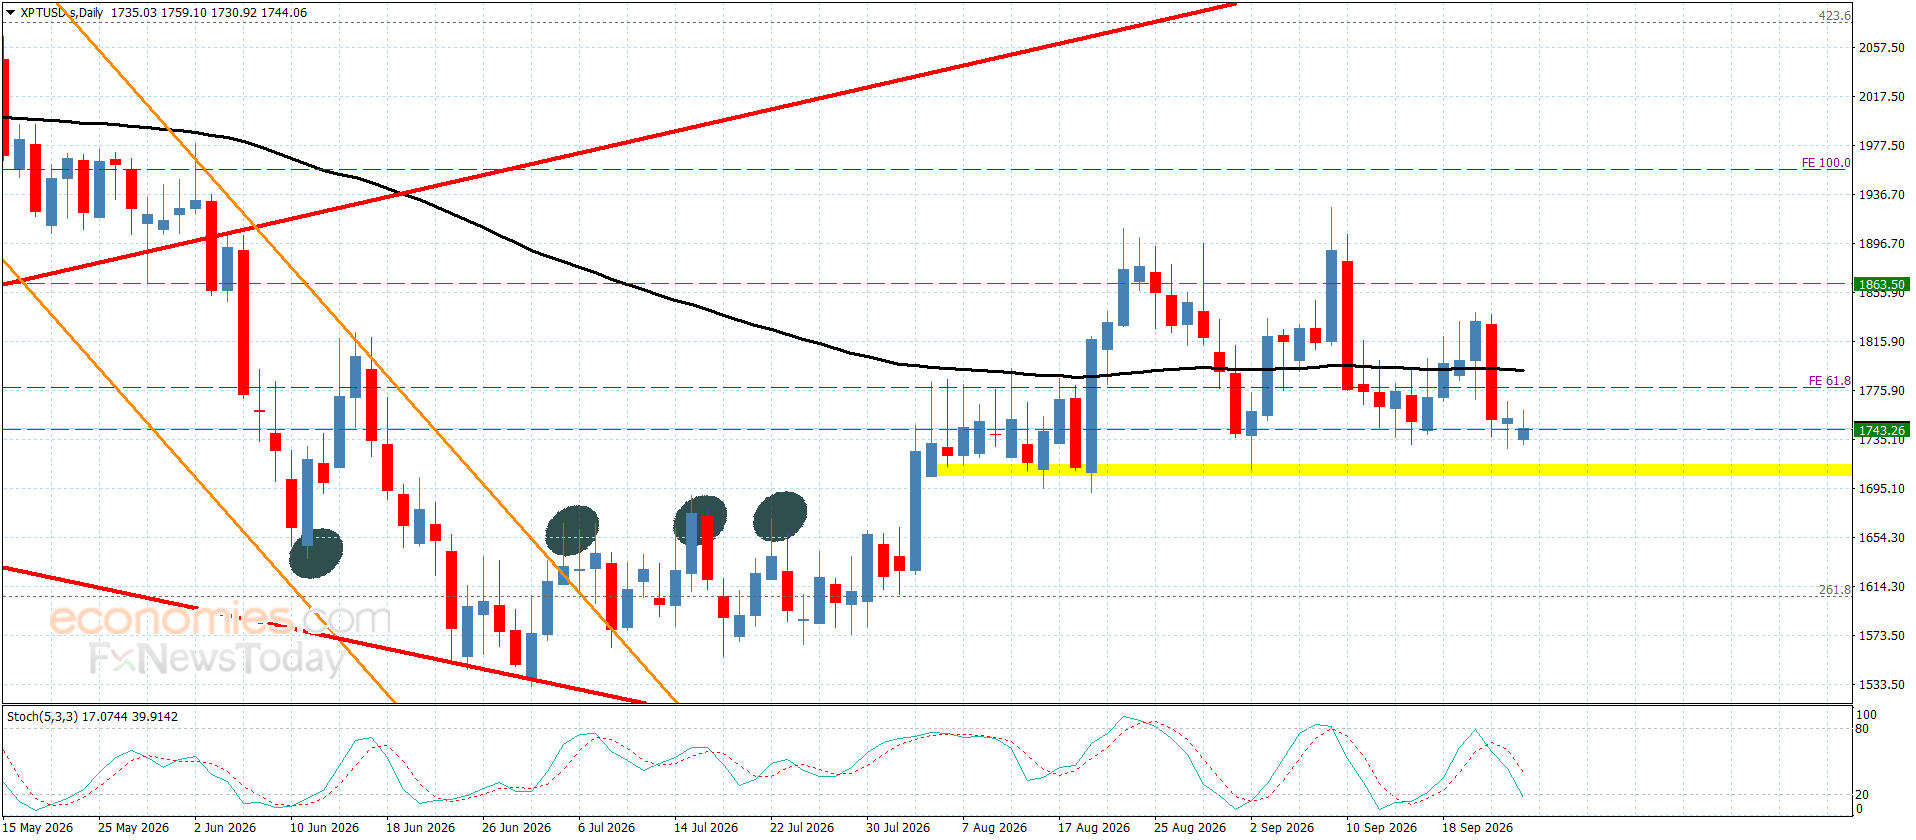
Platinum price remains affected by negative pressure, driven by the main indicators aligning to provide additional negative momentum, while the $1,840.00 level continues to form a strong barrier against recent attempts, prompting the price to resume its negative fluctuations and stabilize near $1,740.00.
We expect the price to continue moving sideways; however, its continued stability above the support at $1705.00 may give it an opportunity to renew its bullish attempts, pushing toward $1790.00 before resuming pressure on the aforementioned barrier.
The expected trading range for today is between $1710.00 and $1775.00
Trend forecast: Bullish
EUR/JPY has pared back its recent gains from the previous day, trading around 180.10 during Asian hours on Friday. Technical analysis of the daily chart shows that the currency cross continues to trade within a descending channel pattern, pointing to a persistent bearish outlook.
The EUR/JPY cross is retaining a bearish near-term bias as it holds below the 50-day Exponential Moving Average (EMA). Price sits directly on the nine-day EMA, turning it into a short-term pivot, while the 14-day Relative Strength Index (RSI) at 42.47 remains below the neutral 50 mark, which suggests lingering downside pressure rather than a decisive recovery.
The EUR/JPY cross is testing the immediate support at the nine-day EMA of 180.12. A successful break below the short-term price average would reinforce the bearish bias and put downward pressure on the currency cross to navigate the region around the lower boundary of the descending channel at 177.00, followed by an 11-month low of 175.70, recorded in November 2025.
On the upside, a rebound above the nine-day EMA could cause the bullish reversal and support the currency cross to test the 50-day EMA at 182.31. Further resistance lies at the upper boundary of the descending channel around 184.80, followed by the all-time high of 187.95 set on April 17.
(The technical analysis of this story was written with the help of an AI tool. Know more.)
The table below shows the percentage change of Euro (EUR) against listed major currencies today. Euro was the weakest against the Japanese Yen.
| USD | EUR | GBP | JPY | CAD | AUD | NZD | CHF | |
|---|---|---|---|---|---|---|---|---|
| USD | 0.09% | 0.06% | -0.27% | 0.07% | -0.02% | 0.17% | 0.17% | |
| EUR | -0.09% | -0.03% | -0.36% | -0.01% | -0.10% | 0.07% | 0.07% | |
| GBP | -0.06% | 0.03% | -0.33% | 0.02% | -0.06% | 0.11% | 0.11% | |
| JPY | 0.27% | 0.36% | 0.33% | 0.37% | 0.26% | 0.45% | 0.44% | |
| CAD | -0.07% | 0.01% | -0.02% | -0.37% | -0.11% | 0.08% | 0.08% | |
| AUD | 0.02% | 0.10% | 0.06% | -0.26% | 0.11% | 0.18% | 0.18% | |
| NZD | -0.17% | -0.07% | -0.11% | -0.45% | -0.08% | -0.18% | 0.00% | |
| CHF | -0.17% | -0.07% | -0.11% | -0.44% | -0.08% | -0.18% | -0.00% |
The heat map shows percentage changes of major currencies against each other. The base currency is picked from the left column, while the quote currency is picked from the top row. For example, if you pick the Euro from the left column and move along the horizontal line to the US Dollar, the percentage change displayed in the box will represent EUR (base)/USD (quote).
Disclaimer: For information purposes only. Past performance is not indicative of future results.
Coffee (KC) is trading at USX276.45, showing a slight gain for the day. The price holds above its short-term moving averages while remaining below medium- and long-term trend measures.
Real-time Data
15:00
278.80

Technical buying emerged in the coffee futures market after pronounced weakness over the previous three weeks, according to Inkl. The renewed participation followed a period of steep declines, positioning market activity for a short-term response to previous selling. This rotation in sentiment reflects ongoing sensitivity to technical factors influencing trading volumes.
The MA-20 at USX275.61 sits just below the current price, while the MA-50 at USX282.03 and MA-200 at USX306.4 remain overhead as key resistance levels. The Ichimoku Kijun at USX277.6 provides immediate resistance. Momentum indicators are mixed: MACD signals strong sell, ADX points to sell, and RSI at 47.36 remains in bearish territory. Stochastic RSI and Bull/Bear Power indicate overbought conditions, while CCI and Awesome Oscillator remain neutral. Intraday volatility is moderate and price is trading mid-range for the session, with technical signals diverging between overbought readings and persistent selling pressure.
Looking ahead, Coffee is expected to consolidate between USX270.37 and USX282.53, a typical volatility band relative to current levels. An upside scenario would require a breakout above the Ichimoku Kijun at USX277.6, potentially targeting the upper end of the range near USX282.53. Alternatively, failure to hold support may trigger further downside toward USX270.37, with the probability of such a move currently assessed at 71%.
Earlier, analysts noted that coffee futures were exhibiting strong downside momentum with elevated risk for further declines. The current analysis confirms that prevailing bearish signals remain in place, and traders should monitor the USX277.6 Ichimoku Kijun level as a pivot for potential near-term direction.