The main category of All News Articles.
You can use the search box below to find what you need.
[wd_asp id=1]
The main category of All News Articles.
You can use the search box below to find what you need.
[wd_asp id=1]
Natural gas price returned to provide weak sideways trading by its fluctuating near $3.080 level, affected by the stability of the barrier at $3.150, which obstructs the chances of resuming the previously suggested bullish trend.
We will depend on the attempt of forming extra support at $2.9000 level, note that stochastic reach to the overbought level makes us wait for breaching the current barrier, to open the way for recording extra gains that might begin from $3.350 reaching $3.520 level.
The expected trading range for today is between $2.900 and $3.350
Trend forecast: Sideways
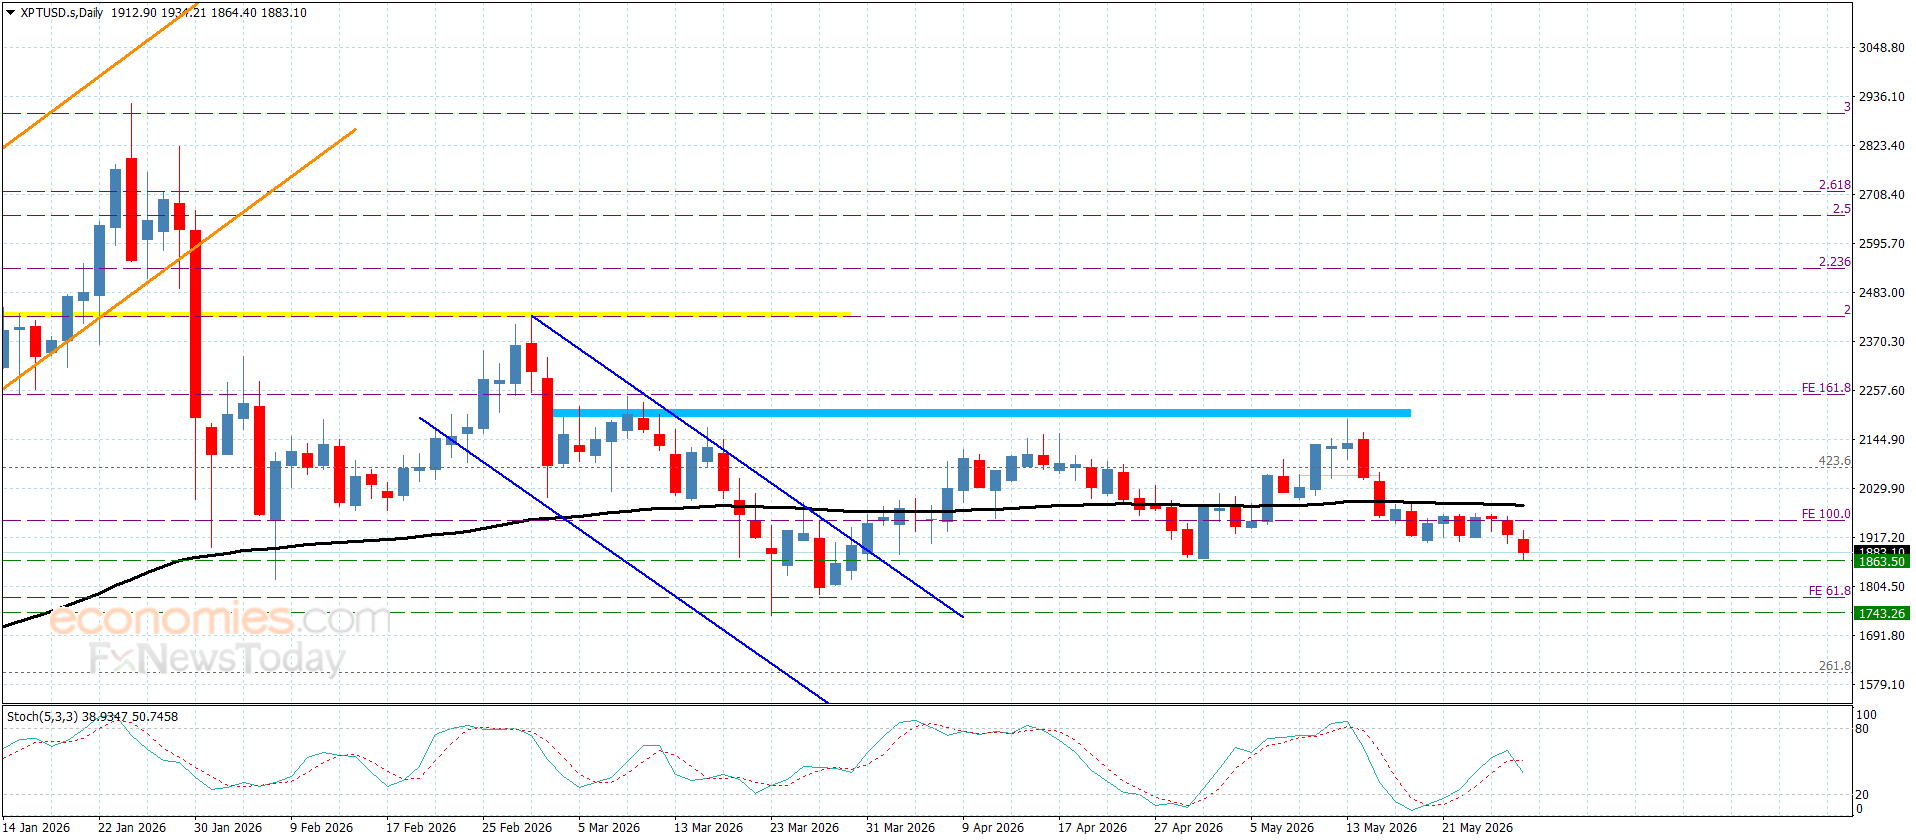
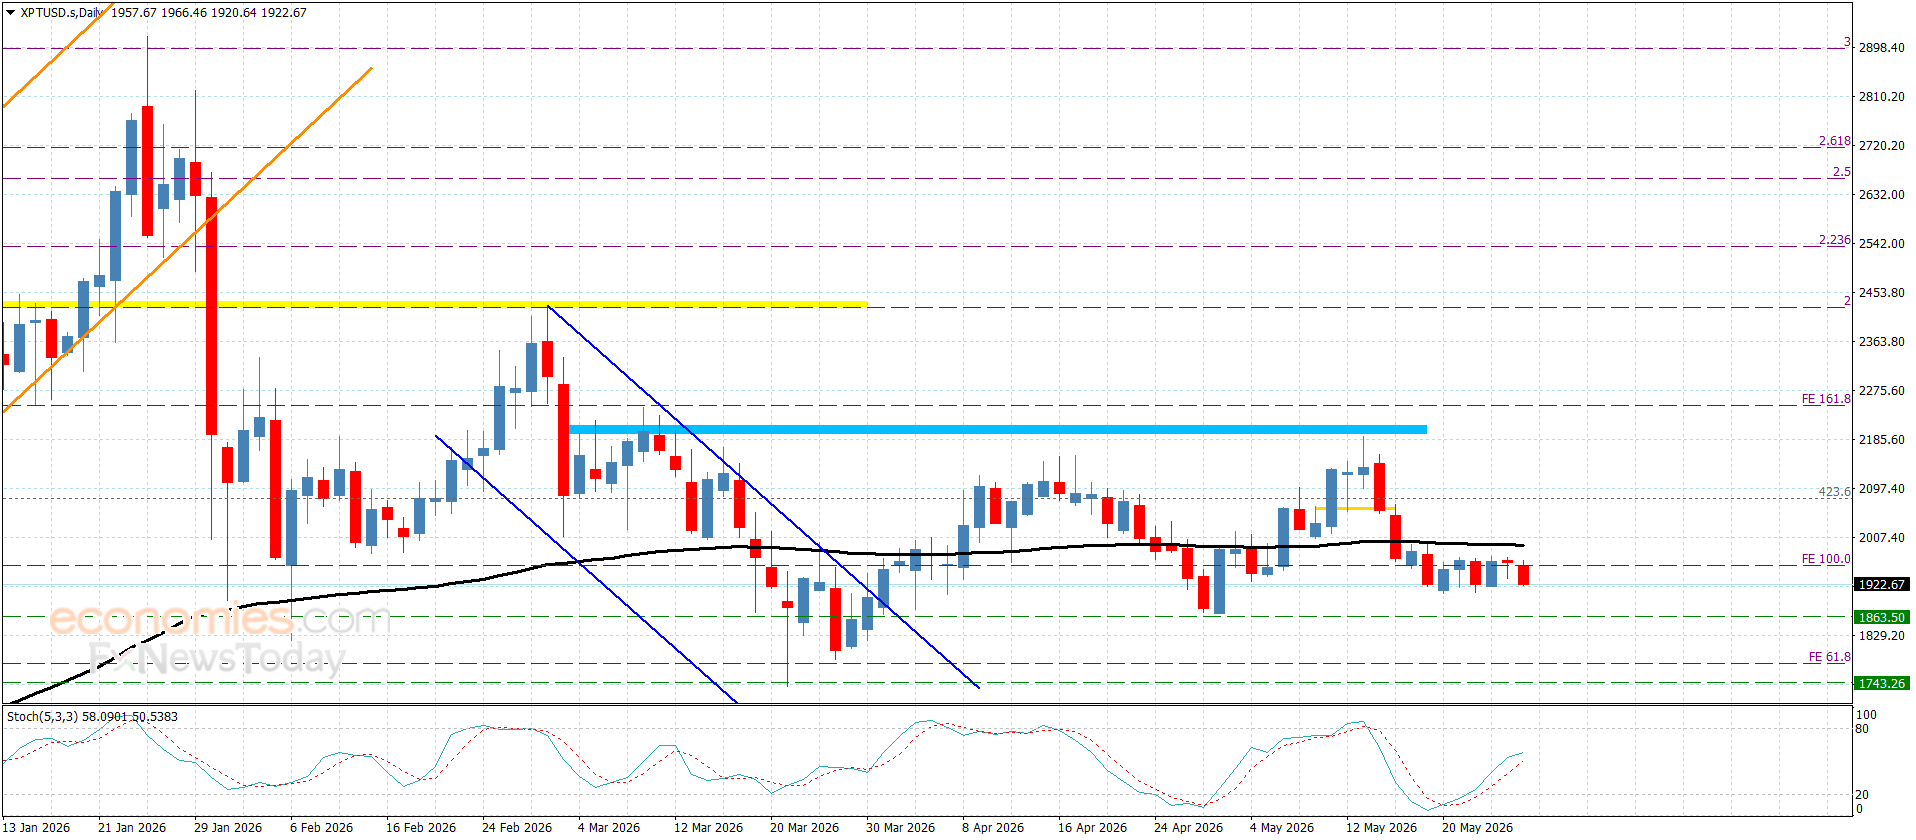
Platinum price formed more of the bearish corrective trading, affected by providing negative momentum by the main indicators, reaching the initial target at $1865.00, which represents an extra support against the negative trading.
The suggested scenario depends on the strength of the current support, as holding above it will increase the chances of forming bullish waves, to attempt to reach $1960.00, to attack the moving average 55 at $2000.00, while the decline below the support and providing negative close will force it to suffer extra losses by reaching $1805.00 and $1775.00.
The expected trading range for today is between $1865.00 and $1950.00
Trend forecast: Bullish
Platinum price formed more of the bearish corrective trading, affected by providing negative momentum by the main indicators, reaching the initial target at $1865.00, which represents an extra support against the negative trading.
The suggested scenario depends on the strength of the current support, as holding above it will increase the chances of forming bullish waves, to attempt to reach $1960.00, to attack the moving average 55 at $2000.00, while the decline below the support and providing negative close will force it to suffer extra losses by reaching $1805.00 and $1775.00.
The expected trading range for today is between $1865.00 and $1950.00
Trend forecast: Bullish
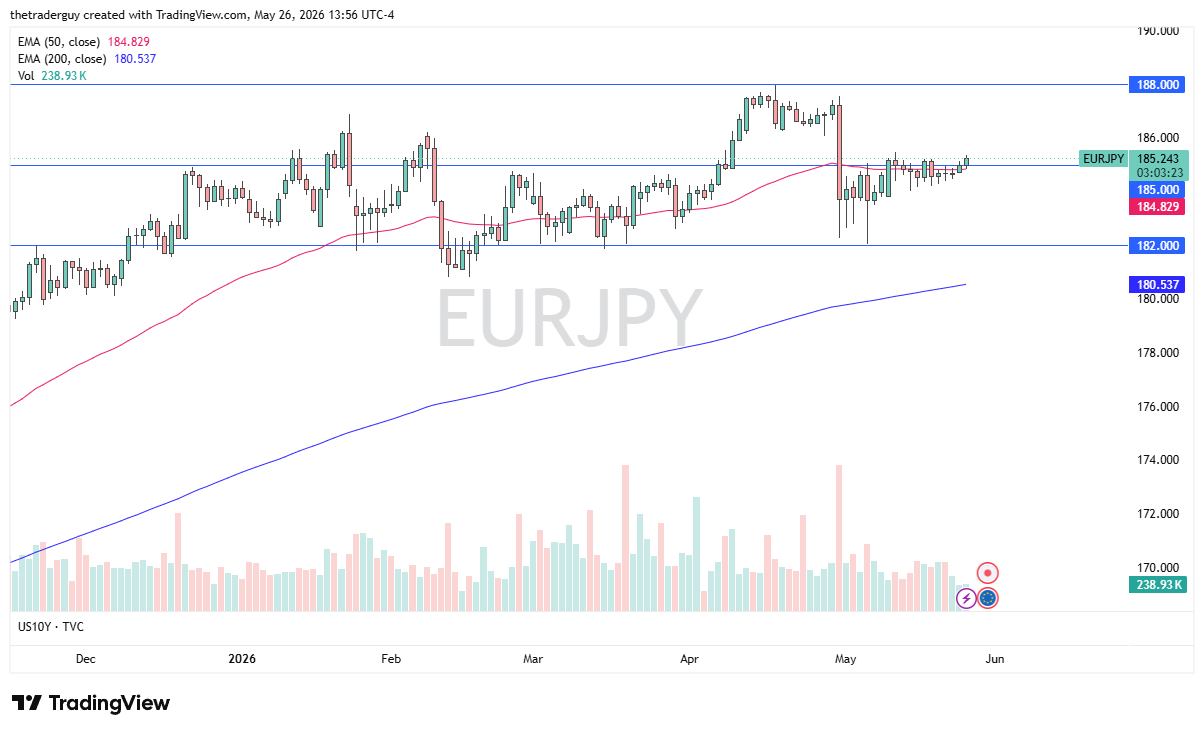
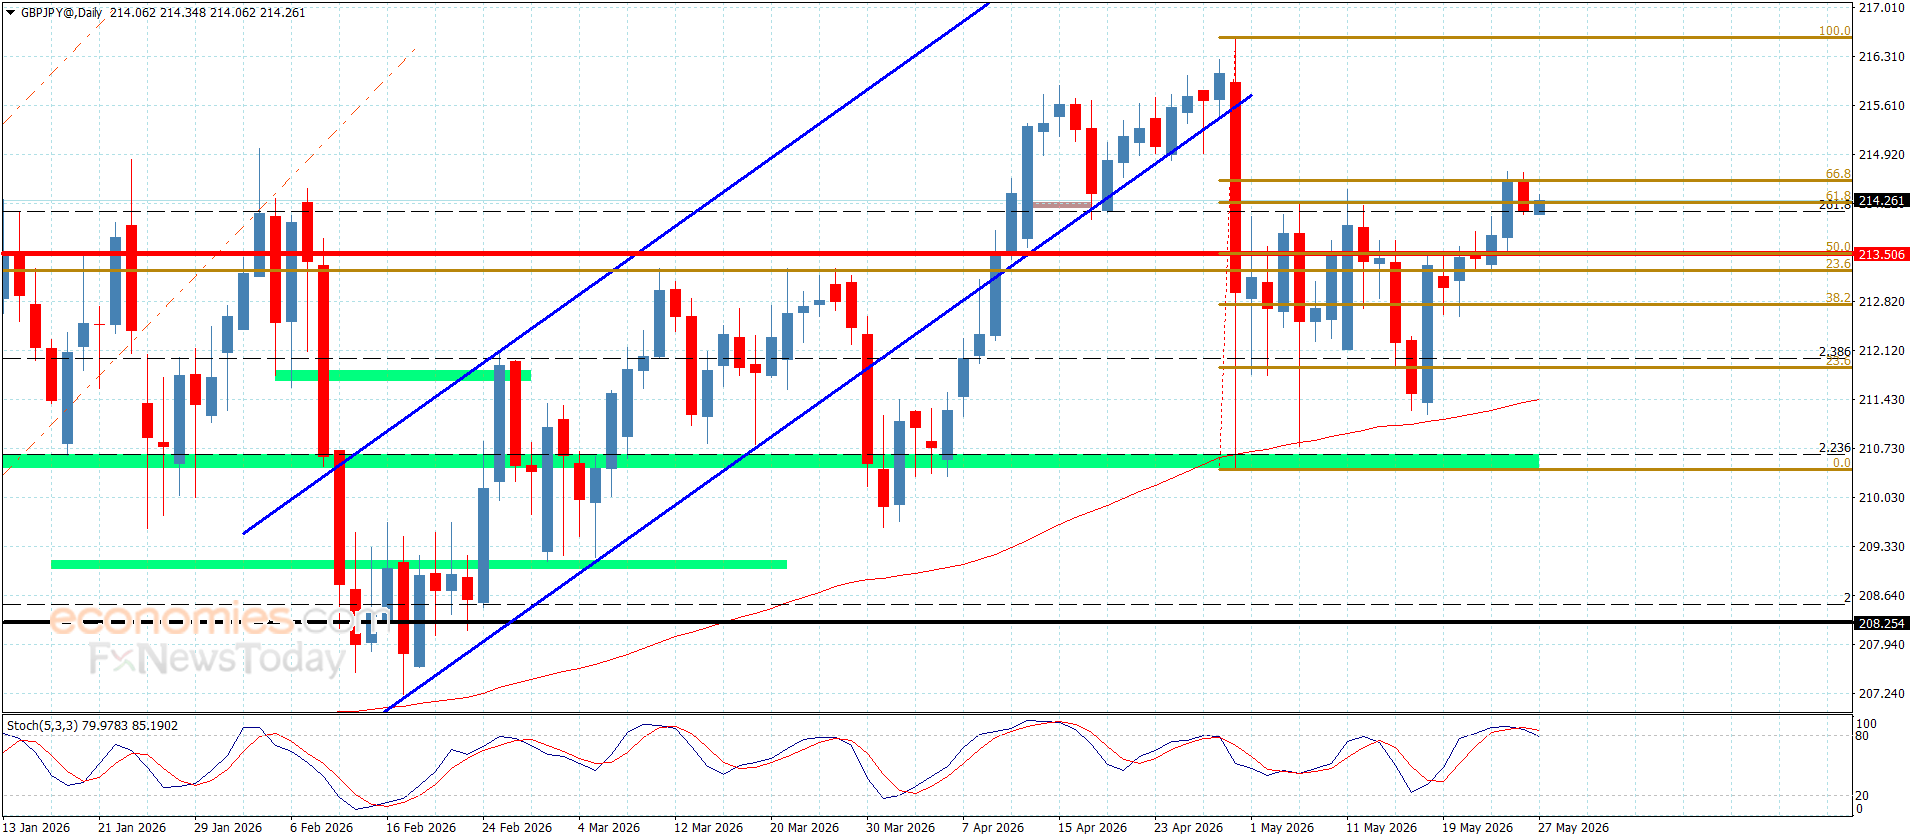
The Euro rallied a bit early during the trading session on Tuesday as we are above the 185 Yen level.
The 185 Yen level is a large round psychologically significant figure that is also backed up by the 50-day EMA to offer support.
The EUR/JPY market is likely to go looking towards higher levels at this point. We continue to see buyers come in and try to take advantage of these dips. If we were to fall lower from here, then the 183.50 level would be an area that we need to watch as well.

All things being equal, keep in mind that the interest rate differential will favor the Euro, and of course, the Bank of Japan may have a little bit of wiggle room because inflation looks like it is slowing down in Japan. But at the same time, they did intervene a few weeks ago, so I think the upside might be somewhat protected as well.
I think maybe somewhere around the 187.50 Yen level you would have to be cautious because of the market memory there and the possibility that the Japanese get involved, although the real trigger would probably be how the US dollar is trading against the Yen.
But nonetheless, we have a situation where I think you’ve got some upside here, probably for several days once we break out, but it might be somewhat limited because of that previous action. Ultimately, I have no interest in shorting this market. I think we’ve got a situation where the buyers win out.
Begin trading our daily forecasts and analysis. Here is a list of Forex brokers in Japan to work with.
Christopher Lewis has been trading Forex and has over 20 years experience in financial markets. Chris has been a regular contributor to Daily Forex since the early days of the site. He writes about Forex for several online publications, including FX Empire, Investing.com, and his own site, aptly named The Trader Guy. Chris favours technical analysis methods to identify his trades and likes to trade equity indices and commodities as well as Forex. He favours a longer-term trading style, and his trades often last for days or weeks.
As seen on: Pairs Of Aces Podcast,The Trader Guy, FXEmpire
This report is an independent strategic category study of the market for caffeine free instant coffee in the United Kingdom. It is designed for brand owners, general managers, category leaders, trade-marketing teams, e-commerce teams, retail partners, distributors, investors, and market entrants that need a clear read on where growth sits, which brands control the category, how pricing and promotion shape demand, and which channels matter most for scale and margin.
The framework is built for consumer goods category markets within consumer goods, where performance is driven by need states, shopper missions, brand hierarchies, price-pack architecture, retail execution, promotional intensity, and route-to-market control rather than by a narrow technical specification alone. It defines caffeine free instant coffee as A soluble coffee product that delivers the taste and ritual of coffee without caffeine, designed for convenience and specific consumer health or lifestyle needs and maps the market through category boundaries, consumer segments, usage occasions, channel structure, brand and private-label positions, supply and availability logic, pricing and promotion mechanics, and country-level commercial roles. Historical analysis typically covers 2012 to 2025, with forward-looking scenarios through 2035.
This report is designed to answer the questions that matter most to brand, category, channel, and strategy teams in consumer-goods markets.
At its core, this report explains how the market for caffeine free instant coffee actually works as a consumer category. It is built to show where demand comes from, which need states and shopper missions matter most, which brands and private-label players shape the category, which channels control visibility and conversion, and where pricing power, repeat purchase, and margin are actually created.
Rather than framing the category through narrow technical attributes, the study breaks it into decision-grade commercial layers: product format, benefit platform, shopper segment, purchase occasion, pack-price architecture, channel environment, promotional intensity, route-to-market control, and company archetype. It is therefore useful both for teams shaping portfolio strategy and for teams executing growth through Household Grocery Shopper, Procurement Manager (Office/Hotel), E-commerce Consumer, and Private Label Retailer Buyer.
The report also clarifies how value pools differ across Quick home brewing, Office pantry staple, Travel convenience, and Foodservice portion control, how premiumization and private label reshape category economics, how retail concentration and route-to-market design affect scale, and which countries matter most for brand building, sourcing, packaging, and channel expansion.
The report is based on an independent market-intelligence methodology that combines category reconstruction, public company evidence, retail and channel mapping, pricing review, and multi-layer triangulation. It is built for consumer categories where no single public dataset captures the real structure of demand, brand power, promotion, and channel control.
The evidence stack typically combines company disclosures, investor materials, brand and retailer product pages, e-commerce assortment checks, packaging and claims analysis, public pricing references, trade statistics where relevant, regulatory and labeling guidance, and observable route-to-market evidence from distributors, retailers, merchandisers, and marketplace ecosystems.
The analytical model then reconstructs the category across the layers that matter commercially: category scope, shopper need states, consumer segments, pack-price ladders, brand and private-label hierarchy, channel power, promotional intensity, route-to-market design, and country role differences.
Special attention is given to Health-conscious avoidance of caffeine, Convenience and speed of preparation, Price sensitivity vs. fresh coffee, Growing decaf preference among younger demographics, and Shelf-stable pantry stocking. The objective is not only to size the market, but to explain where value pools sit, which segments drive mix and repeat purchase, which channels shape growth, and how leading brands defend or expand their positions across Household Grocery Shopper, Procurement Manager (Office/Hotel), E-commerce Consumer, and Private Label Retailer Buyer.
The report does not rely on survey-based opinion as its core evidence base. Instead, it uses observable commercial signals and structured public evidence to build a decision-grade view for brand, category, retail, e-commerce, investment, and market-entry teams.
This report defines caffeine free instant coffee as A soluble coffee product that delivers the taste and ritual of coffee without caffeine, designed for convenience and specific consumer health or lifestyle needs and treats it as a branded consumer category rather than as a narrow technical product class. The objective is to capture the real commercial market that category, brand, trade-marketing, and channel teams are managing.
Scope is determined by how the category is sold, merchandised, priced, and chosen in market. That means the report follows product formats, claims, price tiers, pack architecture, need states, and retail environments that shape Quick home brewing, Office pantry staple, Travel convenience, and Foodservice portion control.
The study deliberately separates the category from adjacent baskets when they distort the economics or shopper logic of the market being measured. Typical exclusions therefore include Regular (caffeinated) instant coffee, Whole bean or ground decaf coffee, Ready-to-drink (RTD) canned/bottled coffee beverages, Coffee pods/capsules for machines, Coffee substitutes (e.g., chicory, barley), Caffeinated instant coffee, Decaf coffee pods, Instant tea or other hot beverages, and Coffee creamers or whitener-only products.
The report provides focused coverage of the United Kingdom market and positions United Kingdom within the wider global consumer-goods industry structure.
The geographic analysis explains local consumer demand conditions, brand and private-label balance, retail concentration, pricing tiers, import dependence, and the country’s strategic role in the wider category.
This study is designed for strategic and commercial users across brand-led consumer categories, including:
In many brand-driven, channel-sensitive, and consumer-demand-led markets, official trade and production statistics are not sufficient on their own to describe the true market. Product boundaries may cut across multiple tariff codes, several product categories may be bundled into the same official classification, and a meaningful share of activity may take place through customized services, captive supply, platform relationships, or technically specialized channels that are not directly visible in standard statistical datasets.
For this reason, the report is designed as a modeled strategic market study. It uses official and public evidence wherever it is reliable and scope-compatible, but it does not force the market into a purely statistical framework when doing so would reduce analytical quality. Instead, it reconstructs the market through the logic of demand, supply, technology, country roles, and company behavior.
This makes the report particularly well suited to products that are innovation-intensive, technically differentiated, capacity-constrained, platform-dependent, or commercially structured around specialized buyer-supplier relationships rather than standardized commodity trade.
The report typically includes:
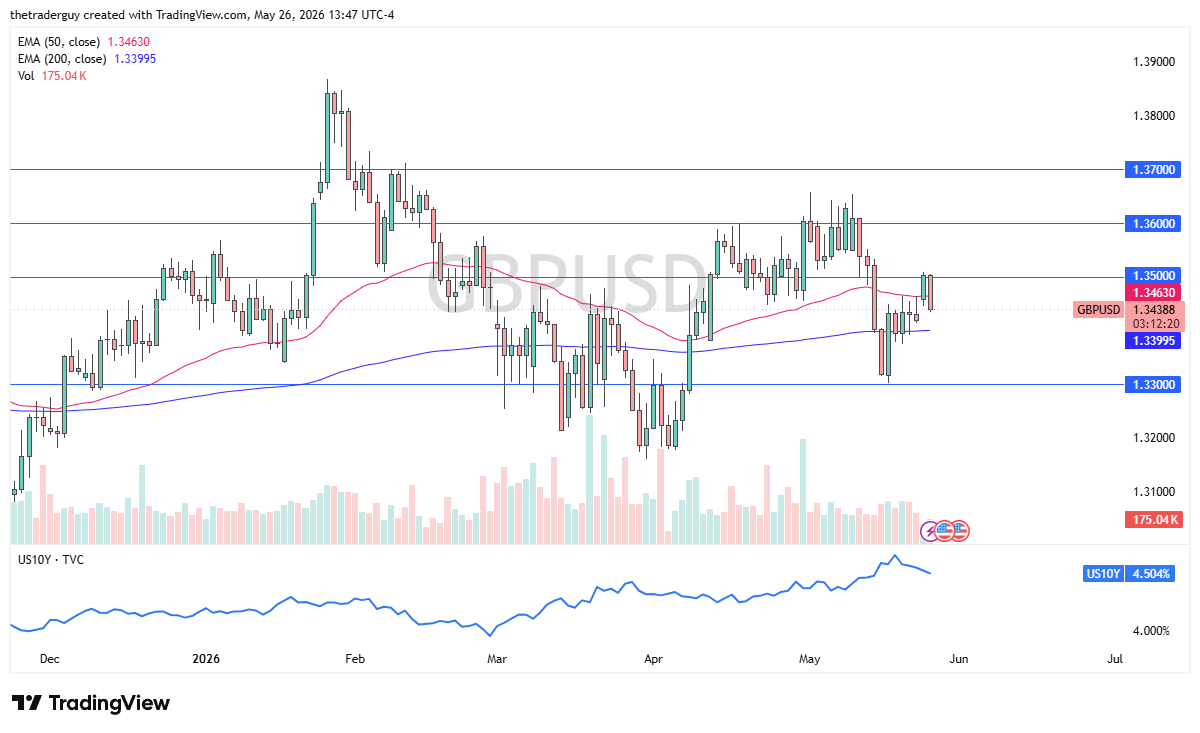
The British pound has fallen quite a bit during the early part of the session here on Tuesday, but as you can see, the market continues to see a lot of noise and quite frankly, a lot of questions asked about the British pound against the US dollar.
Probably not so much in the realm of what’s wrong with the pound, it’s that there’s a lot of fear out there and that makes the dollar strong.
Keep in mind that we are in the midst of filling the gap from the Monday open. That makes sense because we keep getting a lot of back and forth when it comes to the United States and Iran. So, with this, I believe this is a market that may try to bounce from here. We’ll just have to watch the interest rates in both countries and of course, we’ll have to watch the headlines.
If the GBP/USD pair does break down from here a little bit, the 200-day EMA right at the 1.34 level makes sense as support. Below there, the 1.33 level makes sense as support as well. So, in other words, even if we do fall, I think there are buyers’ underneath that are willing to get involved and take advantage of cheap British pounds.
To the upside, the 1.36 level I think is your short-term target. Whether or not we can break above there remains to be seen. A lot of this will come down to risk appetite. Remember the US dollar, of course, is considered to be a safety currency and that, of course, is what I think a lot of people are looking at it as just a simple, possible safety play.
The noise will continue to be deafening and therefore I would expect to continue to see a lot of choppiness.
Ready to trade our daily GBP/USD Forex forecast? Here’s some of the best forex broker UK reviews to check out.
Christopher Lewis has been trading Forex and has over 20 years experience in financial markets. Chris has been a regular contributor to Daily Forex since the early days of the site. He writes about Forex for several online publications, including FX Empire, Investing.com, and his own site, aptly named The Trader Guy. Chris favours technical analysis methods to identify his trades and likes to trade equity indices and commodities as well as Forex. He favours a longer-term trading style, and his trades often last for days or weeks.
As seen on: Pairs Of Aces Podcast,The Trader Guy, FXEmpire
Copper prices remained stable in recent trading, settled near $6.3500 level affected by its confinement between $6.4000 barrier, while $6.1000 level form extra support against the attempt of activating the bearish corrective trend.
Note that providing negative momentum signals by stochastic may push the price toward forming some bearish waves and attempting to attack the current support level. A break below this support would confirm readiness for further corrective waves, to target $5.9500 and $5.8000, while breaching the barrier and holding above it will turn it to the bullish path, to expect recording extra gains by its rally towards $6.6000.
The expected trading range for today is between $6.1000 and $6.4000
Trend forecast: Fluctuated within the bullish trend
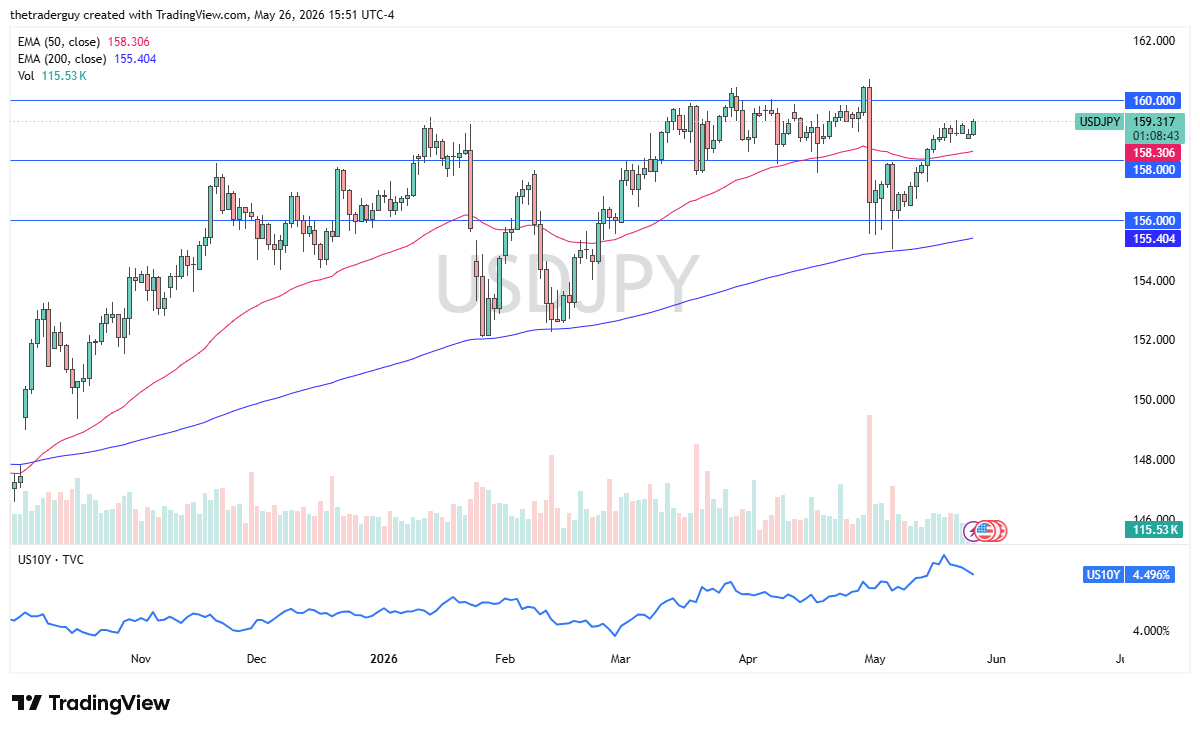
The US dollar has rallied a bit during the trading session on Tuesday as we continue to see a lot of upward pressure, and I think short-term pullbacks, I think, continue to attract a lot of attention mainly due to the fact that the interest rate differential is going to remain very wide between the United States and Japan.
That being said, you also have to be very cautious with the idea that the 160-yen level is an area where we had seen a lot of action due to the Bank of Japan getting involved. The 160 yen level is an area that I think a lot of people will have to pay close attention to, and the 160.50-yen level is an area that I think that is a massive barrier for the Bank of Japan to defend as it was a swing high going back to 1990.
Short-term pullbacks at this point open up the possibility of support underneath at the 50-day EMA as well as the 158-yen level. Anything below there opens up the possibility of a move down to the 156-yen level, but I don’t think that is very likely to be the case.
All things being equal, this is a market that I think you start to look for shorter term trades on drops in the dollar against the yen and that opens up the possibility of a little bit of value hunting as well as short-term opportunities. Ultimately, this is the market that I think does continue to threaten the Bank of Japan and now it’ll be interesting to see what the Japanese yen does because the Bank of Japan has recently received word that inflation is dropping in Japan and that could ease some of their concerns about a shrinking yen. That being said, there is a lot going on at the moment, not only in the Middle East but just around the world in general, so expect a lot of volatility.
Want to trade our USD/JPY forex analysis and predictions? Here’s a list of forex brokers in Japan to check out.
Christopher Lewis has been trading Forex and has over 20 years experience in financial markets. Chris has been a regular contributor to Daily Forex since the early days of the site. He writes about Forex for several online publications, including FX Empire, Investing.com, and his own site, aptly named The Trader Guy. Chris favours technical analysis methods to identify his trades and likes to trade equity indices and commodities as well as Forex. He favours a longer-term trading style, and his trades often last for days or weeks.
As seen on: Pairs Of Aces Podcast,The Trader Guy, FXEmpire
Copper prices remained stable in recent trading, settled near $6.3500 level affected by its confinement between $6.4000 barrier, while $6.1000 level form extra support against the attempt of activating the bearish corrective trend.
Note that providing negative momentum signals by stochastic may push the price toward forming some bearish waves and attempting to attack the current support level. A break below this support would confirm readiness for further corrective waves, to target $5.9500 and $5.8000, while breaching the barrier and holding above it will turn it to the bullish path, to expect recording extra gains by its rally towards $6.6000.
The expected trading range for today is between $6.1000 and $6.4000
Trend forecast: Fluctuated within the bullish trend
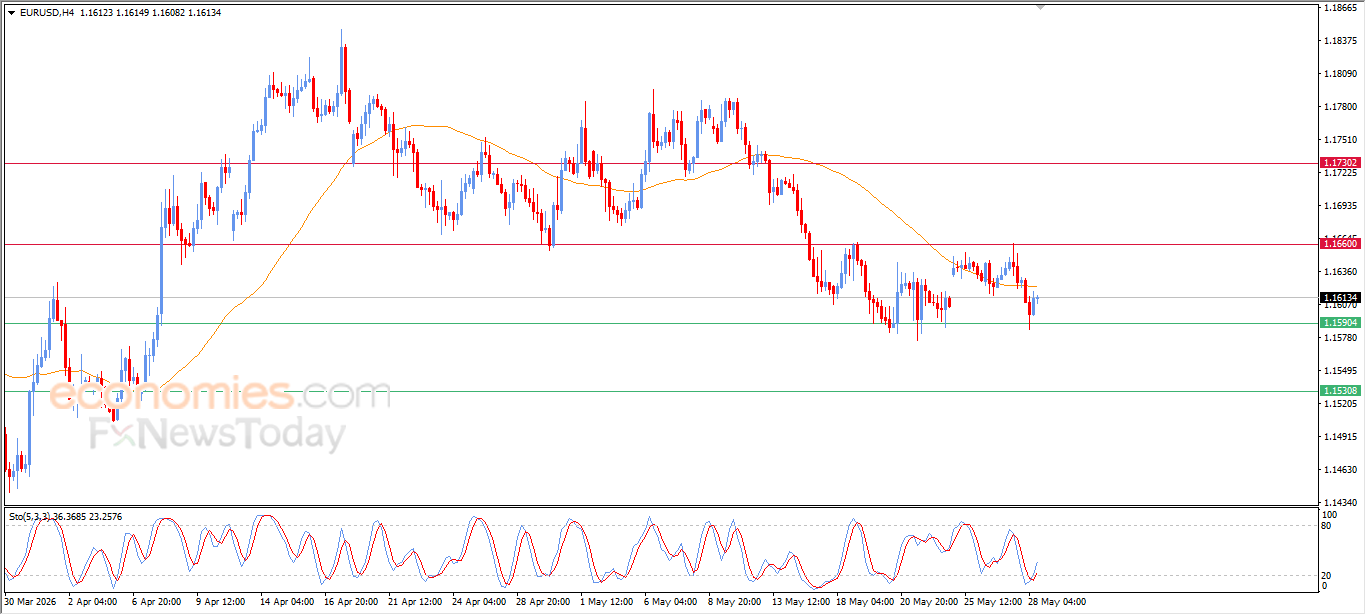
Exchange Rates UK Research’s latest May 2026 survey of major investment banks shows the EUR/USD exchange rate is expected to remain relatively well-supported above 1.16 in the near term, with the broader balance of forecasts continuing to point towards a gradual move into the 1.20–1.24 region through 2027.
The latest poll also highlights a growing divide between banks expecting a structurally weaker US dollar over the coming years and a smaller group forecasting EUR/USD drifting back towards the low-1.10s.
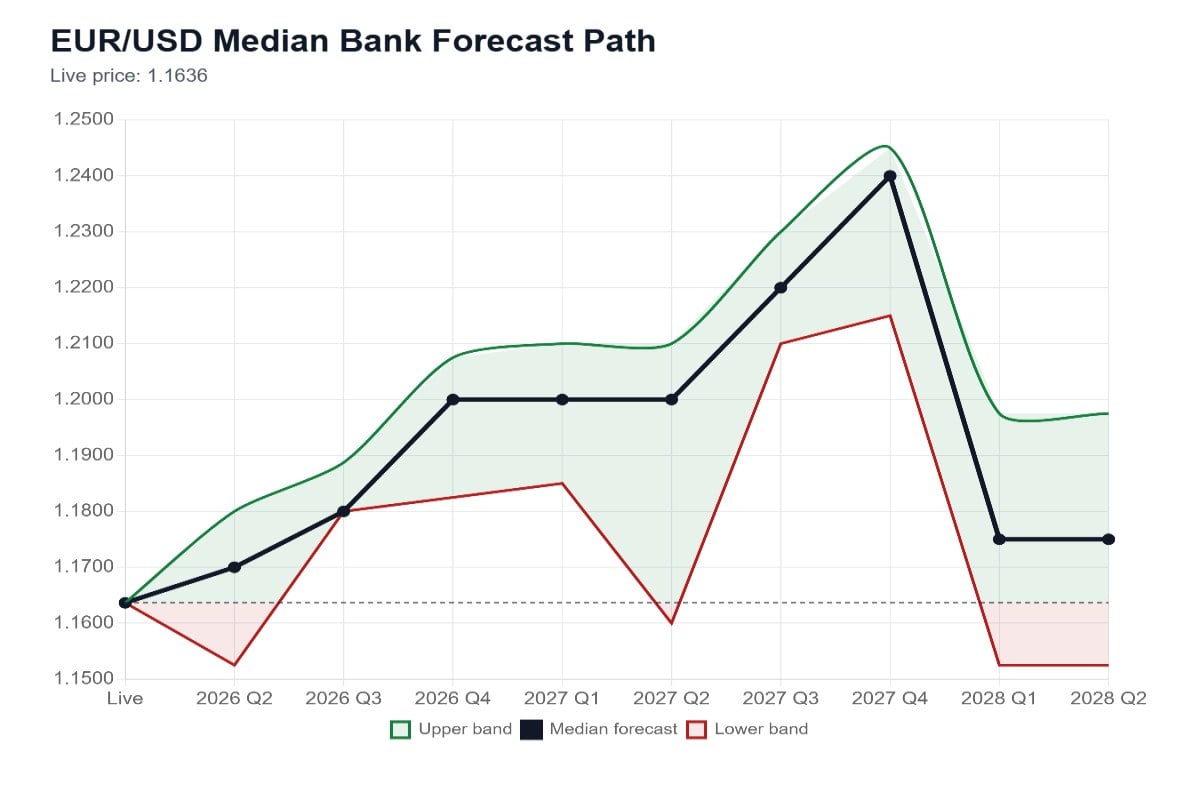
The majority of forecasts in the latest Exchange Rates UK Research poll continue to favour gradual EUR/USD appreciation over the medium term.
Banks including Scotiabank, RBC Capital Markets, ING, SEB and Natixis all expect the pair to trade above 1.20 during 2027, while Nordea remains the most bullish institution in the survey with projections extending towards 1.28 longer term.
By contrast, Citi and Danske Bank remain more cautious on the euro outlook, forecasting EUR/USD drifting back towards the 1.12–1.14 region over time.
Overall, however, the balance of forecasts continues to point towards a broadly softer US dollar environment compared with the past several years.
That outlook reflects the pair’s broader recovery trend since mid-2025.

EUR/USD rallied strongly from lows near 1.13 during 2025 and spent much of early 2026 trading in the 1.16–1.18 region. Although momentum has slowed during May, the pair remains significantly above the lows below parity seen during the 2022 energy crisis and the broader dollar surge that dominated 2022–2024.
Recent price action also suggests markets are becoming more comfortable with EUR/USD stabilising above the 1.15 level after repeated pullbacks found support.
A key theme running through the latest bank forecasts is the growing importance of the long-term US dollar outlook.
Many institutions now expect the Federal Reserve to gradually move towards lower interest rates during 2026 and 2027 as US growth slows and inflation pressures moderate further.
At the same time, concerns surrounding US fiscal deficits and rising government debt continue to feature prominently in longer-term dollar outlook discussions.
By comparison, the euro has benefited from improving Eurozone growth expectations, easing energy market pressures and reduced concerns about fragmentation risks within the currency bloc.
The European Central Bank has also maintained a relatively cautious approach towards rate cuts, helping support yield differentials versus the US dollar.
However, banks remain cautious about forecasting a rapid EUR/USD rally.
Global growth concerns, geopolitical tensions and periodic safe-haven demand for the US dollar continue to generate volatility and limit the pace of euro gains.
The latest Exchange Rates UK Research survey suggests a growing number of banks now view EUR/USD strength as a medium-term structural trend rather than simply a short-term correction.
Importantly, most forecasts now cluster above the average trading ranges seen between 2022 and 2024, reinforcing the idea that the market may be entering a new phase of broader US dollar weakness.
For now, the survey points to gradual appreciation rather than an aggressive breakout higher.
But with markets increasingly focused on Federal Reserve easing expectations and longer-term fiscal risks in the United States, institutional sentiment towards EUR/USD remains notably more constructive than it was even a year ago.