The main category of All News Articles.
You can use the search box below to find what you need.
[wd_asp id=1]
The main category of All News Articles.
You can use the search box below to find what you need.
[wd_asp id=1]
I wrote on the 21st December that the best trades for the week would be:
Overall, these trades gave an amazing gain of 22.41%, which comes to 4.48% per asset.
A summary of last week’s most important data:
Last week’s data had little impact except the US GDP data. The market is still pricing in only two Fed rate cuts of 0.25% over the course of 2026.
Of course, last week saw part of the Christmas holiday and as such markets were partially closed or mostly quiet with thin liquidity.
Forex and commodities markets did little, except precious metals, which made spectacular, wild gains. Gold, Silver, and Platinum all gained strongly to make new all-time highs, while Palladium also made strong gains to reach a new 3-year high.
In the USA, the S&P 500 Index broke to a new record high for the first time in several weeks on Christmas Eve, but the gains were nothing spectacular.

The coming week includes the western New Year holiday, which includes public holidays in several major markets on Thursday and Wednesday or Friday in some cases. This will almost definitely mean a much less liquid and active market than usual.
We are likely to see low level of volatility this week, like last week, except perhaps in the precious metals market. There is almost no high-impact data due.
This week’s most important data points, in order of likely importance, are:
Currency Price Changes and Interest Rates
For the month of December 2025, I made no forecast.
Last week, I made no forecast, as there were no recent excessive moves in currency crosses.
The Australian Dollar was the strongest major currency last week, while the US Dollar was the weakest. Directional volatility fell again last week, with only 7% of all major pairs and crosses changing in value by more than 1%.
Next week’s volatility will almost certainly be at a similarly low level.
You can trade these forecasts in a real or demo Forex brokerage account.
")
Key Support and Resistance Levels
Last week, the US Dollar Index printed a bearish candlestick which engulfed the real body of the previous week’s candlestick and closed quite near the low of its range. The price action is showing no long-term trend but is showing a short-term bearish trend. Recently, the greenback has been consolidating.
The surprisingly strong US GDP data released last week might be seen to be a reason for the Fed to cut rates less in 2026, but expectations have not changed.
I take no bias on the US Dollar right now. Not much is going on here, so it will probably make sense to consider other assets on their own over the coming week.
")
US Dollar Index Weekly Price Chart
The AUD/USD currency pair saw the largest move in the Forex market last week, although it was not very large, in relative terms. However, the Aussie is picking up some steam, although the daily price chart below shows that despite breaking a recent swing high, this bullish move may be running out of steam.
What impresses me the most about this currency pair is that its medium and long-term moving averages are starting to point up and gain on a daily chart, meaning this pair is probably a good candidate for a swing trade on the long side followed by a pullback and bounce at a medium moving average on a shorter-term price chart.
There isn’t a lot to say about the US or Australian Dollars in fundamental terms right now, except it is the most interesting thing in an otherwise dull Forex market.
")
AUD/USD Daily Price Chart
The weekly price chart below shows that this major US stock index gained last week, breaking to a new all-time high, although the move and breakout were not large or strong.
However, the price closed quite near the high, and it makes sense to be long of this index when it is making new record highs and showing even moderately bullish price action. Historically, the odds are in your favour going long here, as new record highs tend to lead to rising prices.
Bears can argue that the market is heavily overvalued and rising due to an AI bubble which will soon burst. Both these arguments are plausible, which is why anyone going long should use a volatility-based trailing stop and proper risk management.
I see technical but not fundamental reasons to be long, along the high US GDP data released last week might be encouraging bullish sentiment.
")
S&P 500 Index Weekly Price Chart
Silver’s wild, meteoric rise continues. It gained more than 10% just on Friday, more than 17% over the past week (the largest in over 5 years), and almost 60% in the last five weeks alone. The price action is extremely bullish, closing right on the high.
Other precious metals, such as Platinum, are also seeing explosive gains.
It is fair to say that Silver and Platinum are behaving like meme stocks rather than precious metals, although Silver and Platinum, like Palladium, are also industrial metals.
Some analysts argue that Silver is facing supply issues which cannot meet demand. I find this unconvincing as there is always plenty of Silver underground that can be mined if it becomes economical to do so.
Other analysts think some precious metals are gaining dramatically because markets are wary of all fiat currency. However, if this were so, you might expect Gold to be gaining much more dramatically, and Bitcoin might have a bid too – neither are true, Gold rose in an orderly way to a new record high last week.
I think what we are seeing is an end-of-year institutional and retail FOMO (fear of missing out) bubble. Silver may continue to rise, maybe even to $100, and then the bubble will burst, and it will come crashing down.
I think the correct way to approach Silver is to use a volatility-based trailing stop, maybe ATR (100) X3, and a very small position size (say, a quarter of the normal risk by account equity percentage).
")
Silver Weekly Price Chart
Platinum had its best week last week of all time, rising by more than 23% to exceed its previous record high set in 2008, gaining even more strongly than Silver did.
Everything I have to say about Silver in the section above also applies to Platinum. There is a stronger case that Platinum’s supply disruptions are meaningful and a real factor in pushing the price higher (70% of the world’s Platinum is mined in South Africa). Yet ultimately, it’s essentially a speculative bubble, just like Silver.
")
Platinum Weekly Price Chart
Gold has made a firm bullish breakout beyond its ascending price channel of recent weeks, closing very near its high and at a record high price too. These are all bullish signs, and precious metals are obviously gaining tremendously as an asset class.
These are all good reasons to be long of Gold and I am. What is most interesting though, is why Gold is gaining so much more slowly than other precious metals like Silver and Platinum?
The only fundamental answer I can think of is that Gold is purely a precious metal, while Silver and Platinum and Palladium are also industrial metal (although Gold does have a few other uses).
I suspect that speculators are just finding it easier to go after other markets than Gold, because so much Gold is held by central banks, who have an interest in calming and slowing the market.
I am long Gold. I have no idea how high it will go but I am happy to use a trailing stop and take the risk of coming along for part of the ride.
")
Gold Weekly Price Chart
Palladium rose strongly for a second consecutive week, gaining by 13% over the past five days to reach a new 3-year high price.
These are bullish signs, but it is worth noting that the price could not reach the big round number at $2,000 and retreated from that area once it got close to it.
Palladium is a precious and industrial metal and is a much more squeezable market than other precious metals, as it is a far rarer substance than Gold. Most Palladium is mined in South Africa and Russia, and there are legitimate supply issues and fears that are playing a role in driving the price higher.
Everything I have to say about Silver and Platinum in the sections above also applies to Palladium. I think we might see further strong gains here, but I will be long with a small position size and a hard trailing stop.
")
Paladium Weekly Price Chart
I see the best trades this week as:
Ready to trade our Forex weekly forecast? Check out our list of the top 10 Forex brokers in the world.
A recent expert Dogecoin price prediction shows the meme coin price action is on the cusp of a long-term wedge on the weekly chart. The pattern has shaped the token’s biggest cycles in recent years and could trigger a massive 560% DOGE rally if it forms to completion.
According to top analyst Ali_charts, a complete wedge would indicate that DOGE rallies by 560% to $0.80 from its current price of $0.12 at press time.
Each time price tightened inside a similar structure, volatility faded first. Then came the breakout. What we are seeing now follows that same script.
Currently, the Dogecoin cryptocurrency price action is holding above rising support levels around $0.12 to $0.13. This level has done its job well. Every dip into that zone has attracted buyers, while sellers have failed to push prices meaningfully lower. As a result, highs keep compressing and the range keeps narrowing.

The price action itself looks healthy. Rallies have been strong, and pullbacks have stayed controlled. Importantly, those pullbacks remain inside the wedge. That tells a simple story: this is consolidation, not distribution.
If DOGE completes the wedge and breaks above descending resistance on a weekly close, the upside could be significant. Using the size of the structure and past breakouts as a guide, a move of roughly 560% is possible over the cycle. That would bring $0.30 into play first, with $0.80 as a longer-term target.
For now, patience matters. Until price clears resistance, consolidation can drag on. But Dogecoin has a history of moving fast once compression ends. When it breaks, it usually does not look back.
Simply put, Dogecoin crypto price action is not breaking down. It is loading up. And if this wedge resolves higher, the next move could be one of its strongest in years.
A recent Dogecoin price prediction noted that DOGE is 95% bottomed to show that an imminent rally could be on the cards. According to his analysis, Dogecoin is starting to rise after a long correction.
On the daily chart, price is holding the $0.11–$0.12 area, a zone that has consistently attracted buyers. Selling pressure has slowed, and the push to new lows has stalled. That usually happens near the end of a downtrend.

The heavy selloff from October has already played out, and since then price has moved sideways in a tight range. That kind of action points to seller exhaustion rather than renewed weakness.
Above current price, liquidity is building. A large cluster of short positions sits just above $0.15. If DOGE trades into that area, forced covering could kick in and speed up the move. Meanwhile, holding above $0.11 is enough. As long as that base remains intact, downside risk stays limited.
Simply put, DOGE looks close to the bottom. With sellers losing control and liquidity sitting overhead, the path of least resistance is starting to tilt higher.
However, Crypto Jobs, a crypto analyst, has warned traders to be more cautious of Dogecoin’s price action, which tends to show weak buying and no clear bullish pattern, unlike other altcoins that are gaining stronger demand.
The post Dogecoin Price Prediction: Expert Weighs 560% DOGE Rally if it Complete Wedge appeared first on The Coin Republic.
The GBP/USD started last Monday around the 1.33785 mark and finished on Friday around the 1.34978 ratio. The GBP/USD correlated well to other major currencies which gained against the USD most of last week. Holiday season price action which began last week certainly brought lighter volumes.
But while some may question the gains made in the GBP against the USD, it does appear behavioral sentiment has shifted as weaker USD centric attitudes prevail.
Sustained higher values going into the weekend may be looked at suspiciously by some speculators of the GBP/USD, but the currency pair is touching values seen in late August and in September of this year without actually challenging higher apexes. The 1.34978 heights clearly have 1.35000 within sights and financial institutions may have interesting near-term decisions to make in the days ahead leading into the New Year’s holiday.
The GBP/USD did touch the 1.36000 level rather consistently in late August and September of this year. In fact the 1.37000 mark was also penetrated briefly on the 17th of September. That doesn’t mean that the 1.34978 ratio now displayed is cheap, but implies that shifting mid-term outlook which views USD weaker centric price action as a possibility due to upcoming power shifts in the U.S Federal Reserve, may be impacting financial institutions now and the way they are positioning the GBP/USD.
The U.S released a better than expected GDP report last week, but its results were published late, due to the government shutdown a couple of months ago, thus its results are being debated. The Federal Reserve’s next FOMC meeting is in late January and opinion varies regarding what the central bank will do regarding interest rates in the immediate future. However, this Tuesday, yes, while a lot of the financial markets are not paying attention because of being on vacation, the Fed will release its FOMC Meeting Minutes report. The Fed’s publication this week could prove lively reading, because it is known that open disagreements are brewing among the FOMC voting members. Who will be paying attention?
Holiday trading volumes are certainly going to impact the markets this coming week. However, the GBP/USD is one of the most heavily traded currency pairs in the world.
Speculative price range for GBP/USD is 1.34310 to 1.35430
The move higher in the GBP/USD mirrored movements in the EUR and other currencies against the USD this past week. Cautiousness the week before, suddenly changed into a more optimistic approach regarding USD centric weakness potential early this past Monday and the sustained move higher didn’t produce a reaction reversal. The lack of a strong reversal, and the ability to easily stay above the 1.34000 level and then the 1.34500 mark is an indication the GBP/USD has traction.
Due to the holiday season and lighter volumes than normal being seen in Forex, traders should remain careful and not get overly ambitious. If the 1.35000 ratio is penetrated and sustained this could indicate financial institutions believe the GBP/USD is within a sincere bullish trend. Speculators aiming for the highs attained in September of this year should not get greedy. The potential for a reactionary bout of selling in the GBP/USD with light volumes prevalent is a danger.
Ready to trade our weekly forecast? Check out the best forex trading company in UK worth using.
While the sentiment grows with regard to a possible positive breakout in the XRP pricing, expert investors continue to turn their attention to the best cryptocurrency to buy in prior to the full-scale bull market to take place. One top crypto, which has recently gained popularity with regard to mainstream industry attention is Mutuum Finance (MUTM). The project is priced under the $0.05 benchmark, accessible in a presale process, where Phase 6 is sold out 99%. Currently accumulating over $19.5 million, amidst a firmly developing ground for its rising popularity, MUTM has gained popularity regarding its utility-center strategy for both lending and borrowing operations associated with a full-fledged DeFi technological platform.
Experts continue to cultivate a sense of FOMO with regard to the possibility of a 5,000% breakout, which will propel MUTM prices likely to trade within the ranges of $2.50 from the current ranges below $0.05.
XRP is now stabilizing around the channel support and appears to be on course for a possible resurgence, thanks to buying momentum aimed at protecting this pivotal level of support. Technical analysts are of the view that should this level of demand remain in place, a correction towards the downward-sloping resistance line could potentially start to form in order to provide some short-term gains in this overall consolidation trend. XRP is establishing itself in a descending triangle and is now in a basing process, which remains favorable from a technical perspective so long as its major level of support below remains in place. The descending resistance appears to be an essential spot for traders to reach in order to start gaining traction.
For those investment minds searching for further opportunities in this market amidst XRP’s recovery, utility cryptos such as Mutuum Finance (MUTM) have also garnered interest.
Mutuum Finance (MUTM) is rapidly emerging as one of the most prospective DeFi projects of 2025. Phase 6 tokens are currently more than 99% sold out with over 18,590 participants and $19.5M raised. The current token price remains at $0.035, providing an opportunity for purchasing before Phase 7 prices at $0.04, moving towards the launching price set at $0.06. As Phase 6 of MUTM is almost entirely sold out, it remains one of the last chances for purchasing at a discounted price before the next market bull run.
While speculative tokens are more focused on speculation, Mutuum Finance has set the score by adoption. As far as investors interested in adoption and appreciation are concerned, MUTM is one of the best cryptocurrency to buy and the top crypto in 2025.

Mutuum Finance has designed not one but two revolutionary lending solutions for growth and stability. Peer-to-Contract (P2C) gathers assets into a liquidity market where users get distributed mtTokens in a 1:1 ratio, enabling users to gain dynamic APYs through lending, ensuring guaranteed passive income. For less conventional or volatile tokens, Peer-to-Peer (P2P) lending contracts are offered.
Mutuum Finance (MUTM) is the best cryptocurrency to buy in the market with a price of less than $0.05 and has immense potential. As phase 6 is over 99% sold out, with $19.5M raised, and over 18,590+ holders, investors now also have the opportunity to purchase holdings at $0.035. Additionally, with immense predicted gains of 5,000% and the price target reaching around $2.50 per token, an investment of $2,000 will soon hit $100,000, making MUTM have asymmetrical growth. The presale opportunity is soon to be over, and smart investors won’t want to miss another bull market.
For more information about Mutuum Finance (MUTM) visit the links below:
Website: https://mutuum.com/
Linktree: https://linktr.ee/mutuumfinance
According to the authors of a 2022 study published in Nature Communications, Alzheimer’s disease occurs when tau protein clumps into fibrous tangles that spread between brain cells, leading to their death. However, they found that a molecule found in green tea, epigallocatechin gallate (EGCG), could help break apart the protein tangles associated with Alzheimer’s disease.
To study the actions of EGCG on these proteins, the team analyzed tau tangles from the brains of people who had Alzheimer’s. Using cryogenic electron microscopy, they demonstrated that EGCG is capable of binding to small openings in tau fibers, destabilizing and pulling them apart.
However, the researchers said that EGCG is not able to penetrate the brain very well, and it interacts with other proteins besides tau. They felt that if they could identify other molecules with similar action to EGCG that are able to pass into the brain more effectively, this could lead to promising new Alzheimer’s medications. They used computer modeling to look for molecules that might act in a similar manner while also being more effective at entering the brain. In both lab and tissue tests, several of these candidates untangled tau and limited new tau formation.

While the 2022 study states that the EGCG present in green tea is not good at making its way into the brain where it’s needed, a 2025 study found in npj Science of Food suggests that drinking green tea may still be helpful when it comes to reducing your chances of developing dementia.
This study examined whether there was any link between green tea or coffee drinking and cerebral white matter lesions and hippocampal and total brain volumes. The scientists used people’s own self-reported consumption of these beverages and performed magnetic resonance imaging (MRI) to investigate cerebral white matter lesions, hippocampal volume, and total brain volume. After analyzing the data, they found that there was a correlation between higher green tea intake and fewer cerebral white matter lesions. Coffee, however, did not produce the same result.

Given the quality of the evidence and high potential for benefit, as well as its good safety profile, green tea appears to be a worthwhile addition to your diet if you’re looking to preserve cognitive function and prevent dementia.
According to the experts at Cognitive Vitality, there are multiple studies showing that drinking green tea is linked with a lower risk of dementia and cognitive decline. Studies have also found that moderate green tea consumption, which they define as three to five cups per day, is safe with only mild side effects.
Green tea supplements at high doses, however, may lead to gastrointestinal problems, elevated liver enzymes, and sleep issues. Additionally, there are certain medications that may interact with green tea, including warfarin, anisindione, and dicumarol. Green tea can also deplete folic acid and interfere with iron absorption.
Solana price crashed by over 40% this year, with its market capitalization plunging from a peak of $135 billion to the current $70 billion. This article explores the top reasons why the SOL price crashed and the potential catalysts for 2026.
There are a few key reasons why SOL price crashed this year. The main one is that the crash mirrored the performance of other cryptocurrencies, which plunged by double digits during the year.
Most importantly, the coin dropped as Solana meme coins erased the gains they made earlier this year and plunged. Data compiled by CoinGecko shows that the market cap of all Solana meme coins tumbled from over $25 billion in January to the current $5.4 billion.
Most of these meme coins have plummeted such that none has a market capitalization of over $1 billion. Official Trump, which soared in January, has seen its market valuation drop to $990 million today.
READ MORE: Dogecoin Price Crashed 63% in 2025 — What’s Ahead in 2026?
The falling Solana meme coins has had a major negative impact on its ecosystem. For example, the monthly DEX volume in Solana dropped to $92 billion in December from a peak of $313 billion. Its network fees has also plunged from $241 million in January to $15 million this month.

Additionally, Solana has experienced a sharp decline in futures open interest, which moved to $7.3 billion from the year-to-date high of over $16 billion.
Solana price has numerous bullish catalysts in 2026. One of them is the ongoing SOL ETF accumulation. These funds had $199 million, $419 million, and $137 million in inflows in the last three months, bringing the total to $755 million.
They hold $926 million in assets, equivalent to 1.35% of its market cap. This means that these funds have more gains to go as Ethereum and Bitcoin multiples stand at over 5%.
Solana will also unveil the Alpenglow upgrade that will replace the proof-of-history (PoH) and TowerBFT with votor and rotor. Votor will handle fast and direct validator for block finalization, while rotor will have an improved data dissemination protocol.
There are also chances that the community will vote to reduce its inflation, which stands at 8% annually. It decreases by 15% annually, with the long-term goal of reducing it to 1.5%.
Some teams, especially Helium, have made a proposal to double the disinflation rate from 15% to 30%. The goal will be to reach the terminal rate of 1.5% in 3.1 years instead of 6.2 years.
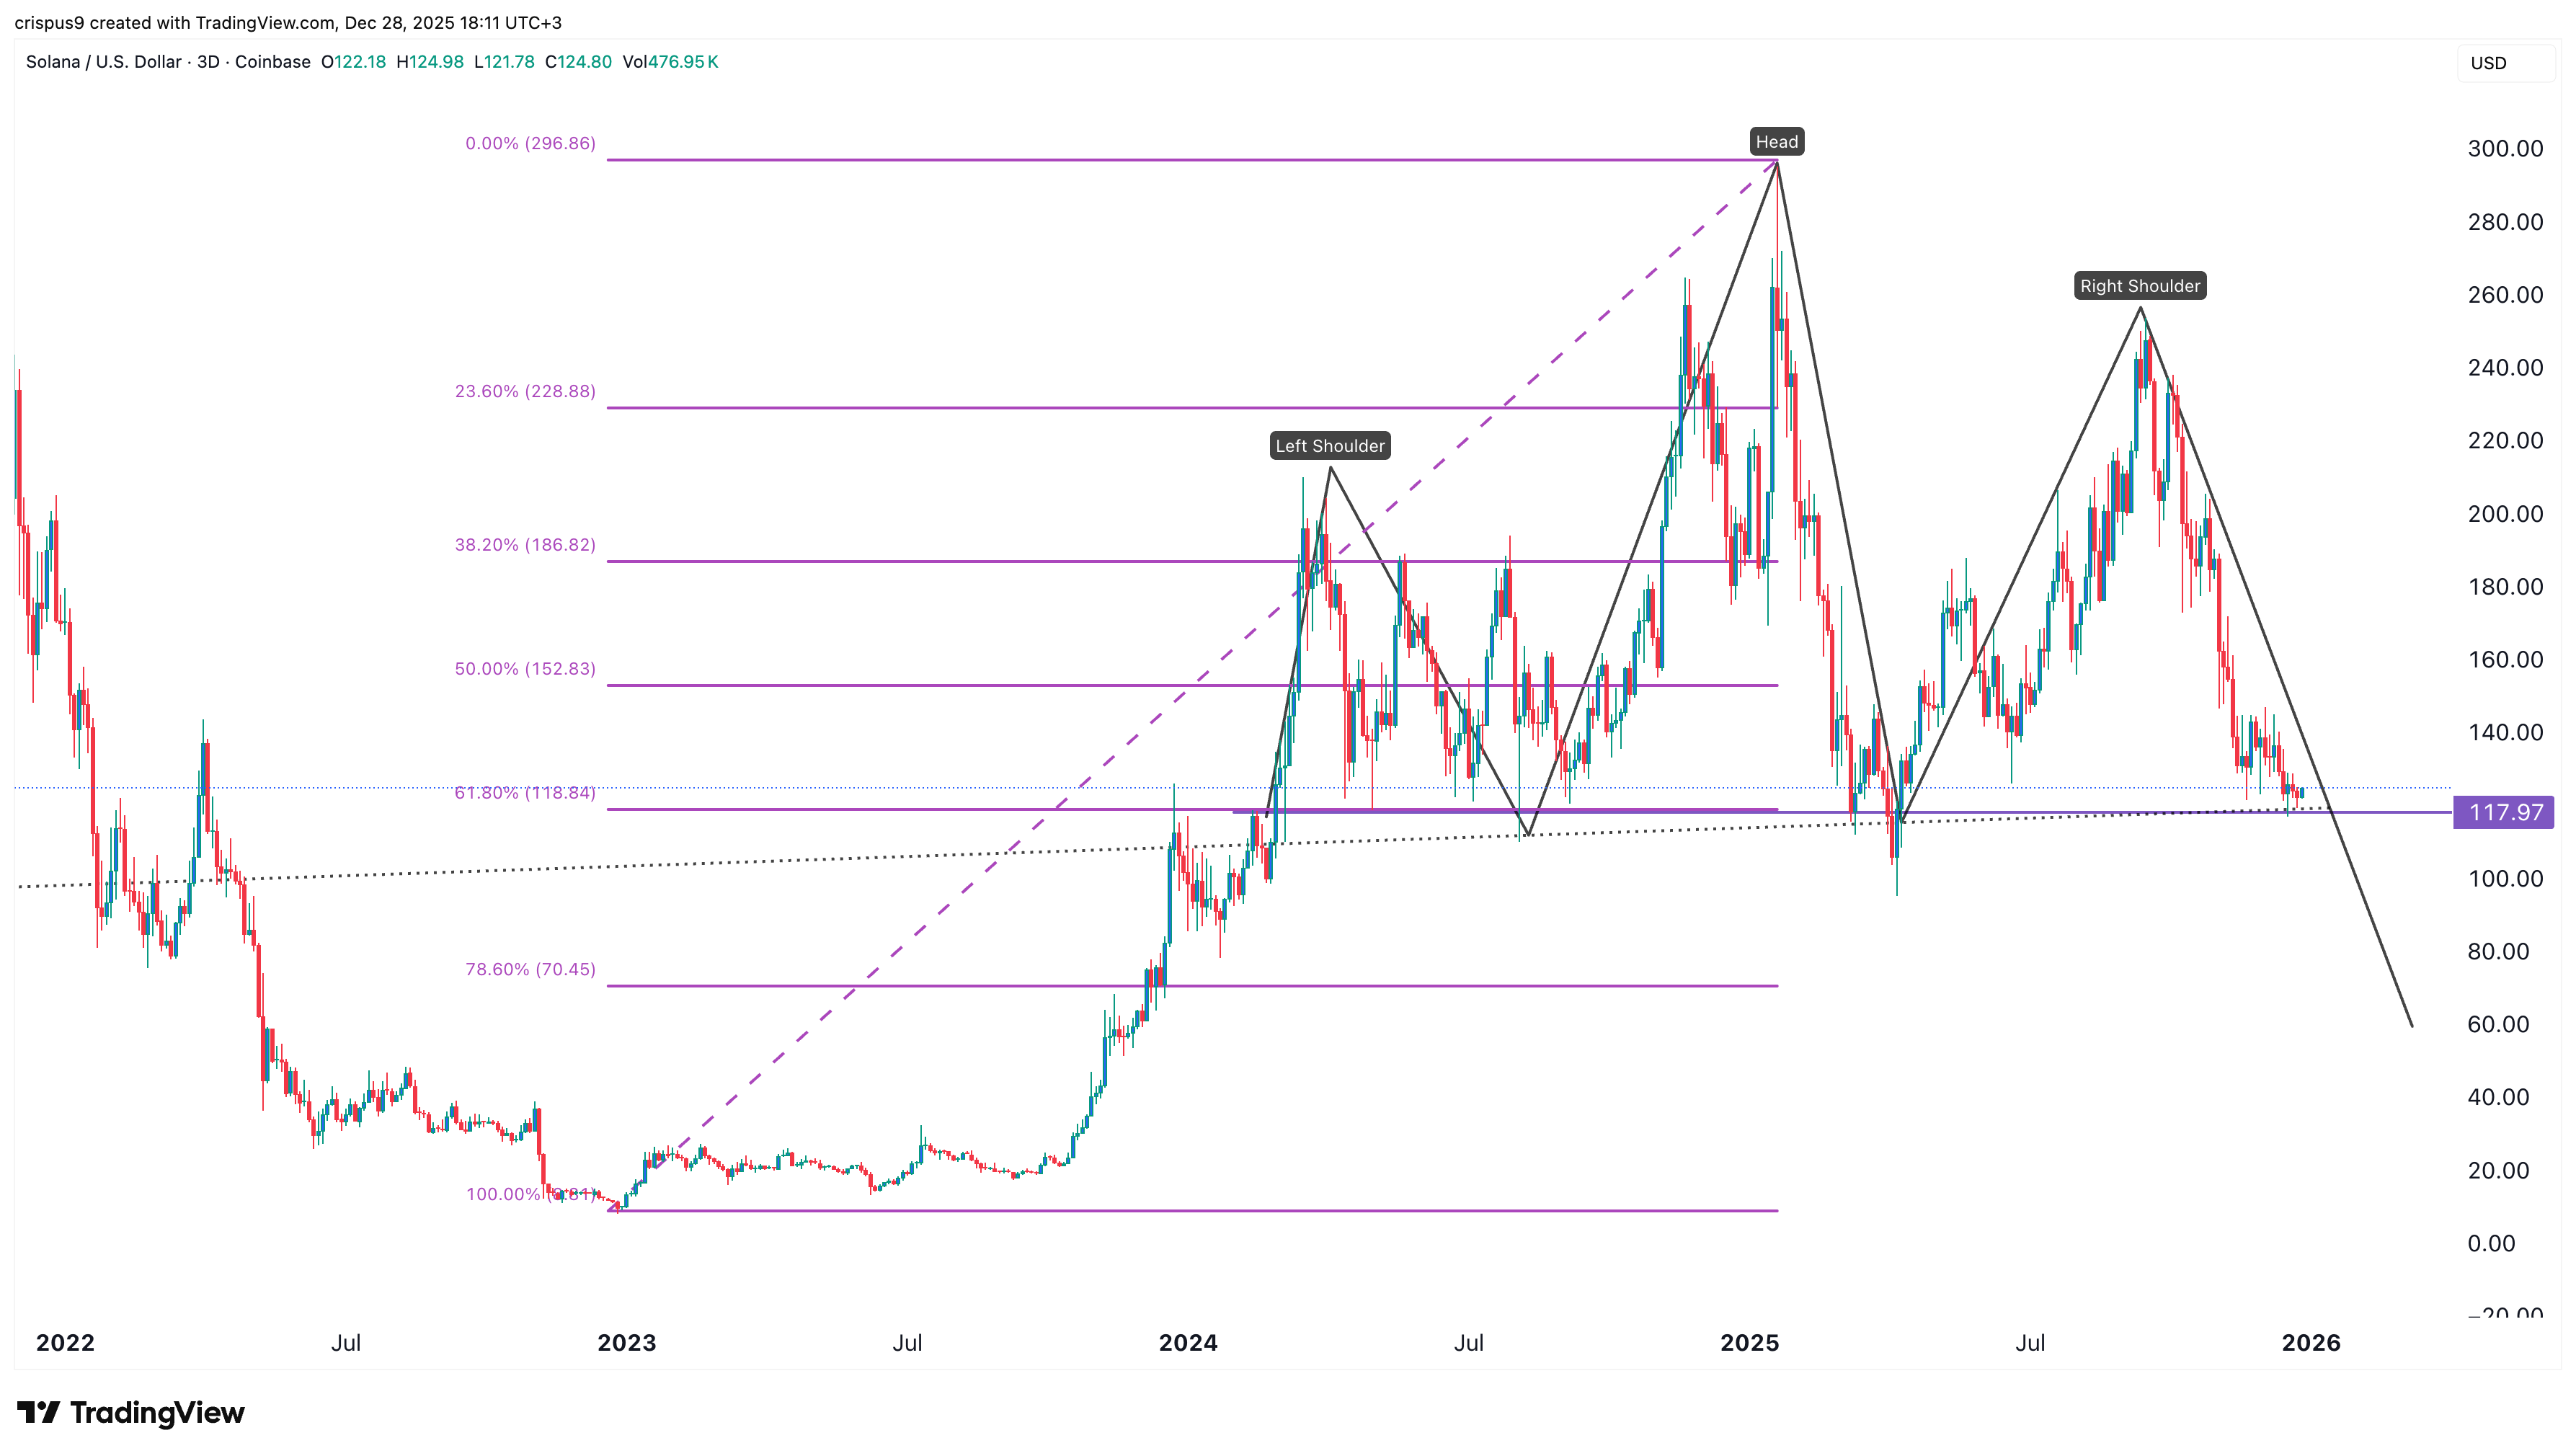
The three-day timeframe chart shows that the SOL price peaked at $296 in 2025 and then plunged to the current $124.57. A closer look shows that the token formed a head-and-shoulders pattern. It is now sitting at the neckline, which is along the 61.8% Fibonacci Retracement point.
Therefore, the most likely SOL price prediction is bearish, with the potential target being at $70.45, the 78.6% retracement level.
For two decades, 5-hour Energy, an energy drink sold in colorful two-ounce bottles in convenience store chains nationwide, has been the go-to booster for thousands of tired truckers and cramming college students. But last year, for the first time, it was reportedly surpassed as one major national convenience store chain’s top energy drink—by a product that had been on that chain’s shelves for only four months.
This up-and-coming brand, Feel Free, was marketing itself as something slightly different. As it declared in a white, scrolling font over the deep blue of its own two-ounce bottle, Feel Free was a “plant-based herbal supplement,” a proprietary blend of extracts from the botanicals kratom and kava, boasting properties that could amplify focus and boost mood.
For many users, however, the beverage didn’t have the advertised effect. Drew Barrett, of Champaign, Ill., says he was enticed by Feel Free’s serene packaging and its offer of relaxation and enhanced energy. But he soon found that after the immediate euphoria from the shot, he would be hit with a cycle of unpleasant symptoms, including a runny nose and achy body.
Still, the euphoria was real, and in a matter of months, Barrett says, he became addicted to the supplement. Barrett, 46, says he would down a two-ounce bottle of Feel Free 10 to 12 times a day—far surpassing the recommended dosage of one per day. At about $8 per bottle, the habit cost him about $2,000 a month; he bought so much that the local smoke shop where he was purchasing the bottles began giving him an employee discount. He lost 35 pounds; his eyes sunk into his head, and his skin took on a gray color. Barrett says he became so dependent on the drink he had to close down the thrift store he owned and seek in-patient treatment.
“The stuff is poison,” he told Fortune.
Barrett’s experience was alarming, but it isn’t unique: Complaints from aggrieved consumers are easy to find online, thanks in part to a range of viral social media posts. Those users share certain key concerns: that Feel Free’s marketing downplayed the fact that the drink contains kratom, creating problems for people who didn’t realize what they were ingesting.
Those dangers can be significant, according to multiple studies: Kratom is a psychoactive substance, and in larger doses it has been linked to seizures, high blood pressure, vomiting, liver damage, addiction, and hallucinations.
Indeed, in September 2024—the same month the product topped the sales charts at the convenience store chain—its manufacturer, Botanic Tonics, paid $8.75 million to settle a class-action lawsuit involving allegations that Feel Free’s labeling didn’t make clear just how much kratom is in each bottle, and had failed to alert consumers to the dangers of taking the substance in large quantities. (The company did not admit to any wrongdoing.) That settlement capped a tumultuous two-year stretch during which U.S. Marshals seized hundreds of thousands of bottles of Feel Free—and during which the founder of Botanic Tonics stepped down as CEO and publicly disclosed that he had formerly served federal prison time.
And yet, despite that chaos, the company’s business has continued to thrive. Today, Feel Free can be found in around 30,000 stores and counting, and has sold 130 million units, generating more than $250 million in annual sales and earning a steady profit for Botanic Tonics. During the second week of this October, Feel Free sales surpassed those of Red Bull and Monster Energy at a top-five convenience store chain, according to a Botanic Tonics press release citing Nielsen IQ data.
“Our product has the strongest safety record of any kratom product on the market, backed by government testing, clinical trials, and expert medical review,” a Botanic Tonics spokesperson told Fortune.
The company is working within the limits and at the edges of a hobbled American regulatory system that has largely looked away from the potential hazards in dietary supplements. The Food and Drug Administration, for its part, has a clear position on the substance: “Kratom is not appropriate for use as a dietary supplement,” its website says, adding that there’s insufficient information to prove that the substance is safe. But under lenient laws enacted in the 1990s, supplement manufacturers have incredible leeway to market their products—enabling them to operate in a legal gray area where consumer protections are few, and where sellers can be vague about ingredients and side effects, even when the potential for harm is serious.
“Feel Free is no different than any dietary supplement,” says Robert Durkin, former deputy director of the FDA office responsible for regulating dietary supplements, and now a lawyer who previously represented Botanic Tonics. “If it’s following the rules, it could legally be on the market.”
Kratom was largely unknown in the U.S. until a few decades ago, but it has always been associated with medicinal and psychoactive properties. As a minimally processed botanical usually served as a tea, kratom has been used for centuries as an analgesic and to treat ailments like cough and digestive issues—and, more recently, to aid those weaning off opiates. Indeed, Drew Barrett and other Feel Free users told Fortune they had previously used kratom as an attempt to alleviate other substance abuse issues.
Soren Shade, a kratom advocate and cofounder of kratom tea company Top Tree Herbs, says that the herb was likely brought stateside in the 1970s by Vietnam War veterans who had developed heroin habits while serving overseas, and were using kratom as a harm reduction tool. The leaf may also have come to America via Southeast Asian immigrants, who used and sold the plant within their communities.
The gradual loosening of restrictions against cannabis and cannabinoids helped make room in the market for other herbal and botanical products. By the time Botanic Tonics was founded in 2020, kratom products had become a $2 billion industry; according to one study, kratom was used by about 1.7 million Americans in 2021.
JW Ross, Botanic Tonics’ founder, has said he was inspired to launch the company by multiple trips to the South Pacific and Southeast Asia; he was determined to create an herbal supplement product that promoted what he envisioned as a healthy lifestyle, he said, particularly as he had struggled in the past with his own sobriety. One of the results, Feel Free, hit the market in 2020.
Sales skyrocketed, but so did consumer complaints. In April 2023, a class action lawsuit was filed in California against Botanic Tonics and a handful of retailers selling Feel Free, accusing them of fraud and false advertising.
The suit alleged that Botanic Tonics’ packaging did not disclose how much kratom was in Feel Free, or that Feel Free could have significant side effects. Plaintiffs claimed that Feel Free was marketed as a drink that could induce calmness and relaxation, and was no more habit-forming than caffeine—but that using the product had led many customers to become addicted to it. Lead plaintiff Romulo Torres had been hospitalized for symptoms including “vomiting, lapses in consciousness, delirium, and psychosis,” the lawsuit claimed. (Drew Barrett cited similar issues but was not one of the plaintiffs in the suit.)
According to the plaintiff, the class could have more than 5,000 members; Botanic Tonics said it has received fewer than 1,000 adverse event complaints from users. Still, the suit got results: In September 2024, Botanic Tonics agreed to the $8.75 million settlement.
As a result of the agreement, Botanic Tonics has improved product labeling “with clear warnings about potential effects and visible serving size indicators,” the company said. It also proactively raised the minimum purchase age for its products to 21. A company spokesperson told Fortune, “This product is not for people who have previously struggled with substance abuse and is only intended for healthy adults.”
Launching the company, it turns out, was part of a broader reinvention: About 15 years ago, Ross was living under a different legal name, Jerry Cash. As Cash, Ross was an oil and gas industry mogul in Oklahoma who was convicted in court and served federal prison time for failing to disclose the diversion of $10 million in corporate funds for personal uses. According to authorities, more than $5 million went toward renovating his Oklahoma City-area home.
Ross stepped down as CEO of Botanic Tonics in April 2024, while the class-action litigation was still ongoing; he was replaced by Cameron Korehbandi, who holds the role today. Ross disclosed his previous identity to investigative journalist Scott Carney in June 2024 and shared that he lived under a different identity in a letter on his website. Botanic Tonics did not respond when asked if Ross is still involved in its operations, and Ross did not respond to Fortune’s multiple interview requests.
The kratom Ross encountered in his travels to Southeast Asia was likely different from the substance packaged in Feel Free’s blue bottles, according to scientists who have studied the plant. When reprocessed as a powder or capsule, and in higher dosages, kratom has been associated with the swath of symptoms outlined in the 2023 class action lawsuit, leading some scientists to say that kratom in general is a potential public health threat.
For its part, Botanic Tonics has cited third-party research on the safety of Feel Free when taken at recommended dosages, saying those studies deemed Feel Free Classic Tonic to be safe with mild to moderate adverse events, including nausea, headaches, and fatigue for those in the highest-dose group of one bottle per day.
Ultimately, public health experts feel there isn’t enough research to determine whether the potential benefits of kratom outweigh the risks. “The regulatory market and research on its theoretic use hasn’t advanced enough at the same pace that [kratom] has become available as a supplement,” Silvia Martins, director of the Substance Use Epidemiology Unit at Columbia University Mailman School of Public Health, told Fortune.
Some politicians and jurisdictions have heard enough that they’ve made up their minds. In August, Ohio Gov. Mike DeWine called on the Ohio Board of Pharmacy to schedule kratom compounds as illegal drugs. Alabama, Arkansas, Indiana, Rhode Island, Vermont, Wisconsin, and Washington, D.C. have banned the substance, and eight other states have set a legal age limit of 21 to buy products containing kratom.
The FDA also disapproves of kratom’s use, stating on its website, “FDA has concluded…that kratom is a new dietary ingredient for which there is inadequate information to provide reasonable assurance that such ingredient does not present a significant or unreasonable risk of illness or injury.”
But despite that stance, the FDA has done little to restrict kratom. That’s due in large part, experts say, to the regulator having been essentially defanged about 30 years ago, creating what would become the Wild West of dietary supplements. “The agency has very weak enforcement powers, but most frequently, [doesn’t] even use the weak powers that they have,” Pieter Cohen, an associate professor of medicine at Harvard Medical School whose research is in dietary supplement safety, told Fortune.
The FDA did not respond to multiple requests for comment for this story.
For the better part of the 20th century, the FDA tried to classify dietary supplements as drugs, and later as food additives, in order to regulate products before they hit the market. In the late 1980s and early ‘90s, Congress even weighed a series of bills that would have strengthened the powers of the FDA, particularly in how it regulated product labels.
But those measures faced strident and well-financed pushback from the supplement industry. (One famous 1994 advertisement from a pro-supplement organization featured a fictional scene of actor Mel Gibson being arrested in his home by the FDA for taking vitamin C.) In October 1994, Congress passed the Dietary Supplement Health and Education Act (DSHEA), an amendment to the Federal Food, Drug, and Cosmetic Act that made it much easier for supplements to reach the market without having to demonstrate their safety or efficacy.
Ultimately, Congress justified DSHEA on the principle that customers should be informed, but also empowered with access to a marketplace of products with the potential to enhance their health. While the act outlines certain labeling practices a product must abide by, it does not require companies to gain—or even seek—FDA approval before a product hits the market, nor to prove the product is safe for human consumption. Instead, the FDA can take action against a product only once it finds sufficient evidence it is dangerous.
In practice, that’s a path the regulator will only pursue in extreme cases, such as where deaths are strongly linked to a product, said Marion Nestle, professor emerita of nutrition, food studies, and public health at New York University. DSHEA “was a total win for the industry,” Nestle told Fortune. “The public health community thinks it’s a travesty because there’s no federal guarantee that what’s in the product is what the product says it has.”
Indeed, with little risk of being taken off the market, supplement companies have taken liberties with even the skeletal labeling framework outlined by DSHEA. A 2023 analysis of 57 sports supplements, conducted by Harvard professor Cohen, found 89% of the products failed to accurately label their contents by FDA standards.
While FDA actions against supplement-makers are rare, the agency has taken at least one action against Feel Free. In May 2023, FDA investigators and U.S. Marshals seized more than 250,000 units of kratom-containing bottles along with other Feel Free products, a haul worth a total of more than $3 million, from Botanic Tonic’s production facility in Broken Arrow, Okla. The seizure, which came after a routine inspection, followed a forfeiture complaint filed on behalf of the FDA by federal prosecutors: The complaint claimed Feel Free was a “new dietary ingredient,” and that there was not enough information about the product to determine it was not dangerous to consume.
The seizure appears to have been related to bureaucratic slip-ups rather than safety complaints.
The FDA requires distributors and manufacturers of dietary supplements to submit a “new dietary supplement notification” if their product was not on the market prior to the passage of DSHEA. Even today, no new dietary ingredient notification from Botanic Tonics appears on the FDA’s list of submitted notifications, and the company did not respond to Fortune’s inquiry about whether the company has submitted a notification.
But despite the seizure, Botanic Tonics did not stop operations—because the FDA did not have a necessary injunction to stop production or prevent the product from reaching the market. Moreover, the court case is still ongoing. Weeks after the seizure, Botanic Tonics filed a motion to dismiss the forfeiture order and submitted a counterclaim, asserting its products should be returned to the company and that the government does not have enough proof to say that Feel Free is adulterated or misrepresented, or that it contains a new dietary ingredient with not enough research to deem it safe. On Dec. 10, a federal court judge assigned to the case last month denied Botanic Tonics’ motion to dismiss the case. The company declined to comment on the matter, as it is an ongoing action.
Beyond the FDA’s misgivings, industry experts and public health professionals have questions about Botanic Tonics’ labeling practices, with some sources alleging the company has violated regulations around what is required on a label.
Feel Free is one of a handful of kratom products that uploaded its label to the National Institutes of Health’s Dietary Supplement Label Database of more than 200,000 labels. The product label currently available in the database dates to 2022, before the Feel Free class-action settlement.
Paul Coates, the former longtime director of the Office of Dietary Supplements at the NIH, which conducts research to inform regulation, reviewed the label at Fortune’s request, and said he still has his doubts—chiding the product for not spelling out on the label exactly what it contains. In particular, Coates called out Feel Free’s proprietary blend, which he describes as “2,600 milligrams of goop.”
“They talk about potassium, iron, and 2,600 milligrams of a proprietary blend that includes kratom alkaloids—25 milligrams—and kavalactones from kava root—250 milligrams,” Coates said. “That tells me that there’s an awful lot more in that 2,600 milligrams.” A full bottle of Feel Free is one fluid ounce, or about 29,500 milligrams.
Botanic Tonics has posted up-to-date labels for Feel Free products on its website that differ from what is uploaded to the label database, but Coates’ observation still stands: The label for Feel Free Classic does not contain information about the total amount of kava root extract or ground kratom leaf in each bottle, a requirement in the FDA’s nutrition labeling of dietary supplements.
Coates said Feel Free is hardly unique in the dietary supplement industry, where there’s little fact checking to ensure what is in the product matches what is on the label. “Unless you know what to look for, you can’t measure it,” Coates said. “I don’t have any idea how that’s broken down any further, and it’s probably not. There are no standard methods for measuring, and that is part of the problem.”
Botanic Tonics said it has undergone multiple certifications and clinical trials to verify that Feel Free Classic labels match what is in the product. It added that the kratom leaf and kava root in its product are manufactured in an FDA-registered facility and that Feel Free contains no kratom extract, concentrates, or synthetic ingredients.
Ashley Snider, 34, wants kratom products to be more strictly regulated. Snider used to work at a supplement store and was introduced to Feel Free after a company representative dropped off sample products at her workplace. Soon, she says, she was spending $105 per month on a 12-pack subscription box of Feel Free—and then driving to a nearby convenience store to pick up more, sometimes taking six per day.
Snider told Fortune Feel Free made her continuously ill, and that she has not used it in nine months. When she cancelled her subscription, Snider said, the company sent her a pamphlet of mocktail recipes one can make using Feel Free. (Botanic Tonics denies that this book had been positioned as a cocktail or mocktail recipe book, stating rather that it was simply a book of recipes, and said Snider may have received the recipe book because it was mailed prior to her unsubscribing from the company. The company has a list of recipes on its website containing Feel Free products, none of which contain alcohol.)
What concerned Snider most, she said, was that while there are warnings about serving sizes on Botanic Tonics’ website (added to the brand’s label in 2022, according to the company), there were no guardrails in place that prevented her from ordering the product in much larger quantities than were recommended on the label. Botanic Tonics said its website is age-gated, required users to confirm they are over 21, and that one-third of its site is dedicated to consumer education. It did not say whether there are preventative measures on ordering a certain amount of product.
“I would like for there to be more transparency,” Snider told Fortune. “There needs to be something that separates them from just being readily available at gas stations, at supplement shops, not having reps go around and handing it out like Halloween candy.”
Even if the FDA were to crack down on Feel Free, other kratom beverage-makers could easily take its place in the market. The FDA makes assessments of a product’s safety based on health outcomes from that particular product’s dosage or blend of ingredients. In an industry with no standardized dosages for products, the FDA would be unable to generalize a takedown of one company to the whole industry.
“They might have to address it on this company-by-company basis. And that’s very inefficient,” said Cohen, the Harvard Medical School professor. “So fundamentally, we’re going to need to have a reform of the law…and I don’t see that in the near future.”
Industry experts tell Fortune there is little likelihood of regulatory changes under the current administration. In the leadup to the 2024 presidential election, Robert F. Kennedy Jr. vowed to end the “aggressive suppression” of dietary supplements and vitamins; Kennedy is now the secretary of Health and Human Services, with jurisdiction over the FDA.
The current enforcement system isn’t just inefficient, said Shade, the kratom advocate; it’s dangerous. If the FDA were to ban a particular alkaloid or compound in kratom demonstrated to be harmful, there’s nothing stopping a company from finding another alkaloid, just barely distinguishable from its prohibited predecessors, and sticking it on the market. Meanwhile, it typically takes the bureaucracy about a year to catch up and ban any given product, enough time for a new one to pop up on the market.
“It is an infinite game of Whack-a-Mole,” Shade said, “where every mole that pops up ends up being more unknown, more potent, and potentially more toxic.”
Crypto news today reveals decentralized finance leaders still owning the volume on-chain while meme tokens continue to snatch the virality of retail liquidity.
These two narratives are now falling together. Traders are finding comfort in projects that blend the DeFi tool’s credibility with the meme culture’s reach.
This hybrid narrative, historically speaking, has produced the greatest cycles of upside. Pepeto (https://pepeto.io) is proving to be the outstanding meme utility ecosystem placed squarely in this mixed narrative advantage window.
DeFi Leaders Still Have a Stake in Market Volume
Bitcoin news today and Ethereum news today show steady growth among major protocols in DeFi. Projects like Aave, Uniswap, MakerDAO, Lido, Curve, and Compound continue to process billions of trading and lending volume.
These platforms offer stability and infrastructure, but their high market capitalizations cap percentage upside for new entrants. While DeFi remains fundamental, retail traders are also looking past the established platforms to hybrid ecosystems that can offer faster repricing cycles and greater asymmetry.
Why Meme Tokens Have Viral Liquidity
Meme tokens are all about the narrative velocity, the community, and social amplification of the narrative. SHIB, DOGE, PEPE, and BONK showed that viral liquidity can outperform basics during strong market phases.
However, models of pure memes have problems with sustainability. Once the hype cools down, liquidity tends to vanish. This creates demand for meme ecosystems that are also capable of providing real trading capabilities, staking systems, and infrastructure that can retain users beyond hype cycles.
Pepeto’s Hybrid Meme-DeFi Architecture
Pepeto operates on the Ethereum mainnet, and PepetoSwap, Pepeto Bridge (https://pepeto.io/#bridge) , Pepeto Exchange, and high-yield staking systems are already live. All the paths of ecosystem activity pass through $PEPETO, and the trading participation is transformed into direct token demand.
Pepeto is an audited company with SolidProof (https://pepeto.io/assets/documents/audit-solidproof.pdf) and Coinsult. Its staking system provides an APY of around 216% and locks up circulating supply in exchange for rewarding early participation. With the total supply a fixed 420 trillion tokens, staking alleviates sell pressure with routed ecosystem volume compounding demand.
How Pepeto Is Better than Traditional DeFi and Pure Meme Models
Traditional DeFi protocols have stability and little asymmetry. Pure meme tokens provide for asymmetry but poor retention. Pepeto blends both models. It is a combination of meme virality and DeFi-style retention loops through swap, bridge, exchange, and staking activity. This provides a continuous cycle in volume, which reinforces the same token rather than spreading liquidity over a number of assets.
Hybrid Narrative Market Psychology
Hybrid ecosystems have the advantage of having both social velocity and functional retention. Viral exposure helps attract new users, while DeFi-style tools keep people active within the same ecosystem. This dual-layer psychology is historically responsible for creating longer cycles of expansion and higher terminal valuations. Pepeto’s unified routing model ensures that all swaps, bridges, and trades compound demand back into one token, making the valuation more resilient.
Institutional Interest Versus Retail Spillover
Hybrid ecosystems also invoke institutional curiosity once retail traction is made visible. Funds are frequently following retail narratives, which exhibit viral engagement in addition to actual infrastructure.
Meme utility ecosystems that already have an audited trading stack in place can absorb this secondary liquidity much more efficiently than roadmap-only projects. Pepeto’s audited stack, unified routing, and staking-based supply controls put them in an ideal position to capture these spillover waves.
Presale Momentum & Community Growth
Pepeto’s community has passed 100,000 members. Presale participation has surpassed $7.12 million raised, and the current presale price is locked at 1 $PEPETO equal to $0.000000174. These metrics are indicative of accelerating early adoption while valuation is still early in comparison to established DeFi leaders.
Market history indicates that narrative hybrids are superior to single-theme projects. The future winners will be those who will combine emotional reach with structural retention. Pepeto is located precisely within this hybrid narrative window. It offers meme culture, real DeFi tools, and audited infrastructure in a unified demand engine.
How to Buy Pepeto
The Pepeto presale is live on the official website, https://pepeto.io . Buyers can link their wallet and buy with ETH, USDT, BNB, or credit card via Web3Payments. For early buyers, they can stake now to earn high APY before exchange listings. A giveaway worth $700,000 is also available on the official site.
An Aggressive Hybrid Conclusion
Pure DeFi limits upside. Pure memes have no sustainability. Pepeto delivers both. With audited contracts, live trading tools, staking supply locks, and an exponentially growing community, Pepeto is one of the strongest hybrid narrative opportunities of the next cycle.
Each presale stage that closes increases the costs of entry and eliminates supply. Traders scanning crypto news today for the next 100x meme coin and the best crypto to buy now and the best meme coin to buy are standing in front of one of the most structurally complete early-stage meme utility ecosystems left in this market.
To stay ahead of key updates, listings, and announcements, follow Pepeto on its official channels only:
Website: https://pepeto.io
X (Twitter): https://x.com/Pepetocoin
Telegram: https://t.me/pepeto_channel
Instagram: https://www.instagram.com/pepetocoin/
Repricing begins long before it becomes visible.
Contact: Dani Bonocci
Website: https://www.tokenwire.io
Phone: +971586738991
SOURCE: Pepeto
Press release distribution
This release was published on openPR.
")
")


