The main category of All News Articles.
You can use the search box below to find what you need.
[wd_asp id=1]
The main category of All News Articles.
You can use the search box below to find what you need.
[wd_asp id=1]
The United Kingdom is one of Europe’s largest coffee-consuming nations, with an estimated 98 million cups consumed daily across retail and foodservice channels. Within this mature landscape, the convergence of health-consciousness and ethical spending has carved a distinct growth corridor for Fair Trade Decaf Coffee. This sub-category sits at the intersection of two powerful consumer currents: a structural shift toward reduced caffeine intake among over-35s and millennials, and a willingness to pay a premium for third-party-certified ethical sourcing. Fair Trade Decaf Coffee commands a price point 20–40% higher than conventional roasted coffee, supported by a consumer base that increasingly views purchasing decisions as expressions of personal and environmental responsibility.
The market is structurally dependent on complex global supply chains. High-altitude Arabica farms in Latin America and East Africa supply certified green beans, which are then routed to specialized decaffeination facilities—predominantly in Germany, Canada, and Mexico—before reaching UK-based roasters. This extended value chain creates both cost pressure and an opportunity for brand differentiation based on traceability. The United Kingdom is not a coffee-growing country, so the domestic role is limited to roasting, blending, packing, and distributing. The London coffee exchange historically anchors global pricing, but physical supply flows entirely through imports, making the market sensitive to logistics costs, currency fluctuations between the pound and producer-country currencies, and certification audit cycles.
While the overall United Kingdom coffee market grows at a stable 2–3% per annum, the Fair Trade Decaf segment is expanding at a 7–11% compound rate over the 2026–2035 forecast horizon. Volume growth is being fueled by a 15–20% annual increase in the number of SKUs dedicated to ethically labeled low- and no-caffeine options across grocery, specialty, and online channels. Value growth outpaces volume growth due to the persistent shift toward premium specialty grades—single-origin Arabica, small-batch roasted, and Swiss Water processed—which command higher unit prices and carry thicker retail margins.
The segment’s share of total UK decaf coffee is estimated at 30–40% in 2026, up from roughly 20% five years earlier, reflecting the pace at which ethical certification is becoming an expected attribute rather than a differentiator in the decaf aisle.
Demographic tailwinds are strong. Gen Z and younger millennials, who will represent 45–55% of UK coffee buyers by 2030, show measurably higher willingness to pay for products that combine personal health benefits with verified ethical sourcing. This cohort is driving trial and repeat purchase of Fair Trade Decaf at a rate 1.5–2 times higher than the general coffee-drinking population. Assuming current supply constraints are eased by investments in decaffeination capacity and certification infrastructure in origin countries, market volume could double by 2035, with the premium specialty segment capturing an increasing share of the value pool.
By type, Arabica dominates the United Kingdom Fair Trade Decaf market with a 75–85% volume share, driven by its superior taste profile and its alignment with the at-home brewing rituals of specialty-oriented consumers. Blended products—typically Arabica–Robusta mixes—hold 10–15% share, concentrated in mid-tier office coffee service (OCS) programs where cost control matters. Straight Robusta accounts for the remainder, used almost exclusively in the instant and low-cost pod segments, where the more aggressive flavor profile is partially masked by milk or sweeteners. The Arabica share is expected to increase further as roasters introduce single-origin Fair Trade Decaf offerings from Ethiopia and Colombia, which retail at a 30–50% premium over blended equivalents.
By application, at-home consumption represents 55–65% of segment volume, a share solidified by the hybrid work trend. Home brewing occasions—particularly pour-over, AeroPress, and bean-to-cup machines—favor whole-bean and freshly ground formats. Office and workplace consumption accounts for 20–25% of volume, with a distinct recovery underway as corporate offices restock their coffee programs post-pandemic, often with an explicit mandate to include Fair Trade options. Gifting, particularly around the Christmas season, represents 10–15% of retail value in the segment, featuring whole-bean Fair Trade Decaf packs positioned as ethical premium gifts. Corporate gift buyers are an emerging sub-segment, driving demand for branded, sustainably sourced coffee hampers for employees and clients.
The pricing architecture of Fair Trade Decaf Coffee in the United Kingdom reflects a multi-layered cost stack. At the base sits the global green bean commodity price—benchmarked to the ICE Futures US ‘C’ contract for Arabica—which has shown structural volatility of 20–40% year-on-year due to climate disruptions in Brazil and Colombia. On top of this, the Fair Trade minimum price floor and the additional Fair Trade premium (currently $0.20–0.40 per pound) provide a price buffer for certified producers. Decaffeination adds a significant cost layer, ranging from $0.40 to $1.00 per pound depending on the method: Swiss Water Processing commands the highest premium, followed by CO₂, with sugar-cane-based ethyl acetate methods occupying the lower end. Roasting, packing, and logistics add further margin layers before retail shelf pricing is set.
In the UK retail channel, ground Fair Trade Decaf typically retails for £7–14 per kilogram, compared to £5–9 per kilogram for standard non-organic, non-decaf roasted coffee. Instant Fair Trade Decaf trades at a narrower absolute premium due to higher processing throughput. The primary cost drivers in 2026 are energy prices—roasting is an energy-intensive process—and logistics costs, which have risen 15–25% since 2021 due to container shipping volatility and post-Brexit customs administration. Currency exposure is material: the pound’s purchasing power against the Brazilian real and Colombian peso directly impacts landed green bean costs. Promotional discounting by major grocers periodically compresses retail margins, but the Fair Trade premium floor prevents the cost base from dropping below a sustainable threshold for producers.
The competitive landscape in the United Kingdom Fair Trade Decaf market is a dichotomy of global branded owners and agile specialty roasters. Jacobs Douwe Egberts (JDE) and Nestlé are dominant in the mainstream retail and OCS channels, offering Fair Trade-certified lines under brands such as Kenco and Nescafé Azera. These players benefit from vast procurement networks that buffer green bean price volatility and from long-term contracts with large decaffeination plants in Germany. Their scale allows them to price Fair Trade Decaf competitively, often at a 15–20% premium to their conventional ranges, applying margin pressure on smaller rivals.
Specialty roasters such as Union Hand-Roasted, Pact Coffee, and Grind are driving growth in the premium direct-to-consumer segment, emphasizing Swiss Water Processing, direct-trade relationships with specific cooperatives, and origin-specific seasonal offerings. These brands command retail prices 30–60% above mass-market equivalents and enjoy higher customer retention via subscription models. Private-label specialists serving Tesco, Sainsbury’s, and Waitrose are expanding their ranges, capturing value-conscious ethical shoppers who prioritize certification over brand name.
Importing wholesalers such as Beyers Koffie and DRWakefield play a critical upstream role, sourcing certified green beans, managing decaffeination contracts, and supplying both large roasters and small independents. The competitive intensity is high, with shelf-space fights occurring primarily around the “premium everyday” price tier at £8–11 per kilogram.
The United Kingdom has no commercial coffee cultivation and is wholly dependent on imports for its Fair Trade Decaf supply. The domestic role in the value chain is concentrated in roasting, blending, grinding, packing, and distribution. Major roasting facilities are located in London, Southampton, and Yorkshire, with a growing cluster of micro-roasters in the Midlands and Scotland serving local subscription and retail accounts. The UK’s historical role as a global coffee trading hub—anchored by the London International Financial Futures and Options Exchange (LIFFE) Robusta futures contract—means that significant financial and logistical infrastructure exists even though physical production is absent.
The supply model is entirely import-driven and relies on a complex logistics network. Green beans arrive at UK ports (Southampton, Felixstowe, Tilbury) in containerized shipments from producer countries. A substantial share of Fair Trade green beans is first shipped to decaffeination plants in Germany (CO₂ process) or Canada (Swiss Water process), then re-exported to the UK as decaffeinated green beans. This routing adds 4–8 weeks to lead times and increases costs by $0.30–0.60 per kilogram for logistics and double customs clearance.
Warehousing capacity for green coffee in the UK is concentrated near port hubs, with London’s Docklands area housing several temperature-controlled facilities. The just-in-time roasting model favored by specialty roasters means inventory buffers are thin, making the supply chain vulnerable to shipping disruptions or phytosanitary delays at borders.
The United Kingdom is a net importer of coffee, and the trade flow for Fair Trade Decaf is particularly complex due to the decaffeination processing step. The primary product classification codes used are HS 090122 (decaffeinated coffee, not roasted) and HS 090121 (decaffeinated coffee, roasted). Green beans classified under HS 090111 and HS 090112 enter the UK from producer countries before being re-exported for decaffeination or, increasingly, processed for decaffeination in continental Europe then re-imported. Germany is the dominant supplier of processed decaf green beans to the UK, with Canada—home to the Swiss Water facility—accounting for a growing share, particularly for the premium specialty segment.
Origin countries for the green beans include Brazil, Colombia, Peru, Ethiopia, and Uganda, collectively supplying 80–90% of the UK’s Fair Trade green coffee volume. Post-Brexit trade documentation, including rules of origin requirements under the UK-EU Trade and Cooperation Agreement, adds administrative overhead for EU-sourced decaf beans, though zero-tariff access generally applies if the beans are sufficiently processed in the EU. Re-exports of roasted Fair Trade Decaf from the UK to other European markets are small but growing, driven by London’s reputation as a specialty coffee hub. Import patterns suggest that roasters are increasingly contracting directly with producer cooperatives rather than relying on the European spot market, a shift that improves traceability but increases procurement lead times and inventory requirements.
Grocery retail is the largest distribution channel for Fair Trade Decaf Coffee in the United Kingdom, accounting for an estimated 40–50% of the volume sold. Tesco, Sainsbury’s, Waitrose, and Marks & Spencer all dedicate shelf space to the category, with category managers actively curating ranges to meet explicit sustainability mandates. These buyers prioritize suppliers who can guarantee consistent volume, FLOCERT certification documentation, and year-round availability. Pricing negotiations are intense, and private-label penetration is increasing as retailers seek to offer a Fair Trade Decaf option at a lower price point than branded alternatives.
Direct-to-consumer (DTC) subscriptions represent 15–20% of volume but a higher share of revenue, given the premium pricing. Companies such as Pact Coffee and Grind have built loyal subscriber bases by offering freshly roasted beans shipped within days of roasting, often with detailed origin stories and decaf-process documentation. This channel allows for higher margins and direct customer data, but carries higher logistics costs per unit. Office coffee service (OCS) accounts for 20–25% of volume, with corporate procurement managers increasingly requiring Fair Trade certification as part of ESG commitments.
Specialty cafés account for 10–15% of volume, often featuring a single-origin Fair Trade Decaf as a pour-over option to capture the afternoon and early evening caffeine-sensitive occasion. Buyer groups span ethical-conscious consumers, health-motivated caffeine-sensitive individuals, corporate gift buyers, and foodservice procurement teams, each with distinct price sensitivity and certification expectations.
The Fair Trade certification for coffee sold in the United Kingdom is governed by FLOCERT, the global certification body for Fairtrade International (FLO) standards. These standards mandate minimum prices, a Fair Trade premium for community investment, and requirements for democratic producer organizations and environmental protection. The certification applies to the entire supply chain from farm to the point of retail packaging, with annual audits for all certified operators. The United Kingdom’s departure from the European Union has created a separate UK organic certification regime, but Fair Trade standards remain globally harmonized, meaning no additional regulatory divergence has occurred for the ethical certification itself.
Food safety regulations under the UK Food Safety Act 1990 apply stringent residue limits for dichloromethane (DCM), a solvent used in some conventional decaffeination processes. While DCM is permitted at very low residual levels (typically no more than 2 parts per million in roasted coffee), the regulation pushes processors and roasters toward methylene chloride-free methods such as Swiss Water Processing, CO₂ extraction, and ethyl acetate processing.
Country-of-origin labeling and “Fair Trade” as a descriptor are protected terms enforced by the Competition and Markets Authority and the Advertising Standards Authority, ensuring that marketing claims are substantiated by third-party certification. Roasters must maintain full traceability documentation for all certified product batches, a requirement that creates a barrier to entry for smaller operators but protects the integrity of the category as a whole.
Looking ahead to 2035, the United Kingdom Fair Trade Decaf Coffee market is poised for robust expansion, with volume projected to increase by 60–80% from 2026 levels. The compound annual growth rate (CAGR) is forecast to settle in the 6–9% range, a deceleration from the torrid 7–11% pace of the early forecast period as the category matures but still well above the mainstream coffee market growth rate. Three structural factors underpin this outlook: the aging of ethically-oriented Gen Z and millennial consumers into their peak coffee-consuming years; the continued expansion of Fair Trade Decaf SKUs in mainstream grocery and foodservice channels; and incremental improvements in decaffeination technology that narrow the taste gap between decaf and caffeinated coffee, reducing a key historical barrier to trial.
Private label is expected to capture a 25–30% volume share by 2035, up from an estimated 15–20% in 2026, as retailers refine their direct sourcing relationships with Fair Trade cooperatives and decaffeination processors. The at-home channel will remain the largest application segment, but office coffee service is forecast to grow at an above-average rate as corporate sustainability mandates expand. The premium specialty segment—single-origin, small-batch roasted, Swiss Water processed—will gain value share, potentially accounting for 40–50% of retail revenue by 2035 even if it represents only 25–35% of volume. Price sensitivity will persist, meaning growth will be steady rather than explosive, but the combination of demographic tailwinds and channel expansion provides a strong foundation for sustained long-term expansion.
Process innovation represents one of the highest-value opportunities in the United Kingdom Fair Trade Decaf market. Roasters that exclusively use Swiss Water or CO₂ decaffeination and invest in marketing the process as a feature—highlighting the “chemical-free” aspect—can capture a 15–25% price premium over products that do not specify their decaf method. Consumer awareness of decaffeination processes is rising, and transparency around the method used is becoming a purchase trigger for the ethically-conscious buyer segment. Early movers who secure long-term contracts with limited-capacity Swiss Water and CO₂ processing plants will have a supply advantage that can be leveraged in retail negotiations.
Private-label premiumization offers a significant growth avenue for UK grocery multiples. Major retailers can develop “Taste the Difference” or equivalent premium-tier Fair Trade Decaf lines, sourced directly from a single high-altitude cooperative and processed via CO₂, competing directly with specialty roasters at a lower price point while still achieving higher margins than standard private-label coffee.
Corporate sustainability gifting is an under-penetrated adjacent market: offering Fair Trade Decaf as a branded corporate gift or employee wellness perk aligns with expanding ESG mandates and provides a recurring B2B revenue stream that is less price-sensitive than retail. Finally, functional fortification—infusing Fair Trade Decaf with adaptogens, vitamins, or mushroom extracts—aligns with the United Kingdom’s booming functional FMCG trend, creating a “health-first” coffee occasion that justifies a further premium and differentiates the product from standard decaf offerings in a crowded premium aisle.
This report is an independent strategic category study of the market for fair trade decaf coffee in the United Kingdom. It is designed for brand owners, general managers, category leaders, trade-marketing teams, e-commerce teams, retail partners, distributors, investors, and market entrants that need a clear read on where growth sits, which brands control the category, how pricing and promotion shape demand, and which channels matter most for scale and margin.
The framework is built for packaged food & beverage markets within consumer goods, where performance is driven by need states, shopper missions, brand hierarchies, price-pack architecture, retail execution, promotional intensity, and route-to-market control rather than by a narrow technical specification alone. It defines fair trade decaf coffee as Coffee beans that have been decaffeinated and certified as Fair Trade, meeting standards for equitable pricing, labor conditions, and environmental sustainability for producers and maps the market through category boundaries, consumer segments, usage occasions, channel structure, brand and private-label positions, supply and availability logic, pricing and promotion mechanics, and country-level commercial roles. Historical analysis typically covers 2012 to 2025, with forward-looking scenarios through 2035.
This report is designed to answer the questions that matter most to brand, category, channel, and strategy teams in consumer-goods markets.
At its core, this report explains how the market for fair trade decaf coffee actually works as a consumer category. It is built to show where demand comes from, which need states and shopper missions matter most, which brands and private-label players shape the category, which channels control visibility and conversion, and where pricing power, repeat purchase, and margin are actually created.
Rather than framing the category through narrow technical attributes, the study breaks it into decision-grade commercial layers: product format, benefit platform, shopper segment, purchase occasion, pack-price architecture, channel environment, promotional intensity, route-to-market control, and company archetype. It is therefore useful both for teams shaping portfolio strategy and for teams executing growth through Ethical-conscious consumers, Health-motivated consumers (caffeine-sensitive), Corporate gift buyers, Grocery category managers, and Specialty food retailers.
The report also clarifies how value pools differ across Home brewing, Office coffee service, and Premium gifting, how premiumization and private label reshape category economics, how retail concentration and route-to-market design affect scale, and which countries matter most for brand building, sourcing, packaging, and channel expansion.
The report is based on an independent market-intelligence methodology that combines category reconstruction, public company evidence, retail and channel mapping, pricing review, and multi-layer triangulation. It is built for consumer categories where no single public dataset captures the real structure of demand, brand power, promotion, and channel control.
The evidence stack typically combines company disclosures, investor materials, brand and retailer product pages, e-commerce assortment checks, packaging and claims analysis, public pricing references, trade statistics where relevant, regulatory and labeling guidance, and observable route-to-market evidence from distributors, retailers, merchandisers, and marketplace ecosystems.
The analytical model then reconstructs the category across the layers that matter commercially: category scope, shopper need states, consumer segments, pack-price ladders, brand and private-label hierarchy, channel power, promotional intensity, route-to-market design, and country role differences.
Special attention is given to Health & wellness (caffeine reduction), Ethical consumption values, Premiumization at home, Brand trust and transparency, and Third-party certification appeal. The objective is not only to size the market, but to explain where value pools sit, which segments drive mix and repeat purchase, which channels shape growth, and how leading brands defend or expand their positions across Ethical-conscious consumers, Health-motivated consumers (caffeine-sensitive), Corporate gift buyers, Grocery category managers, and Specialty food retailers.
The report does not rely on survey-based opinion as its core evidence base. Instead, it uses observable commercial signals and structured public evidence to build a decision-grade view for brand, category, retail, e-commerce, investment, and market-entry teams.
This report defines fair trade decaf coffee as Coffee beans that have been decaffeinated and certified as Fair Trade, meeting standards for equitable pricing, labor conditions, and environmental sustainability for producers and treats it as a branded consumer category rather than as a narrow technical product class. The objective is to capture the real commercial market that category, brand, trade-marketing, and channel teams are managing.
Scope is determined by how the category is sold, merchandised, priced, and chosen in market. That means the report follows product formats, claims, price tiers, pack architecture, need states, and retail environments that shape Home brewing, Office coffee service, and Premium gifting.
The study deliberately separates the category from adjacent baskets when they distort the economics or shopper logic of the market being measured. Typical exclusions therefore include Non-decaffeinated Fair Trade coffee, Decaf coffee without Fair Trade certification, Instant decaf coffee (unless specified Fair Trade), Coffee pods/capsules (separate machinery-driven segment), Foodservice/bulk unpackaged sales, Ready-to-drink (RTD) coffee beverages, Specialty caffeinated coffee, Conventional decaf coffee, Tea and other hot beverages, Coffee substitutes (e.g., chicory), and Coffee brewing equipment.
The report provides focused coverage of the United Kingdom market and positions United Kingdom within the wider global consumer-goods industry structure.
The geographic analysis explains local consumer demand conditions, brand and private-label balance, retail concentration, pricing tiers, import dependence, and the country’s strategic role in the wider category.
This study is designed for strategic and commercial users across brand-led consumer categories, including:
In many brand-driven, channel-sensitive, and consumer-demand-led markets, official trade and production statistics are not sufficient on their own to describe the true market. Product boundaries may cut across multiple tariff codes, several product categories may be bundled into the same official classification, and a meaningful share of activity may take place through customized services, captive supply, platform relationships, or technically specialized channels that are not directly visible in standard statistical datasets.
For this reason, the report is designed as a modeled strategic market study. It uses official and public evidence wherever it is reliable and scope-compatible, but it does not force the market into a purely statistical framework when doing so would reduce analytical quality. Instead, it reconstructs the market through the logic of demand, supply, technology, country roles, and company behavior.
This makes the report particularly well suited to products that are innovation-intensive, technically differentiated, capacity-constrained, platform-dependent, or commercially structured around specialized buyer-supplier relationships rather than standardized commodity trade.
The report typically includes:
EUR/GBP Price Forecast: Euro Remains Vulnerable Below 0.8640 – Critical Support Test
The EUR/GBP price forecast indicates that the euro remains vulnerable below the key psychological level of 0.8640. As of [current date], the pair trades near 0.8615, reflecting persistent selling pressure. This analysis provides an in-depth technical and fundamental outlook for traders and investors.
The EUR/GBP price forecast hinges on the critical support zone at 0.8640. A sustained break below this level opens the door for a move toward 0.8580, the next major support. The pair has formed a series of lower highs since mid-January, confirming a bearish trend. The 50-day moving average now acts as resistance near 0.8700.
Key technical indicators support the bearish outlook:
Volume analysis shows increased selling on breakdown attempts. This confirms trader conviction in the downside move. A daily close below 0.8640 would validate the EUR/GBP price forecast for further losses.
Several fundamental factors underpin the euro’s weakness against the pound. The European Central Bank (ECB) maintains a dovish stance, while the Bank of England (BoE) signals caution. Interest rate differentials favor the pound.
Key fundamental catalysts include:
These factors create a persistent headwind for the euro. The EUR/GBP price forecast reflects this fundamental divergence.
The interest rate gap between the eurozone and the UK currently favors the pound. The BoE holds rates at 5.25%, while the ECB’s deposit rate stands at 4.00%. This 125-basis-point differential attracts capital flows into sterling-denominated assets.
Market pricing for future rate cuts amplifies this divergence. Traders expect the ECB to cut by 75 basis points in 2025. In contrast, the BoE may only deliver 50 basis points of cuts. This expectation keeps the euro under pressure.
Identifying key EUR/GBP support and resistance levels is crucial for trading decisions. The following table outlines the most important price zones:
| Level | Type | Significance |
|---|---|---|
| 0.8640 | Support (pivot) | Broken support, now resistance |
| 0.8580 | Support | Next major downside target |
| 0.8520 | Support | 2024 low, strong historical level |
| 0.8700 | Resistance | 50-day moving average |
| 0.8760 | Resistance | 100-day moving average |
A break below 0.8580 would confirm the bearish EUR/GBP price forecast. Conversely, a move above 0.8700 would signal a potential reversal.
Market analysts remain bearish on the euro. A recent survey of 30 currency strategists shows 70% expect EUR/GBP to trade below 0.8600 in the next month. This consensus reinforces the technical outlook.
Key expert observations include:
These expert views align with the technical analysis. The EUR/GBP price forecast remains tilted to the downside.
The next two weeks are critical for the pair. Key events that could influence the EUR/GBP price forecast include:
Two primary scenarios exist:
Scenario 1 (Bearish): A break below 0.8580 targets 0.8520. This requires continued UK economic outperformance and ECB dovishness.
Scenario 2 (Neutral): Consolidation between 0.8580 and 0.8640. This would occur if data releases are mixed.
The bearish scenario has a 60% probability, according to current market pricing.
The EUR/GBP price forecast clearly shows the euro remains vulnerable below 0.8640. Technical indicators, fundamental drivers, and market sentiment all point to further downside. Traders should watch the 0.8580 support level closely. A break below this level would confirm the bearish outlook and target 0.8520. Conversely, a move above 0.8700 would invalidate the bearish thesis. For now, the path of least resistance is lower.
Q1: What is the EUR/GBP price forecast for the next week?
The EUR/GBP price forecast suggests continued vulnerability below 0.8640, with a potential test of 0.8580 support.
Q2: Why is the euro weak against the pound?
The euro is weak due to ECB dovishness, UK economic resilience, and interest rate differentials favoring the pound.
Q3: What are the key support and resistance levels for EUR/GBP?
Key support is at 0.8640 and 0.8580. Resistance is at 0.8700 and 0.8760.
Q4: How does ECB policy affect the EUR/GBP forecast?
ECB policy, including expected rate cuts, weakens the euro and supports the bearish EUR/GBP price forecast.
Q5: What technical indicators confirm the bearish outlook?
The RSI below 40, MACD below signal line, and price hugging the lower Bollinger Band confirm bearish momentum.
This post EUR/GBP Price Forecast: Euro Remains Vulnerable Below 0.8640 – Critical Support Test first appeared on BitcoinWorld.
BitcoinWorld
Silver Price Forecast: XAG/USD Rallies as Strong US Jobs Report Weakens the Dollar
The silver market experienced a notable rally this week, with XAG/USD climbing sharply as a stronger-than-expected US jobs report paradoxically weakened the US Dollar. The move caught many traders off guard, as strong employment data typically strengthens the Dollar and pressures precious metals. However, a deeper reading of the report suggests that wage growth and labor participation rates may be signaling a shift in Federal Reserve policy expectations, prompting a rotation into safe-haven assets like silver.
The US Bureau of Labor Statistics reported that non-farm payrolls increased by 228,000 in the previous month, well above the consensus estimate of 180,000. The unemployment rate held steady at 3.9%, while average hourly earnings rose 0.4% month-over-month, slightly above forecasts. Normally, such data would boost the Dollar as it suggests the economy can handle higher interest rates. Yet the Dollar Index (DXY) fell 0.6% on the day, its largest single-session drop in three weeks.
Analysts attribute the Dollar’s decline to a reassessment of the Fed’s rate path. While the headline jobs number was strong, the details revealed a softening in temporary hiring and a decline in average weekly hours worked — both early indicators of cooling demand. Markets interpreted this as a signal that the Fed may pause rate hikes sooner than previously expected, reducing the opportunity cost of holding non-yielding assets like silver.
Silver, often more volatile than gold due to its dual role as a monetary metal and industrial commodity, surged 2.8% to trade near $24.90 per ounce. The rally was supported by a drop in US Treasury yields, with the 10-year note falling 8 basis points to 4.12%.
From a technical perspective, silver broke above its 50-day moving average at $24.50, a level that had acted as resistance for the past two weeks. The next key resistance zone lies between $25.20 and $25.50, the latter being the 200-day moving average. A sustained move above $25.50 could open the door to $26.00, a psychological level that has not been tested since early February.
On the downside, support is now established at $24.20, with stronger support at $23.80. The Relative Strength Index (RSI) on the daily chart moved to 62, indicating bullish momentum without entering overbought territory, leaving room for further upside.
For precious metals investors, the current setup presents a mixed picture. The Dollar’s weakness provides a tailwind, but silver’s industrial demand component remains sensitive to global growth concerns. China’s manufacturing PMI data, released earlier this week, showed a slight contraction, which could cap silver’s gains if the industrial outlook deteriorates further.
However, if the Fed signals a more dovish stance at its next meeting, silver could benefit from both monetary policy expectations and renewed investor interest in hard assets. The market is now pricing in a 65% probability of a rate hold in June, up from 50% before the jobs report.
The silver rally following the US jobs report underscores the complexity of current market dynamics. While strong employment data typically supports the Dollar, the nuanced details of the report shifted focus toward a potential Fed pause, benefiting precious metals. Traders will watch for further economic data, particularly inflation figures and retail sales, to confirm the trend. For now, silver appears well-supported, but the path forward depends on whether the Dollar’s weakness proves temporary or signals a broader shift in investor sentiment.
Q1: Why did silver rally on a strong jobs report?
A: While the headline jobs number was strong, details such as declining temporary hiring and reduced average weekly hours suggested a cooling labor market. This led markets to anticipate a potential Fed pause on rate hikes, weakening the Dollar and boosting silver.
Q2: What are the key resistance levels for silver?
A: The next key resistance is at $25.20 to $25.50, with the 200-day moving average near $25.50. A break above $25.50 could target $26.00.
Q3: Is silver a good investment right now?
A: Silver benefits from a weaker Dollar and potential Fed dovishness, but industrial demand risks from global growth slowdowns remain. Investors should consider their risk tolerance and monitor upcoming economic data for confirmation of the trend.
This post Silver Price Forecast: XAG/USD Rallies as Strong US Jobs Report Weakens the Dollar first appeared on BitcoinWorld.
– Written by
David Woodsmith
STORY LINK GBP/USD Forecast: Pound Sterling Pressured by Starmer Leadership Concerns
The Pound US Dollar (GBP/USD) exchange rate moved lower at the beginning of the week as concerns over UK political stability weighed on Sterling sentiment.
At the time of writing, GBP/USD was trading near $1.3597, down around 0.2% from Monday’s opening levels.
The Pound (GBP) struggled to attract support on Monday as speculation surrounding Keir Starmer’s future intensified following Labour’s weak showing in the recent local elections.
Reports suggesting that some Labour MPs are considering whether the Prime Minister should step aside unsettled investors, particularly as markets remain highly sensitive to concerns surrounding the UK’s fiscal outlook.
Traders worry that any leadership contest or change in direction from the government could create additional uncertainty at a time when borrowing costs and inflation pressures are already elevated.
This nervousness filtered into the bond market, with UK gilt yields pushing higher amid fears that a future leadership change could result in looser fiscal policy.
Sterling also faced additional headwinds after comments from Bank of England (BoE) policymaker Megan Greene suggested the central bank may prefer to hold off on raising interest rates in the near term, despite ongoing inflation concerns.
Get better rates and lower fees on your next international money transfer.
Compare TorFX with top UK banks in seconds and see how much you could save.
The US Dollar (USD) strengthened on Monday as rising tensions in the Middle East boosted demand for safe-haven assets.
Investor sentiment turned more cautious after US President Donald Trump dismissed Iran’s latest response to Washington’s proposed peace framework, branding it ‘completely unacceptable’ after Tehran refused to abandon key parts of its nuclear programme.
At the same time, concerns over the stability of the current ceasefire agreement resurfaced after Iranian officials warned of potential clashes if more warships enter the Strait of Hormuz.
Looking ahead, attention for GBP/USD investors will turn to the publication of the latest US inflation figures.
Economists expect Tuesday’s consumer price index to show another increase in inflationary pressures during April, driven in part by elevated energy prices.
A stronger-than-expected inflation reading could reinforce expectations that the Federal Reserve will maintain a hawkish stance on monetary policy, which may offer further support to the US Dollar.

Meanwhile, Sterling sentiment is likely to remain tied to political developments in Westminster, with the Pound vulnerable to further losses if speculation over Starmer’s leadership continues to build.
International Money Transfer? Ask our resident FX expert a money transfer question or try John’s new, free, no-obligation personal service! ,where he helps every step of the way,
ensuring you get the best exchange rates on your currency requirements.
TAGS: Pound Dollar Forecasts
Natural gas price continued providing weak sideways trading due to the contradiction of the main indicators, to keep delaying the negative trend due to the stability above the extra support at $2.620.
Stochastic surpass to 50 level might push the price to form some temporary bullish waves, attempting to reach $3.000 level, to retest $3.200, while breaking the previously mentioned support and holding below it will force it to suffer extra losses by reaching $2.390 followed by the next main target at $2.250.
The expected trading range for today is between $2.700 and $2.950
Trend forecast: Fluctuating
The USD/JPY pair trades 0.25% higher to near 157.00 during the European trading session on Monday. The pair trades firmly as the Japanese Yen (JPY) underperforms across the board amid growing concerns over Japan’s economic outlook due to higher oil prices.
The table below shows the percentage change of Japanese Yen (JPY) against listed major currencies today. Japanese Yen was the weakest against the Canadian Dollar.
| USD | EUR | GBP | JPY | CAD | AUD | NZD | CHF | |
|---|---|---|---|---|---|---|---|---|
| USD | 0.08% | 0.17% | 0.20% | -0.06% | 0.03% | 0.26% | 0.17% | |
| EUR | -0.08% | 0.09% | 0.11% | -0.17% | -0.03% | 0.19% | 0.09% | |
| GBP | -0.17% | -0.09% | 0.00% | -0.28% | -0.13% | 0.10% | -0.01% | |
| JPY | -0.20% | -0.11% | 0.00% | -0.27% | -0.13% | 0.07% | -0.04% | |
| CAD | 0.06% | 0.17% | 0.28% | 0.27% | 0.13% | 0.30% | 0.23% | |
| AUD | -0.03% | 0.03% | 0.13% | 0.13% | -0.13% | 0.21% | 0.11% | |
| NZD | -0.26% | -0.19% | -0.10% | -0.07% | -0.30% | -0.21% | -0.08% | |
| CHF | -0.17% | -0.09% | 0.01% | 0.04% | -0.23% | -0.11% | 0.08% |
The heat map shows percentage changes of major currencies against each other. The base currency is picked from the left column, while the quote currency is picked from the top row. For example, if you pick the Japanese Yen from the left column and move along the horizontal line to the US Dollar, the percentage change displayed in the box will represent JPY (base)/USD (quote).
The WTI Oil price has gained strongly above $96, following United States (US) President Donald Trump’s rejection of Iran’s demands after reviewing Washington’s peace proposal. Iran wants the recognition of its authority over the Strait of Hormuz, in an attempt to monetize the passage, compensation for war damages, and the release of frozen assets, according to CNN. However, there have been no comments regarding Tehran pursuing its nuclear ambitions.
A higher oil price is an unfavorable environment for the Japanese Yen, given Tokyo’s heavy reliance on oil imports to meet its energy needs.
Meanwhile, the US Dollar trades higher as rising oil prices are expected to discourage Federal Reserve (Fed) officials from easing monetary conditions this year. Going forward, investors will focus on the US Consumer Price Index (CPI) data for April, which will be released on Tuesday.
USD/JPY trades higher at around 157.00 as of writing. The pair keeps a bearish near-term tone as spot holds below the 20-day exponential moving average (EMA) at 158.02. The earlier rising support trend line, last anchored around 156.34, now sits just beneath the price and acts as the first structural floor, while the Relative Strength Index (RSI) near 43 suggests only modest downside momentum after the latest pullback.
On the topside, the 20-day EMA at 158.02 is the immediate resistance that the pair would need to reclaim to ease current downside pressure and open the way to a more sustained recovery. On the downside, a clear break below the prior uptrend support around 156.34 would expose deeper losses and signal that sellers are regaining control of the broader daily structure. Major support areas would be the February 23 low at 154 and the February 12 low at 152.27.
(The technical analysis of this story was written with the help of an AI tool.)
The Japanese Yen (JPY) is one of the world’s most traded currencies. Its value is broadly determined by the performance of the Japanese economy, but more specifically by the Bank of Japan’s policy, the differential between Japanese and US bond yields, or risk sentiment among traders, among other factors.
One of the Bank of Japan’s mandates is currency control, so its moves are key for the Yen. The BoJ has directly intervened in currency markets sometimes, generally to lower the value of the Yen, although it refrains from doing it often due to political concerns of its main trading partners. The BoJ ultra-loose monetary policy between 2013 and 2024 caused the Yen to depreciate against its main currency peers due to an increasing policy divergence between the Bank of Japan and other main central banks. More recently, the gradually unwinding of this ultra-loose policy has given some support to the Yen.
Over the last decade, the BoJ’s stance of sticking to ultra-loose monetary policy has led to a widening policy divergence with other central banks, particularly with the US Federal Reserve. This supported a widening of the differential between the 10-year US and Japanese bonds, which favored the US Dollar against the Japanese Yen. The BoJ decision in 2024 to gradually abandon the ultra-loose policy, coupled with interest-rate cuts in other major central banks, is narrowing this differential.
The Japanese Yen is often seen as a safe-haven investment. This means that in times of market stress, investors are more likely to put their money in the Japanese currency due to its supposed reliability and stability. Turbulent times are likely to strengthen the Yen’s value against other currencies seen as more risky to invest in.
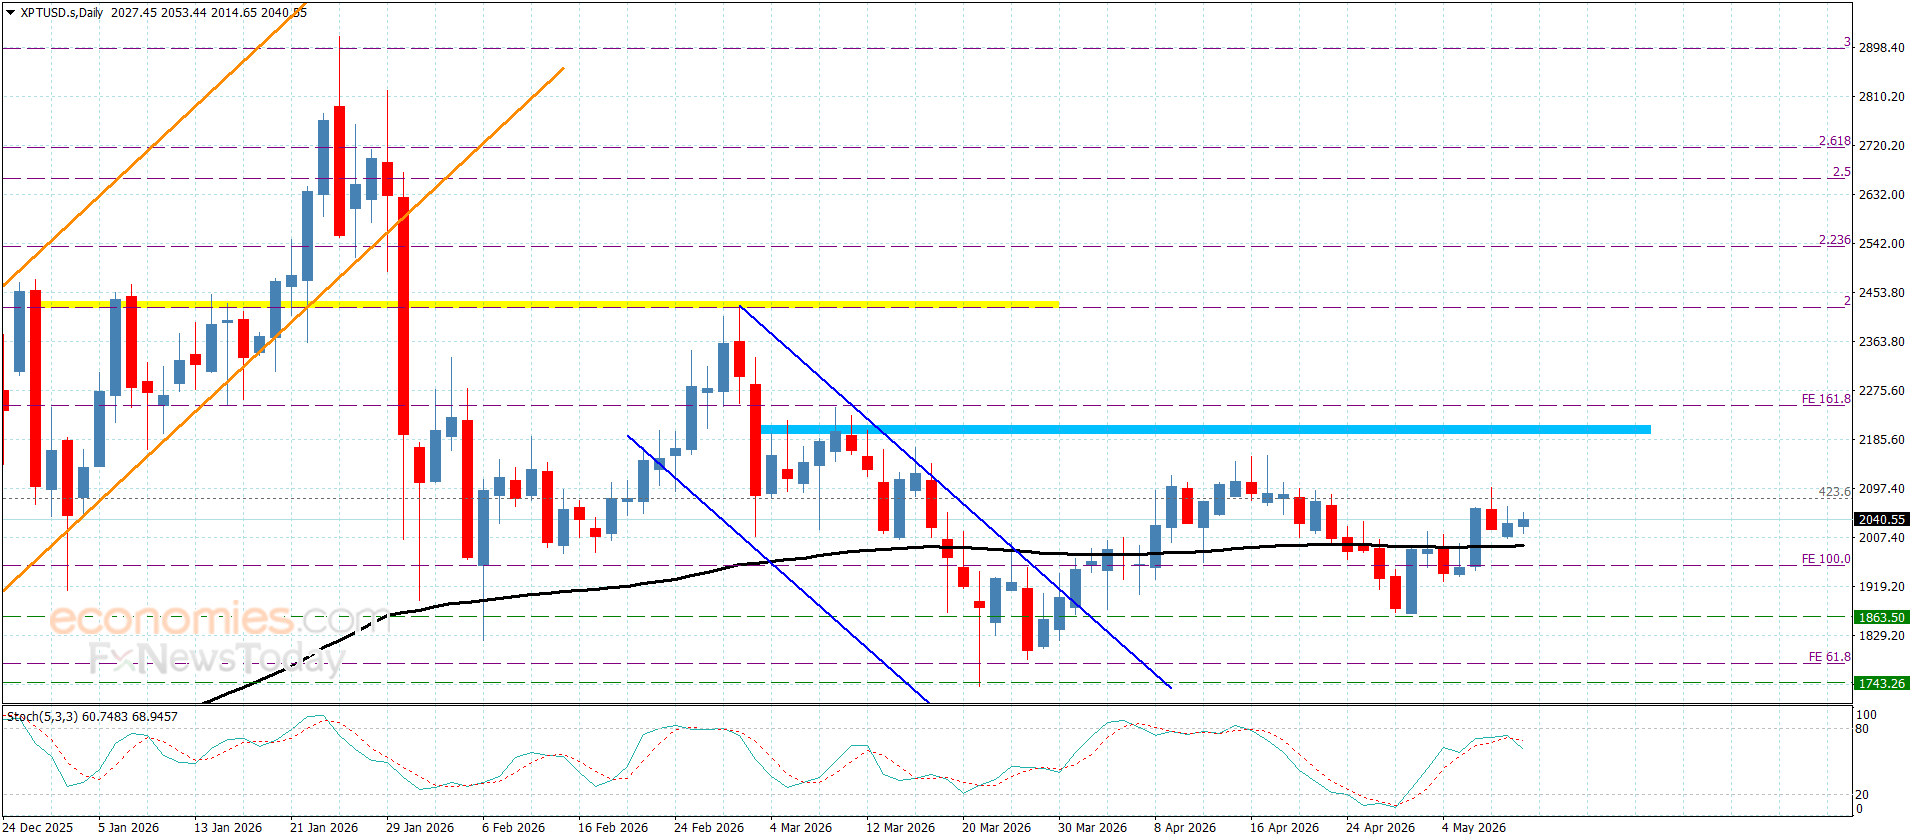
Platinum price is forced to provide weak sideways trading, affected by the stability of $2080.00 barrier, which obstructs the chances of resuming the bullish attempts, to fluctuate near $2035.00, attempting to lean above the moving average 55.
Note that the stability above the main support at $1865.00, the continuation of the attempt of forming extra support at $1950.00 level, these factors make us keep the bullish scenario, to keep waiting for surpassing the mentioned barrier, to begin recording extra gains by its rally towards $2125.00 and $2190.00.
The expected trading range for today is between $1975.00 and $2080.00
Trend forecast: Sideways
Platinum price is forced to provide weak sideways trading, affected by the stability of $2080.00 barrier, which obstructs the chances of resuming the bullish attempts, to fluctuate near $2035.00, attempting to lean above the moving average 55.
Note that the stability above the main support at $1865.00, the continuation of the attempt of forming extra support at $1950.00 level, these factors make us keep the bullish scenario, to keep waiting for surpassing the mentioned barrier, to begin recording extra gains by its rally towards $2125.00 and $2190.00.
The expected trading range for today is between $1975.00 and $2080.00
Trend forecast: Sideways
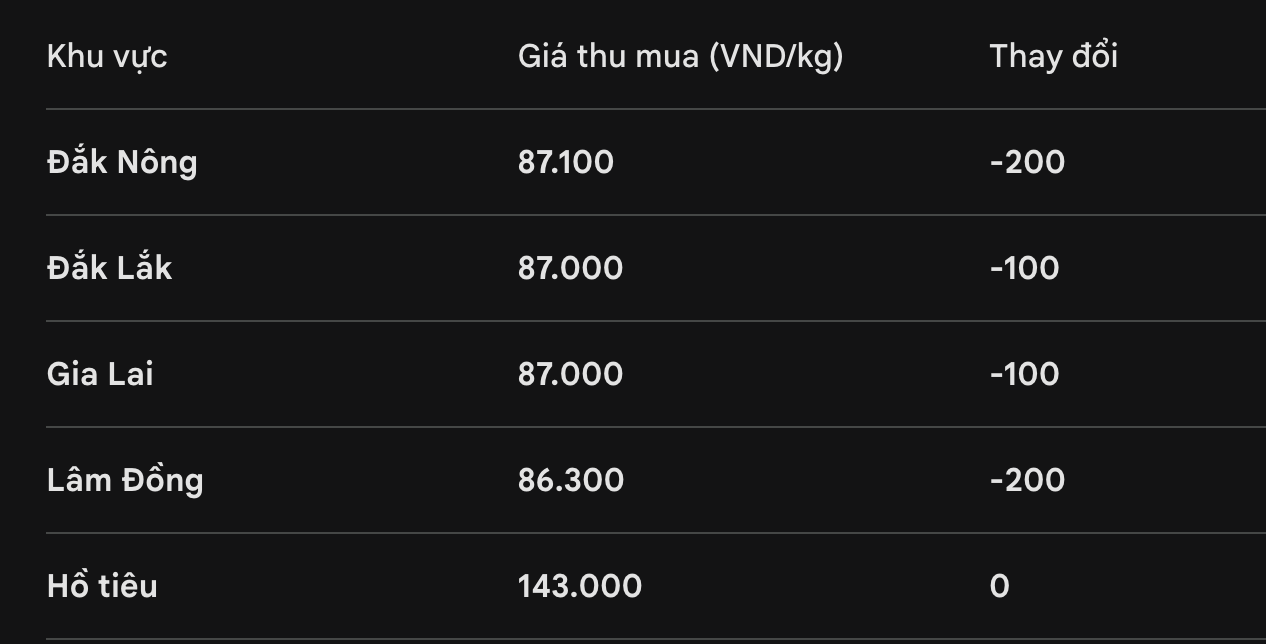
Domestic coffee prices today
Opening the first trading session of the week on May 11, 2026, domestic coffee prices continued the downward adjustment trend. After a quiet Sunday, the price level in key Central Highlands provinces has lost an additional 100 – 200 VND/kg.
World coffee prices
On futures exchanges, coffee prices are in a “mixed” state due to the impact of closing data from last weekend’s session (because Monday’s session did not have major fluctuations in order matching).
London exchange (Robusta): July term (RMN26) maintained at 3,414 USD/ton. The increase was strongly restrained by Vietnam’s export report: in the first 4 months of 2026, our country’s coffee exports reached 810,000 tons, an increase of 15.8% compared to the same period.
New York Stock Exchange (Arabica): July term (KCN26) anchored at 274.80 cents/lb. Although Arabica inventories on the ICE exchange are at a 2.5-month low (477,045 bags), Brazil’s record seasonal “ghost” (forecast to reach 75.9 million bags) is still weighing heavily on futures prices.
Coffee price assessment: Logistics bottlenecks and concerns about surplus
The current market situation is a battle between two conflicting streams of information:
The situation of the Hoarmuz Strait being closed has not shown signs of cooling down, causing transportation costs, insurance and fertilizer prices to remain very high. The actual Robusta inventory on the exchange is also at a bottom of 16.5 months with only 3,724 lots.
StoneX and Marex Group both maintained their forecast for a global surplus of 10 million bags for 2026. As Brazil begins to accelerate harvests, abundant supply will be a major challenge for price recovery momentum.
Platinum price is forced to provide weak sideways trading, affected by the stability of $2080.00 barrier, which obstructs the chances of resuming the bullish attempts, to fluctuate near $2035.00, attempting to lean above the moving average 55.
Note that the stability above the main support at $1865.00, the continuation of the attempt of forming extra support at $1950.00 level, these factors make us keep the bullish scenario, to keep waiting for surpassing the mentioned barrier, to begin recording extra gains by its rally towards $2125.00 and $2190.00.
The expected trading range for today is between $1975.00 and $2080.00
Trend forecast: Sideways