The main category of All News Articles.
You can use the search box below to find what you need.
[wd_asp id=1]
The main category of All News Articles.
You can use the search box below to find what you need.
[wd_asp id=1]
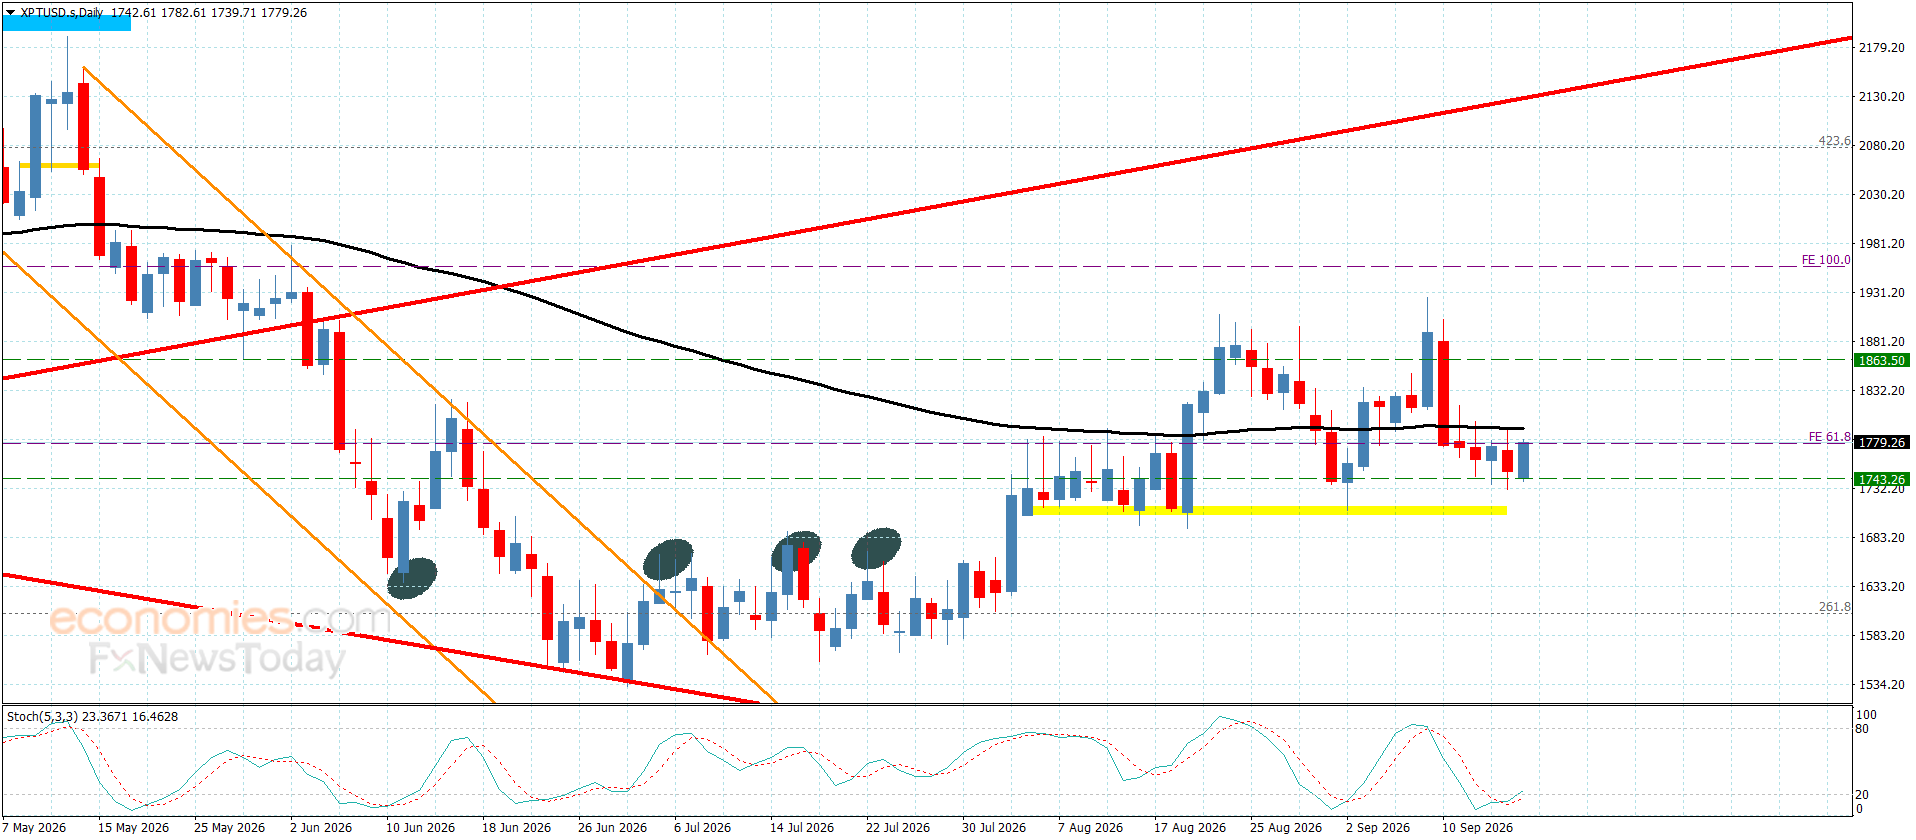
Despite platinum price continuing to trade sideways recently, its repeated hold above the $1,705.00 support level, along with stochastic attempting to provide positive momentum, may increase the chances of renewed upward attempts, with the price currently stabilizing near $1,780.00.
We emphasize the importance of the price breaking above the $1,840.00 barrier in the upcoming trading sessions and holding above it, as this would open the way toward positive targets that may begin at $1,880.00 and $1,960.00, respectively. However, failure to break above this barrier would force the price to continue trading sideways, with a renewed opportunity to test the support level.
The expected trading range for today is between $1,740.00 and $1,880.00
Trend forecast: Bullish
The pair has maintained its bearish stance, once again posting a negative close below the key 180.80 barrier. The price is currently fluctuating sideways near 179.00 as it attempts to counter the intraday positive momentum from the Stochastic indicator, increasing the chances of gathering fresh bearish momentum.
We expect that once the price successfully gathers bearish momentum, it will begin targeting the downside levels, initially moving toward 177.90, before attempting to reach further bearish targets at 177.35 and 176.70.
The expected trading range for today is between 177.90 and 179.65.
Trend forecast: Bearish
Domestic coffee prices
Coffee prices today in the domestic market reversed to decrease by at least 300 VND/kg. According to giacaphe. com, coffee prices on September 17 averaged at 94. 300 VND/kg, anchored in the price range of 93. 500-94. 400 VND/kg.
In Gia Lai and Dak Lak, coffee prices were recorded at 94. 200 VND/kg, down 300 VND/kg.
In Lam Dong, the listed coffee price is at 93.500 VND/kg, down 500 VND/kg.
The old Dak Nong area recorded the highest price in the whole region at 94,400 VND/kg, down 300 VND/kg.
The USD/VND exchange rate according to Vietcombank was recorded at 25,795 VND/USD, an increase of 25 VND/USD.
World coffee prices
In the world market, coffee prices simultaneously decreased.
According to Barchart, the September 2026 Robusta futures contract is anchored at 3,400 USD/ton, down 51 USD/ton. In the opposite direction, the November 2026 term is listed at 3,430 USD/ton, down 51 USD/ton. The term from January 2027 to May 2027 is listed in the price range of 3,384 – 3,402 USD/ton, down the most by 48 USD/ton.
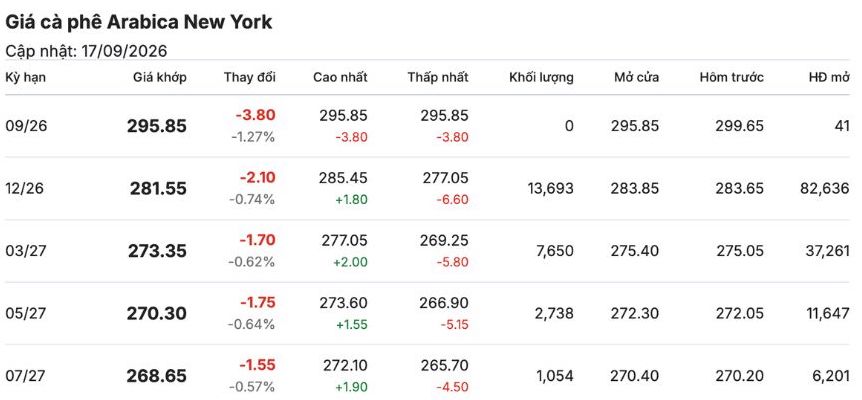
Similarly, the September 2026 Arabica futures contract continued to decline by 3.8 cents/lb, down to 295.85 cents/lb. The December 2026 term was offered to the market at 281.55 cents/lb, down 2.1 cents/lb. Further forwards were anchored in the 268.65-173.35 cent/lb range, a decrease of 1.55-1.70 cents/lb.
Assessments and forecasts
The inventory factor is currently a factor hindering the decline of coffee. Arabica coffee on the ICE exchange increased to 233,479 bags by the end of September 16, thereby leaving the 27-year low of 217,646 bags but not creating a truly abundant supply, according to ICE’s daily report. ICE added that 16,210 bags have passed quality accreditation to be included in certified inventory, while 2,960 bags do not meet requirements.
Favorable weather conditions in Brazil and Vietnam are also putting pressure on coffee prices. Rainfall higher than normal in Brazil during the current important flowering period may support the 2026-2027 coffee crop, thereby creating downward pressure on prices.
If Brazil’s key Arabica coffee growing region has recorded rainfall suitable for the development and fruiting of coffee trees. In Vietnam, the weather forecasting agency also said that abundant rainfall has improved soil moisture and is expected to support the coffee fruit development process in the Central Highlands region, the largest Robusta coffee production region in the country.
In the long term, the coffee market has been under pressure in the past three weeks due to the prospect of abundant global supply. In its latest report, the International Coffee Organization (ICO) forecasts record global coffee production and market surplus.
According to ICO, global coffee production in the 2025-2026 crop year is estimated to increase by 4.4% compared to the previous crop year to a record 183.6 million bags, while consumption decreased by 0.9% to 180.6 million bags. This caused output to exceed demand by about 3 million bags, the market fell into a state of oversupply for the first time after 4 years.
– Written by
David Woodsmith
STORY LINK Pound-to-Dollar News, Forecast: GBP/USD Holds Near Lows after Hawkish Fed Hike
The Pound US Dollar (GBP/USD) exchange rate remained close to recent lows on Wednesday evening after the Federal Reserve raised interest rates by 25 basis points.
At the time of writing, GBP/USD was trading at around $1.3470, leaving the pairing little changed overall from earlier in the session.
The US Dollar (USD) held firm on Wednesday after the Federal Reserve raised its benchmark interest rate to 3.75%-4.00%.
The decision was unanimous and marked the Fed’s first interest rate increase since 2023.
With the 25-basis-point hike already heavily priced in, attention centred on the central bank’s updated projections and accompanying guidance for clues over the future path of US monetary policy.
Policymakers signalled that another quarter-point increase remains likely before the end of the year, while Fed Chair Kevin Warsh stressed that inflation remains too high and that underlying price trends have not improved sufficiently.
Get better rates and lower fees on your next international money transfer.
Compare TorFX with top UK banks in seconds and see how much you could save.
Persistent inflationary pressures, elevated oil prices and relatively resilient economic data have strengthened expectations that the Fed could continue tightening monetary policy.
Warsh nevertheless continued to avoid firm forward guidance, leaving future decisions dependent on incoming inflation and labour-market data.
The relatively hawkish message helped the US Dollar retain support following the announcement.
The Pound (GBP) struggled to find a clear direction against its major counterparts on Wednesday following the release of the latest UK inflation figures.
Data from the Office for National Statistics (ONS) showed that annual headline inflation accelerated from 2.9% to 3.1% in August, matching market expectations.
The increase was largely driven by higher energy prices, which have risen sharply after briefly easing during July.
Despite this, there was limited evidence of broader inflationary pressure building elsewhere in the UK economy.

Core inflation remained unchanged at 2.6% in August, while services inflation also remained contained.
As a result, Sterling showed little reaction to the figures, with analysts suggesting the latest inflation reading is unlikely to materially alter expectations surrounding the Bank of England’s upcoming policy decision.
Looking ahead to Thursday, attention will turn to the Bank of England’s latest interest rate announcement for the next major catalyst for the Pound to US Dollar exchange rate.
The BoE is widely expected to leave interest rates unchanged when policymakers announce their decision at midday.
With the rate decision largely anticipated, the vote split and accompanying guidance are likely to attract the most attention.
A cautious assessment of the economic outlook could weigh on Sterling if it signals limited appetite for further monetary tightening.
Conversely, stronger warnings over the inflationary impact of elevated energy prices could revive expectations for another BoE rate hike later this year and provide the Pound with some support.
Meanwhile, the latest US initial jobless claims figures could also influence the Dollar.
A renewed increase in unemployment claims may temper some of the support generated by the Fed’s hawkish policy message.
International Money Transfer? Ask our resident FX expert a money transfer question or try John’s new, free, no-obligation personal service! ,where he helps every step of the way,
ensuring you get the best exchange rates on your currency requirements.
TAGS: Pound Dollar Forecasts
U.S. inventory data also added further pressure on prices. Crude stocks dropped by only 640,000 barrels last week compared with expectations for the decline of 1.62 million barrels. The smaller draw suggests that the domestic supply is not tightening as quickly as expected. It also encouraged profit taking after the oil price reached near the $110 level earlier this week.
In my view, the alternative export route for Saudi Arabia may limit gains in oil prices in the short term. But fresh attacks or prolonged disruption at Yanbu could quickly push oil prices higher again.
Today, traders had a chance to take a look at the Retail Sales report for August. The report indicated that Retail Sales increased by +1.2% month-over-month, compared to analyst forecast of +0.8%.
NAHB Housing Market Index declined from 35 in August to 32 in September, compared to analyst consensus of 32. Higher interest rates put pressure on builder sentiment.
The nearest resistance level for U.S. Dollar Index is located in the 99.85 – 100.00 range. In case U.S. Dollar Index manages to settle above the 100.00 level, it will head towards the next resistance, which is located in the 100.50 – 100.65 range.
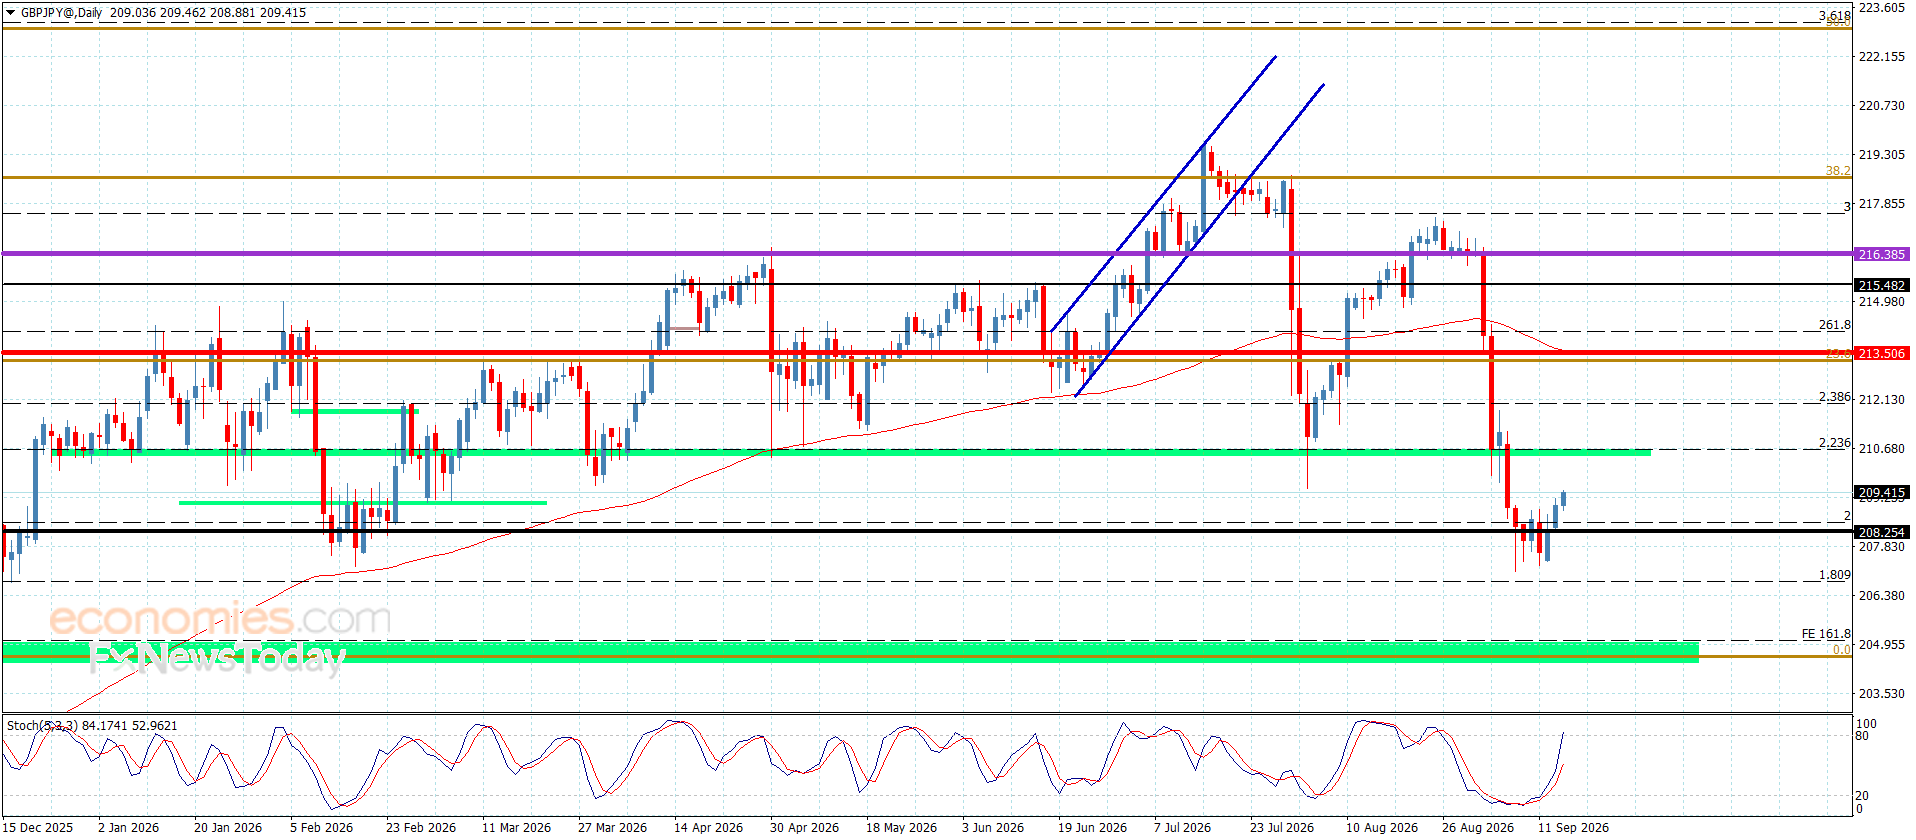
The GBPJPY pair activated with stochastic positivity since yesterday, forming some bullish corrective waves to recover some losses to reach 209.45, noting that the stability below 210.40 barrier confirms the continuation of the negativity in the upcoming trading, which makes us wait for gathering negative momentum, to begin targeting negative stations by reaching 208.10 followed by 206.85.
While breaching the previously mentioned barrier and holding above it will reinforce the chances of building a new bullish trend, expecting 211.50 and 212.10 level initially.
The expected trading range for today is between 208.10 and 210.00
Trend forecast: Bearish
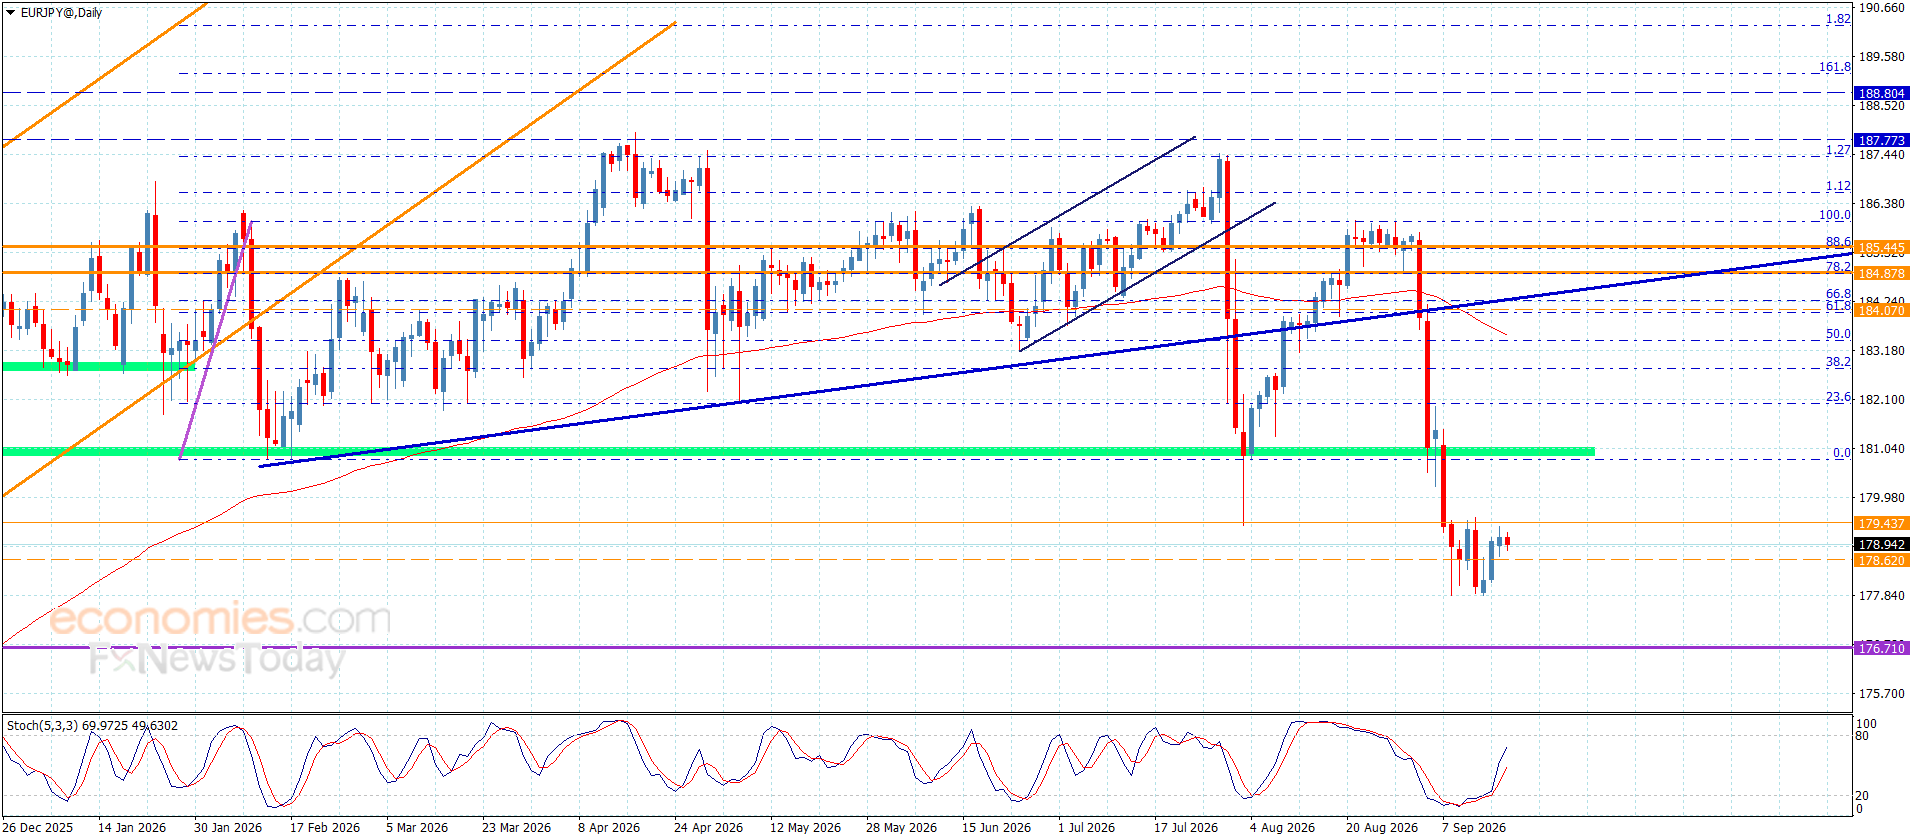
The EUR/JPY pair is quietly trying to find a bottom. With the Bank of Japan on Friday, this could be an interesting setup.
The euro has bounced a bit against the Japanese yen, as we have seen broad yen weakness over the last day or two. This pair has found the ¥178 level as a potential floor in the market, and that might be something worth watching because, quite frankly, this market has been sold off just as aggressively as all the other yen-denominated pairs.

With traders now thinking that the Japanese are going to tighten aggressively, and with intervention floating around the markets as well, it is not a huge surprise to see that we fell here. The Stochastic Oscillator says we are in oversold conditions. We are starting to turn in the other direction, but the real determinant here will be the Bank of Japan decision on Friday.
That in and of itself will not be the surprise. The surprise will probably come in the form of the press conference or even the statement. If they sound overly hawkish, that could be ugly for this pair and anything else denominated in yen.
But having said that, it is worth noting that the Japanese debt load is massive. It is the largest one in the developed world, and therefore higher interest rates really come at a price for the Japanese. This is a situation where they have to show markets that they are willing to defend their currency, but at the same time, they are going to have to deal with higher rates on that massive debt load. It makes the Americans look quite frugal, to be honest with you.
So, I am watching this one. I am looking for a little bit of a rise. We have seen the U.S. dollar pop up against the Japanese yen and break a little bit of structure over the last couple of days. So, we will see if this one can follow.
Begin trading our daily forecasts and analysis. Here is a list of Forex brokers in Japan to work with.
Christopher Lewis is a technical analyst and market commentator at DailyForex with more than two decades of trading experience in Forex and other leveraged markets. Based in Columbus, Ohio, he specializes in chart-based analysis of major currency pairs, stock indices, commodities, and energy markets, focusing on clear support and resistance levels, trend structure, and risk management. Christopher produces daily written and video analysis for traders who rely on technical setups to navigate volatile market conditions
As seen on: Pairs Of Aces Podcast,The Trader Guy, FXEmpire
Domestic coffee prices
Coffee prices today in the domestic market increased again, averaging an increase of 200,000 VND/kg. According to giacaphe. com, coffee prices on September 15th averaged at 95,400 VND/kg, anchored in the price range of 94,900-95,500 VND/kg.
In Gia Lai and Dak Lak, coffee prices were recorded at 95,400 VND/kg, an increase of 200 VND/kg.
In Lam Dong, the listed coffee price is at 94. 900 VND/kg, an increase of 200 VND/kg.
The old Dak Nong area recorded the highest price in the whole region at 95,500 VND/kg.
The USD/VND exchange rate according to Vietcombank is recorded at 25,790 VND/USD.
World coffee prices
In the world market, coffee prices reversed to decrease.
According to Barchart, the September 2026 Robusta futures contract anchored at 3,505 USD/ton, holding at 10 USD/ton. In the opposite direction, the November 2026 futures were listed at 3,481 USD/ton, down 54 USD/ton. The term from January 2027 to May 2027 was listed in the price range of 3,420 – 3,450 USD/ton, down the most by 72 USD/ton.
Similarly, the September 2026 Arabica futures contract reversed to decrease by 7.7 cents/lb, holding at the 299.65 cent/lb mark. The December 2026 term is offered to the market at 283.65 cents/lb, down 6.85 cents/lb. Further forwards are anchored in the 270.20 – 275.05 cent/lb range, a decrease of 5.55-6.25 cents/lb.
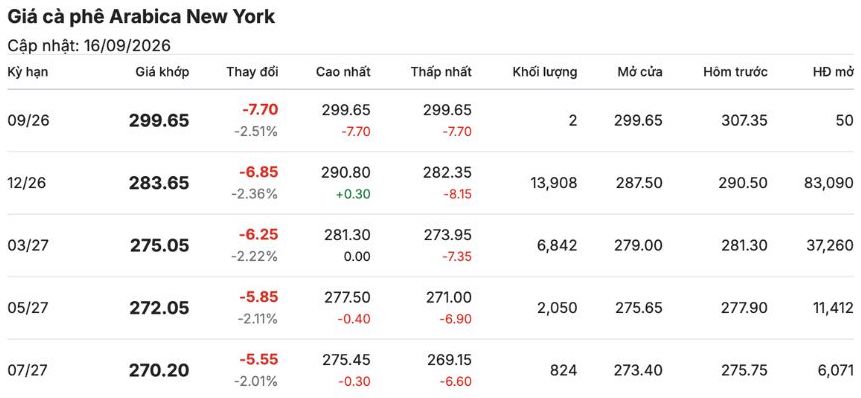
Assessments and forecasts
Coffee prices closed down yesterday due to favorable farming conditions in Brazil and Vietnam. Rainfall higher than normal in Brazil during the current important flowering period may support the 2026/27 coffee harvest, thereby becoming a factor putting downward pressure on prices.
In Vietnam, abundant rainfall has improved soil moisture and may support the coffee fruit development process in the Central Highlands region, the largest coffee production region in the country.
In the first trading session of the week, Arabica prices fell to a 2.5-month low due to negative impacts from Thursday’s session last week, when Cecafe said Brazil’s total coffee exports in August increased by 31% over the same period last year, to 4.155 million bags, a record high in August. Arabica exports in August increased by 26%, to 2.87 million bags, while Robusta exports increased by 54%, to 953,592 bags. Brazilian coffee is being brought to the export market as the harvest in this country ends.
EUR/USD traded at 1.1548 on the 4-hour chart after a sharp decline from the 1.1645 level. Price is below both moving averages and a descending trendline and the latest move has price trading below the 1.1554–1.1559 resistance level. This structure remains bearish despite a pause of sellers at support.
The level to watch first is 1.1556. A break above this level opens 1.1573, then 1.1589 and 1.1604. Support is found at 1.1523, but should selling pressure return, 1.1501 and 1.1484 will become more relevant.
RSI is showing an initial recovery from oversold, but still remains in the lower range, which shows the correction is likely still a correction. My view for now is slightly bearish while EUR/USD is trading below 1.1556-1.1573. A break above 1.1589 calls for a revision of this view. A break below 1.1523 argues more selling pressure should be expected to drive the price lower.