The main category of All News Articles.
You can use the search box below to find what you need.
[wd_asp id=1]
The main category of All News Articles.
You can use the search box below to find what you need.
[wd_asp id=1]
Domestic coffee prices
The domestic coffee market opened the first session of the week on April 20 with a slight simultaneous increase in key growing areas of the Central Highlands.
According to records, the purchase price has increased by another 300 VND/kg, bringing the average price level of the whole region to the threshold of 85,400 VND/kg.
Specifically, in Dak Nong province (old), coffee prices are currently maintaining the highest level in the region at 85,500 VND/kg. Dak Lak and Gia Lai localities both maintain stable trading levels at the 85,300 VND/kg mark.
Meanwhile, in Lam Dong province, the listed coffee price is 84,800 VND/kg. Although it increased slightly this morning, compared to the price level before the holiday, the market is still making efforts to accumulate to compensate for previous deep declines.
World coffee prices
Developments on international exchanges in the closing session last weekend recorded a deep red color due to positive changes in geopolitics.
On the London exchange, Robusta futures for May 2026 delivery fell by 86 USD (equivalent to 2.48%), closing the session at 3,388 USD/ton. At the same time, the New York exchange witnessed Arabica prices fall sharply by 7.15 cents (equivalent to 2.41%), closing at 289.30 cents/lb.
The direct cause of this fall was an announcement from Iran about the official reopening of the Strait of Hormuz. This news immediately relieved concerns about disruptions to the global supply chain, restored sea transport flows and reduced pressure on insurance and fuel costs that had pushed coffee prices up before.
In addition to geopolitical factors, the pressure of future supply surplus continues to be a ghost weighing on futures prices. StoneX organization has just raised its forecast for global coffee surplus in 2026 to 10 million bags, the highest level in the past 6 years. This forecast is based on the “super crop” outlook of Brazil with production in the 2026/27 crop year expected to reach a record 75.9 million bags according to Marex Group Plc, an increase of 15.5% compared to the previous year. In addition, Vietnam’s export figures in the first quarter increased sharply by 14%, reaching 585,000 tons, further strengthening the pessimistic sentiment towards supply for the Robusta line in the international market.
However, the market still has support points to stop the deep decline. Robusta inventories on the ICE exchange have fallen to the lowest level in the past 16 months, with only 3,838 lots left as of last Friday. At the same time, the weather situation in Brazil is also showing negative signs when rainfall in the Minas Gerais region reached only 4.2 mm, equivalent to 20% of the historical average. This drought, if prolonged, could reduce actual yields, completely contrary to record production forecasts on paper. In Brazil, green coffee bean exports in March also recorded a decrease of 10% compared to the same period, showing that supply from this country is not as abundant as expected.
It is forecasted that in the coming sessions, coffee prices will continue to be strongly fluctuating around the 84,500 – 86,000 VND/kg range as investors balance the news of transport route clearance in Hormuz and the stockpile situation at the London floor which is at the bottom.
The actual prices at the purchasing yards may change depending on the area and specific agreements.
Oil price today is hovering around $96.26 per barrel (Brent crude), down slightly from yesterday but still significantly higher year-on-year. Despite recent dips, oil remains volatile due to geopolitical tensions, supply disruptions, and shifting global demand.
As of this evening, the oil price today reflects a fragile equilibrium:
The brent crude oil price remains the global benchmark and continues to dictate broader oil prices today across international markets.
The crude oil price today sits below the psychological $100 mark, but the broader trend shows persistent instability:
This reinforces a key reality: oil price today is no longer just economic—it is geopolitical.
Several forces are driving the current oil price volatility:
Tensions in the Middle East—especially around the Strait of Hormuz (which carries ~20% of global oil)—are triggering rapid price swings.
The U.S. Strategic Petroleum Reserve continues to act as a shock absorber, but only temporarily.
Even as oil prices today fluctuate, consumers don’t see immediate relief.
Crude oil accounts for over 50% of pump prices, but due to supply chain layers:
When the oil price today rises:
The two energy markets are tightly connected, meaning energy inflation spreads fast across sectors.
The brent crude oil price has always been shaped by shocks:
Conclusion:
Oil price today is part of a long cycle of instability driven by war, policy, and economics.
There’s no certainty—but key triggers include:
If supply tightens further, oil could retest $100+ levels quickly.
The current oil price today trend has worldwide consequences:
Oil is not just a commodity—it’s a global economic signal.
For real-time updates and deeper insights, tracking oil price today alongside trends like brent crude oil price movements and forecasts such as will oil hit $100 again is critical for investors and policymakers navigating this volatile energy landscape.
As things stand right now, I think you have to look at this as a market that you have to wait and see. The British pound, in general, has been stronger than many other currencies against the dollar, and that could very well continue to be the case.
If you’d like to know more about how to trade forex, please visit our educational area.
Gold traded
at $4,793 per ounce on Monday, April 20, 2026, falling 0.9% after the US Navy
seized an Iranian-flagged cargo vessel in the Gulf of Oman, sending Brent crude
up 5.33% to $95.20 and reigniting the inflation concerns that have pinned
bullion inside a month-long consolidation range.
Spot
XAU/USD sits roughly 14% below the $5,595 all-time high set on January 29 and
has failed three times at $4,800 resistance reinforced by the 50-day EMA. For
the first time since the February peak, the primary gold price prediction
question is no longer “how high,” but “how low can gold
go.”
Three
catalysts define this week: the US-Iran ceasefire expires Wednesday, the Fed’s
preferred PCE inflation print lands Friday, and Strait of Hormuz transits
collapsed to zero on Sunday from a pre-war daily average of 138.
Follow
me on X for real-time gold market analysis: @ChmielDk
“Gold
was under pressure on Monday as rising uncertainty over the geopolitical
situation in the Middle East lifted oil prices and reignited inflation
concerns,” said Konstantinos Chrysikos, Head of Customer Relationship
Management at Kudotrade.
The USS
Spruance intercepted the Iranian-flagged Touska over the weekend, with US
Marines taking custody after warnings to stop were ignored. Iran shut the
Strait of Hormuz again on Saturday, citing US breaches of the ceasefire, and
redirected at least 25 commercial vessels away from Iranian ports.
The selloff
runs through the monetary channel before it runs through flows. Energy prices
are pushing Treasury yields higher across maturities, raising the opportunity
cost of holding non-yielding bullion. The Dollar Index climbed to 98.47, making
gold more expensive for non-dollar buyers and capping the safe-haven bid that
would normally emerge from an active naval standoff.
Flow data
is the softer pillar. Gold-backed ETFs recorded two consecutive weeks of
inflows through mid-April after March produced the largest monthly outflows in
five years, but a sustained rise in yields puts that bid back at risk.
“While
ongoing central bank purchases and persistent tensions in Eastern Europe
provide a longer-term floor, sustained strength in yields and the dollar could
keep the metal under pressure in the near term,” Chrysikos added.
As I wrote
in my previous UBP analysis, the Swiss private bank lifted gold
exposure back to 6% of discretionary portfolios from an Iran-war low of 3%,
reinforcing the structural floor argument even as near-term pressure builds.
The four
drivers weighing on gold price today:
My chart
structure has not changed in three weeks. Gold remains trapped in a
consolidation bounded by the October 2025 breakout zone at $4,281 to $4,368 on
the downside and $4,800 resistance reinforced by the 50-day EMA on the upside.
Gold tried to break the $4,800 cap at the end of last week and failed, printing
a rejection candle that resolved into today’s 0.9% decline. My bias inside the
range has shifted from neutral to mildly bearish after that third failed test.
Here is
where “how low can gold go” gets specific. My Fibonacci extension,
stretched across the correction from the January all-time high and the current
March-April rebound, places the 100% extension at approximately $3,400 per
ounce. That target is not arbitrary. The $3,400 zone acted as resistance from
April through August 2025 before bullion broke out into the parabolic autumn
move that eventually carried price to $5,595.
Old
resistance retested as support, if it fails, typically draws price back to its
original breakout level. A 28% decline from the current $4,793 spot sounds
extreme, but as I established in my earlier Fibonacci analysis, the same extension math that
framed the upside target at $7,000-plus also frames the downside risk with
equal validity.
A downside
break of the $4,281 floor on a weekly close would confirm the bearish scenario.
An upside break of $4,800 on strong volume opens $5,400 as the next resistance,
which was the closing high on January 28 and still represents the highest ever
daily close for gold. Until one side breaks with conviction, the $4,281 to
$4,800 range remains the operating framework.
How low can gold go? Source: Tradingview.com
|
Level |
Type |
Notes |
|
$5,400 |
Resistance |
January |
|
$4,800 |
Resistance |
50-day |
|
$4,793 |
Spot |
Monday, April 20, 2026 |
|
$4,368 |
Support |
Upper October 2025 breakout zone |
|
$4,281 |
Support |
Lower |
|
$3,400 |
Bearish target |
100% |
External
forecasts for year-end 2026 span an unusually wide range, reflecting genuine
disagreement about whether the March crash cleared excess leverage or marked a
structural top. As the FinanceMagnates.com February gold
report detailed, a
Reuters poll of 30 analysts placed the median 2026 gold forecast at $4,746.50
per ounce, roughly 1% below today’s spot.
On the bull
side, JPMorgan holds the highest major-bank target at $6,300, built on
approximately 800 tonnes of projected central-bank buying. Deutsche Bank and
UBP both target $6,000. Goldman Sachs maintains $5,400 despite March’s worst
monthly decline since 2013, with analysts Daan Struyven and Lina Thomas arguing
that the buyers who drove the 2025 rally have not left and do not need a new
wave of participants to hit the target, as I wrote in my earlier Goldman analysis. UBS sits at $5,600 but has flagged
the move as the late stage of the bull cycle, according to precious-metals
strategist Joni Teves.
The bear
framework is narrower but credible. State Street assigns 20% probability to a
$4,000 to $4,750 year-end range, flagging $4,000 to $4,100 as the structural
floor. As I wrote in my previous WGC analysis, the World Gold Council’s Reflation
Return scenario models a 5% to 20% decline to $3,360 to $3,990 if Trump’s
reflation policies succeed and the Fed stays restrictive. My $3,400 Fibonacci
target sits squarely inside that institutional bear zone.
|
Source |
Target |
Notes |
|
JPMorgan |
$6,300 |
Year-end |
|
UBP / Deutsche Bank |
$6,000 |
Year-end 2026, structural revaluation |
|
UBS |
$5,600 |
Year-end |
|
Goldman Sachs |
$5,400 |
Year-end |
|
Reuters poll median |
$4,746.50 |
2026 average, 30-analyst survey |
|
State Street |
$4,000 |
20% |
|
World Gold Council |
$3,360-$3,990 |
Reflation Return scenario, 5-20% decline |
|
My Fibonacci target |
$3,400 |
100% extension if $4,281 breaks |
My
Fibonacci extension projects a 28% drop to $3,400 per ounce if gold breaks
below the $4,281 October 2025 support. State Street assigns 20% probability to
a $4,000 to $4,750 year-end range, flagging $4,000 to $4,100 as the structural
floor. The World Gold Council’s Reflation Return scenario models $3,360 to
$3,990. A weekly close below $4,281 confirms the bearish path.
Gold fell
0.9% to $4,793 on Monday, April 20, 2026, after the US Navy seized an Iranian
cargo vessel in the Gulf of Oman. Brent crude surged 5.33% to $95.20, pushing
Treasury yields higher and the Dollar Index to 98.47. Rising yields raise the
opportunity cost of holding non-yielding bullion, while the stronger dollar
makes gold more expensive for non-dollar buyers.
Institutional
forecasts span $4,000 to $6,300 for year-end 2026. JPMorgan targets $6,300, UBP
and Deutsche Bank $6,000, UBS $5,600, Goldman Sachs $5,400. State Street flags
$4,000 as the bear-case floor with 20% probability. The Reuters poll median
across 30 analysts sits at $4,746.50 per ounce for the 2026 average, roughly 1%
below current spot.
A confirmed
weekly close below $4,281 invalidates the October 2025 breakout and opens the
200-day moving average near $4,260 as the next test. Below that cluster, my
Fibonacci extension targets $3,400, the same zone that capped price between
April and August 2025. State Street views $4,000 to $4,100 as the structural
bull-bear dividing line for year-end 2026.
Technically,
yes. Gold remains up roughly 40% year-over-year and 14% below the January
$5,595 all-time high, but still trading inside a multi-month consolidation
rather than a confirmed downtrend. A weekly close below $4,281 would be the
first major warning sign. As I wrote in my March crash analysis, the $4,200 to $4,280 zone is the
bull-bear line.
Gold traded
at $4,793 per ounce on Monday, April 20, 2026, falling 0.9% after the US Navy
seized an Iranian-flagged cargo vessel in the Gulf of Oman, sending Brent crude
up 5.33% to $95.20 and reigniting the inflation concerns that have pinned
bullion inside a month-long consolidation range.
Spot
XAU/USD sits roughly 14% below the $5,595 all-time high set on January 29 and
has failed three times at $4,800 resistance reinforced by the 50-day EMA. For
the first time since the February peak, the primary gold price prediction
question is no longer “how high,” but “how low can gold
go.”
Three
catalysts define this week: the US-Iran ceasefire expires Wednesday, the Fed’s
preferred PCE inflation print lands Friday, and Strait of Hormuz transits
collapsed to zero on Sunday from a pre-war daily average of 138.
Follow
me on X for real-time gold market analysis: @ChmielDk
“Gold
was under pressure on Monday as rising uncertainty over the geopolitical
situation in the Middle East lifted oil prices and reignited inflation
concerns,” said Konstantinos Chrysikos, Head of Customer Relationship
Management at Kudotrade.
The USS
Spruance intercepted the Iranian-flagged Touska over the weekend, with US
Marines taking custody after warnings to stop were ignored. Iran shut the
Strait of Hormuz again on Saturday, citing US breaches of the ceasefire, and
redirected at least 25 commercial vessels away from Iranian ports.
The selloff
runs through the monetary channel before it runs through flows. Energy prices
are pushing Treasury yields higher across maturities, raising the opportunity
cost of holding non-yielding bullion. The Dollar Index climbed to 98.47, making
gold more expensive for non-dollar buyers and capping the safe-haven bid that
would normally emerge from an active naval standoff.
Flow data
is the softer pillar. Gold-backed ETFs recorded two consecutive weeks of
inflows through mid-April after March produced the largest monthly outflows in
five years, but a sustained rise in yields puts that bid back at risk.
“While
ongoing central bank purchases and persistent tensions in Eastern Europe
provide a longer-term floor, sustained strength in yields and the dollar could
keep the metal under pressure in the near term,” Chrysikos added.
As I wrote
in my previous UBP analysis, the Swiss private bank lifted gold
exposure back to 6% of discretionary portfolios from an Iran-war low of 3%,
reinforcing the structural floor argument even as near-term pressure builds.
The four
drivers weighing on gold price today:
My chart
structure has not changed in three weeks. Gold remains trapped in a
consolidation bounded by the October 2025 breakout zone at $4,281 to $4,368 on
the downside and $4,800 resistance reinforced by the 50-day EMA on the upside.
Gold tried to break the $4,800 cap at the end of last week and failed, printing
a rejection candle that resolved into today’s 0.9% decline. My bias inside the
range has shifted from neutral to mildly bearish after that third failed test.
Here is
where “how low can gold go” gets specific. My Fibonacci extension,
stretched across the correction from the January all-time high and the current
March-April rebound, places the 100% extension at approximately $3,400 per
ounce. That target is not arbitrary. The $3,400 zone acted as resistance from
April through August 2025 before bullion broke out into the parabolic autumn
move that eventually carried price to $5,595.
Old
resistance retested as support, if it fails, typically draws price back to its
original breakout level. A 28% decline from the current $4,793 spot sounds
extreme, but as I established in my earlier Fibonacci analysis, the same extension math that
framed the upside target at $7,000-plus also frames the downside risk with
equal validity.
A downside
break of the $4,281 floor on a weekly close would confirm the bearish scenario.
An upside break of $4,800 on strong volume opens $5,400 as the next resistance,
which was the closing high on January 28 and still represents the highest ever
daily close for gold. Until one side breaks with conviction, the $4,281 to
$4,800 range remains the operating framework.
How low can gold go? Source: Tradingview.com
|
Level |
Type |
Notes |
|
$5,400 |
Resistance |
January |
|
$4,800 |
Resistance |
50-day |
|
$4,793 |
Spot |
Monday, April 20, 2026 |
|
$4,368 |
Support |
Upper October 2025 breakout zone |
|
$4,281 |
Support |
Lower |
|
$3,400 |
Bearish target |
100% |
External
forecasts for year-end 2026 span an unusually wide range, reflecting genuine
disagreement about whether the March crash cleared excess leverage or marked a
structural top. As the FinanceMagnates.com February gold
report detailed, a
Reuters poll of 30 analysts placed the median 2026 gold forecast at $4,746.50
per ounce, roughly 1% below today’s spot.
On the bull
side, JPMorgan holds the highest major-bank target at $6,300, built on
approximately 800 tonnes of projected central-bank buying. Deutsche Bank and
UBP both target $6,000. Goldman Sachs maintains $5,400 despite March’s worst
monthly decline since 2013, with analysts Daan Struyven and Lina Thomas arguing
that the buyers who drove the 2025 rally have not left and do not need a new
wave of participants to hit the target, as I wrote in my earlier Goldman analysis. UBS sits at $5,600 but has flagged
the move as the late stage of the bull cycle, according to precious-metals
strategist Joni Teves.
The bear
framework is narrower but credible. State Street assigns 20% probability to a
$4,000 to $4,750 year-end range, flagging $4,000 to $4,100 as the structural
floor. As I wrote in my previous WGC analysis, the World Gold Council’s Reflation
Return scenario models a 5% to 20% decline to $3,360 to $3,990 if Trump’s
reflation policies succeed and the Fed stays restrictive. My $3,400 Fibonacci
target sits squarely inside that institutional bear zone.
|
Source |
Target |
Notes |
|
JPMorgan |
$6,300 |
Year-end |
|
UBP / Deutsche Bank |
$6,000 |
Year-end 2026, structural revaluation |
|
UBS |
$5,600 |
Year-end |
|
Goldman Sachs |
$5,400 |
Year-end |
|
Reuters poll median |
$4,746.50 |
2026 average, 30-analyst survey |
|
State Street |
$4,000 |
20% |
|
World Gold Council |
$3,360-$3,990 |
Reflation Return scenario, 5-20% decline |
|
My Fibonacci target |
$3,400 |
100% extension if $4,281 breaks |
My
Fibonacci extension projects a 28% drop to $3,400 per ounce if gold breaks
below the $4,281 October 2025 support. State Street assigns 20% probability to
a $4,000 to $4,750 year-end range, flagging $4,000 to $4,100 as the structural
floor. The World Gold Council’s Reflation Return scenario models $3,360 to
$3,990. A weekly close below $4,281 confirms the bearish path.
Gold fell
0.9% to $4,793 on Monday, April 20, 2026, after the US Navy seized an Iranian
cargo vessel in the Gulf of Oman. Brent crude surged 5.33% to $95.20, pushing
Treasury yields higher and the Dollar Index to 98.47. Rising yields raise the
opportunity cost of holding non-yielding bullion, while the stronger dollar
makes gold more expensive for non-dollar buyers.
Institutional
forecasts span $4,000 to $6,300 for year-end 2026. JPMorgan targets $6,300, UBP
and Deutsche Bank $6,000, UBS $5,600, Goldman Sachs $5,400. State Street flags
$4,000 as the bear-case floor with 20% probability. The Reuters poll median
across 30 analysts sits at $4,746.50 per ounce for the 2026 average, roughly 1%
below current spot.
A confirmed
weekly close below $4,281 invalidates the October 2025 breakout and opens the
200-day moving average near $4,260 as the next test. Below that cluster, my
Fibonacci extension targets $3,400, the same zone that capped price between
April and August 2025. State Street views $4,000 to $4,100 as the structural
bull-bear dividing line for year-end 2026.
Technically,
yes. Gold remains up roughly 40% year-over-year and 14% below the January
$5,595 all-time high, but still trading inside a multi-month consolidation
rather than a confirmed downtrend. A weekly close below $4,281 would be the
first major warning sign. As I wrote in my March crash analysis, the $4,200 to $4,280 zone is the
bull-bear line.
– Written by
David Woodsmith
STORY LINK Euro to Dollar Week Ahead Forecast: EUR/USD Hits 6-Week Best
The Euro to Dollar exchange rate (EUR/USD) has pushed above 1.1800 to six-week highs, as the dollar weakened amid easing geopolitical tensions and renewed doubts over US policy credibility.
While markets have priced in optimism over a potential Iran resolution, analysts warn that near-term upside may be limited, even as the broader outlook remains tilted towards further EUR/USD gains.
ING is still backing year-end Euro-to Dollar (EUR/USD) gains to 1.20
Nordea is forecasting stronger EUR/USD gains to 1.25 at the end of this year.
EUR/USD secured net gains to a 6-week above 1.18 with the dollar index at the lowest level since early March. Markets overall took an optimistic stance on the Iran conflict with hopes that a ceasefire would be extended with progress towards a more decisive deal.
There is still a high degree of uncertainty over the Iran situation. Rabobank commented; “EU and GCC officials have predicted that a deal between the US and Iran may take close to 6 months as counterparties argue back and forth on the subject of enriching uranium and developing nuclear capabilities.”
Get better rates and lower fees on your next international money transfer.
Compare TorFX with top UK banks in seconds and see how much you could save.
ING doubts the Euro can make further near-term headway; In the shorter run, we see risks mildly tilted on the downside for EUR/USD, and we target 1.170 for the end of the second quarter. Markets have already leaned aggressively into the de‑escalation trade.”
The dollar was also hampered by fresh reservations over Federal Reserve policy with President Trump again threatening to fire Chair Powell if there is a delay in appointing Warsh as his replacement and Powell stays as chair.
According to ING; “If anything, risks sit on the upside relative to our 1.20 year‑end target, as the ECB might end up delivering two hikes after all and political uncertainty building into the November midterms could trigger more US‑specific dollar weakness. And if Republicans lose both houses of Congress, limits on Trump’s ability to pursue new fiscal stimulus could reinforce structurally bearish views on the dollar.
Nordea is also bearish on the dollar; “Confidence in the US government has not improved in recent weeks – quite the opposite – which could weigh further on the dollar in the years ahead.”
It added; “Our broader narrative has been that dollar weakness over the coming years will, in part, be driven by a reallocation away from US assets and towards other investment opportunities.”
MUFG notes the importance of economic developments; “The only scope for a notable gain for the dollar would be if we saw a period of strong risk-off on global recession being priced that would result in a big decline in global equities of around 20%. That’s still a considerable risk and as time passes the impact of the supply disruption will become more evident.”

International Money Transfer? Ask our resident FX expert a money transfer question or try John’s new, free, no-obligation personal service! ,where he helps every step of the way,
ensuring you get the best exchange rates on your currency requirements.
TAGS: Euro Dollar Forecasts
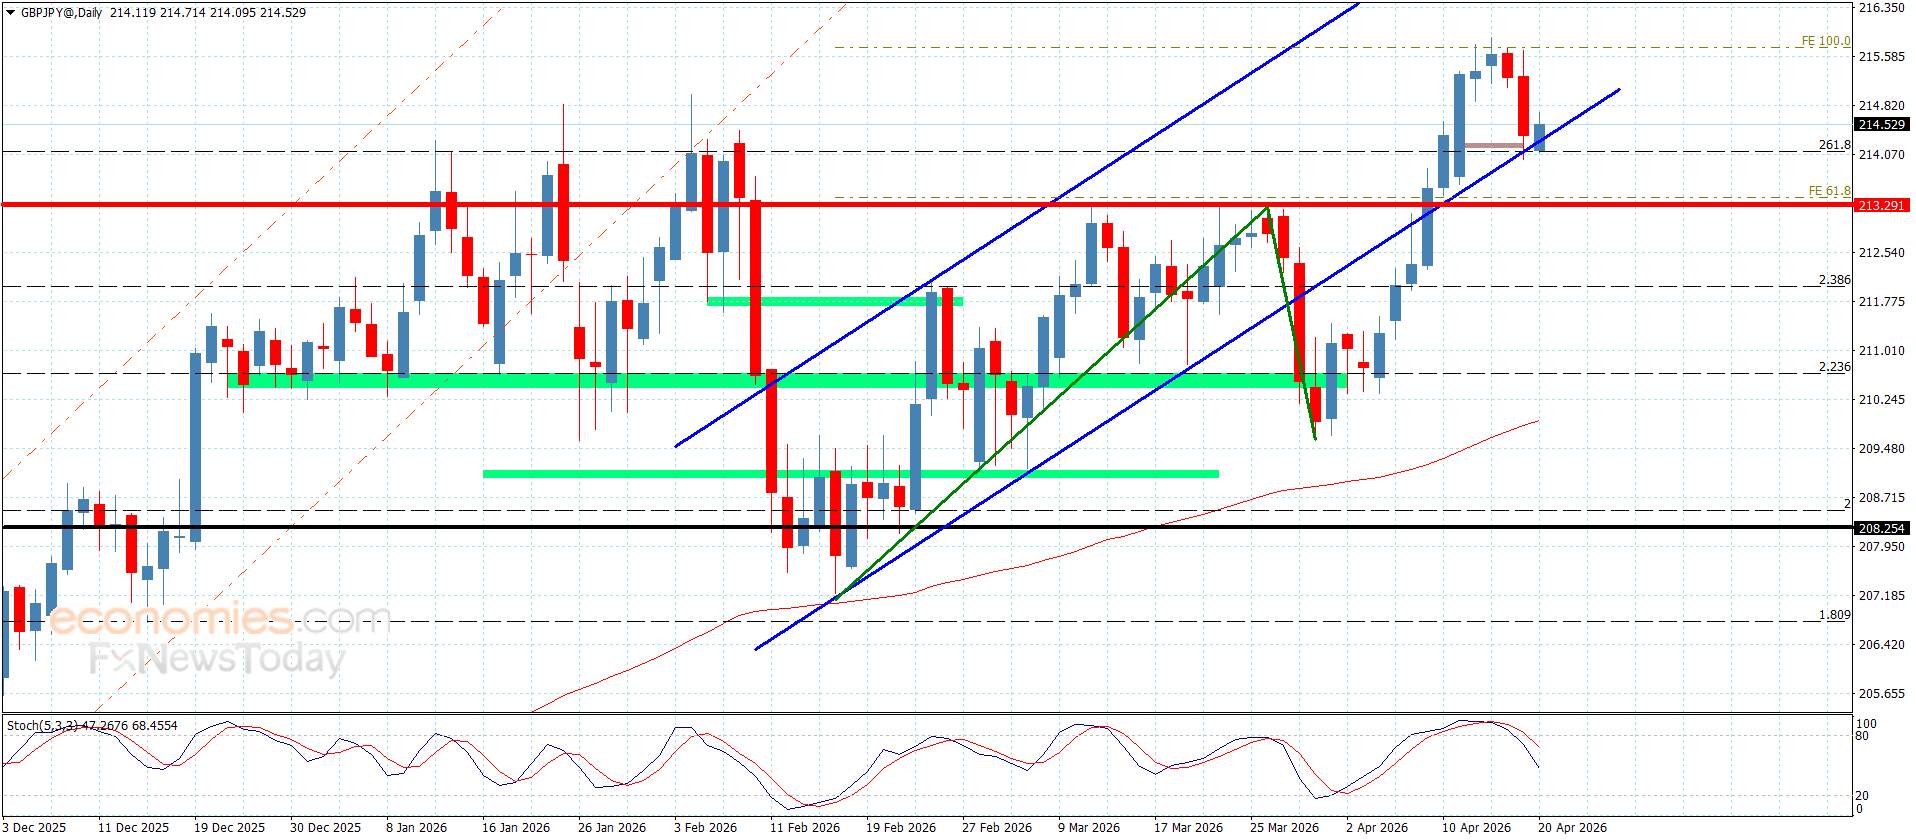
The GBPJPY pair surrendered to stochastic negativity in Friday, forcing it to delay the bullish rally, forming bearish corrective waves, to test the initial support level at 214.19, to settle above it.
The stability above the current support will provide a chance for renewing the bullish attempts by its rally initially towards 215.10, and surpassing it might extend the trading towards 215.70, while the continuation of the negative pressures might force it to provide more corrective trading to reach the main support at 213.30.
The expected trading range for today is between 214.10 and 215.70
Trend forecast: Bullish
The GBPJPY pair surrendered to stochastic negativity in Friday, forcing it to delay the bullish rally, forming bearish corrective waves, to test the initial support level at 214.19, to settle above it.
The stability above the current support will provide a chance for renewing the bullish attempts by its rally initially towards 215.10, and surpassing it might extend the trading towards 215.70, while the continuation of the negative pressures might force it to provide more corrective trading to reach the main support at 213.30.
The expected trading range for today is between 214.10 and 215.70
Trend forecast: Bullish
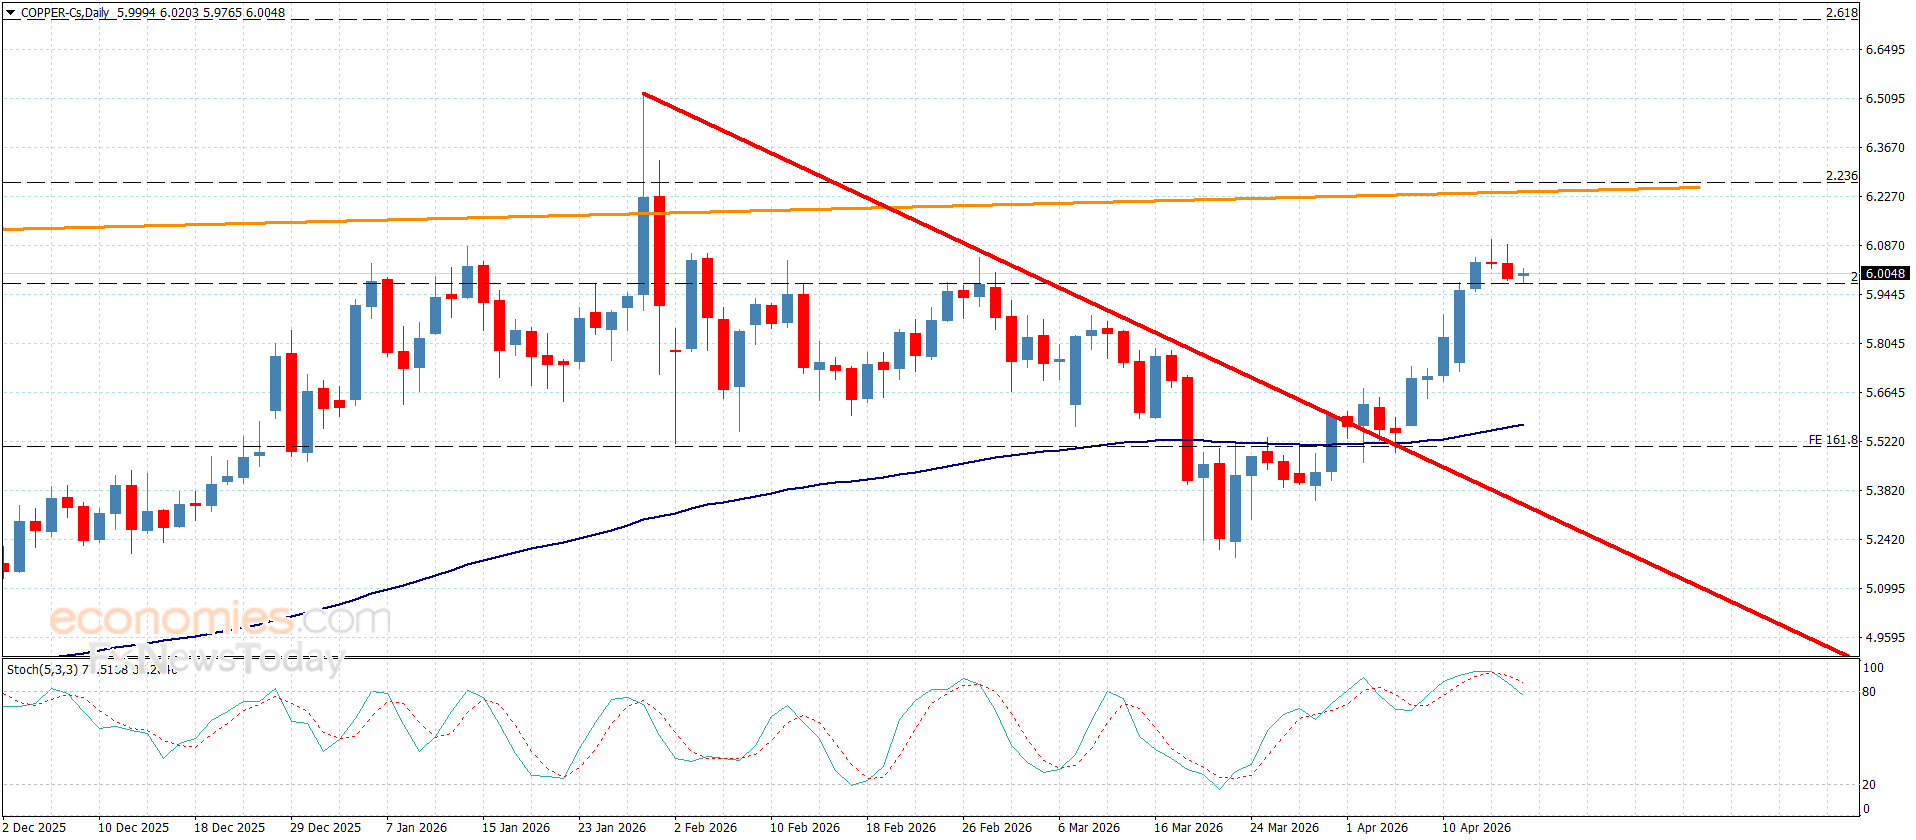
Copper price began its trading by losing the bullish momentum due to stochastic attempt to end the bullish rally, to settle again near $5.9700 level, which formed strong barrier in the previous trading.
The stability above $5.9700 supports the chances of gathering the required extra positive momentum to motivate the bullish rally that might target $6.1550 and $6.2500, while the decline below it might force it to provide temporary trading, to target $5.8100 before reaching the additional positive targets.
The expected trading range for today is between $5.9100 and $6.1550
Trend forecast: Fluctuated
I wrote on 12th April that the best trades for the week would be:
Long of the USD/JPY currency pair following a daily (New York) close above ¥160.
Long of Brent Crude Futures in the small chance we get a daily close above $112.50.
Neither of these trades set up.
A summary of last week’s most important data in the market:
US PPI – considerably worse than expected, showing a month-on-month increase of only 0.5% while 1.1% was widely forecasted. This undershot helped the US Dollar lose some value.
UK GDP –better than expected, showing a month-on-month increase of 0.5% while only 0.1% was forecasted. This didn’t have much effect upon the Pound.
Australia Unemployment Rate – as expected, no change at 4.3%.
Last week’s economic data releases were much less influential upon the markets than the US/Iran negotiations. Optimism that the war will come to a full end soon with some kind of deal and an open Strait of Hormuz has increased, and this has sent stock markets soaring, especially in the USA. The S&P 500 Index has risen by over 13% within just the past three weeks after reaching a new 7-month low. It closed Friday at a new record high! This is a huge turnaround, and April is on track to being the best month for the S&P 500 Index in 52 years.

Despite the optimism, the Iranians are publicly goading the USA, declaring they are refusing President Trump’s red lines, and acted to re-close the Strait of Hormuz yesterday after temporarily opening it. President Trump has continued with a mixture of publicly expressed optimism with the occasional comment following Iran’s fire on vessels attempting to transit about how more bombs will probably be required.
Prediction markets generally think that this war will end formally by the end of May. This suggests that the crowd might be overly optimistic, paving the way for a potential surprise to the downside if hostilities suddenly resume. It remains very difficult to see how the USA’s bottom line – no nuclear program and an open Strait of Hormuz – can be reconciled with the shibboleths of the Islamic Republic of Iran, although the Islamic Republic has been seriously weakened and is now being bankrupted. However, one of the most powerful politicians in Iran, the Parliament speaker Ghalibaf, said just a few hours ago that negotiations were making progress but there are still some gaps, which sounds as if Trump’s general optimism is not misplaced.
It is worth mentioning that the current ceasefire expires by this Wednesday.
The outcome of negotiations and the ceasefire concerning the Middle Easy war is likely to remain more influential that any economic data releases which are scheduled over the coming week, as we approach the deadline for the expiry of the current two-week ceasefire and await to see whether it will be extended or something else will be agreed.
The coming week’s most important data points, in order of likely importance, are:
US Retail Sales
UK CPI (inflation)
Canada CPI (inflation)
New Zealand CPI (inflation)
Germany & UK Flash Services & Manufacturing PMI
UK Retail Sales
UK Claimant Count Change (Unemployment Claims)
Currency Price Changes and Interest Rates
For the month of April, I forecasted that the USD/JPY currency pair would rise in value. The performance of the forecast so far:

Last week, I made the following forecasts for the coming week:
AUD/JPY short – this was a losing trade, as the cross rose by 0.98%.
NZD/JPY short – this was a losing trade, as the cross rose by 0.32%.
NZD/CAD short – this was a winning trade, as the cross fell by 0.33%.
Overall, the trades gave a loss of 0.97%, which is an average loss of 0.32% per trade.
The Australian Dollar was the strongest major currency last week, while the US Dollar was the weakest.
Next week’s volatility is likely to remain relatively low. However, the ongoing war in the Middle East (subject to the current ceasefires) retains the ability to roil the market if there are any surprises. This could generate volatility in the US Dollar, the Japanese Yen, and the Canadian Dollar, not to mention stock markets.
You can trade these forecasts in a real or demo Forex brokerage account.
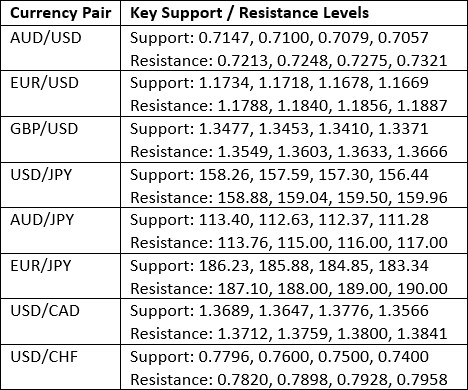
Key Support and Resistance Levels
The US Dollar printed a bearish candlestick, with a significant lower wick, and a close that was within the lower half of its range. We have a bearish long-term trend, with the 3-month trend bearish and the 6-month trend also bearish.
Despite the seeming bearish trend, looking at the price chart below, we can see that the greenback is really within a long-term consolidation phase, so we cannot really expect much of a trend in the US Dollar here.
I think the greenback will be more driven by the progress in the current Middle East ceasefire talks – if war breaks out again, it will likely boost the Dollar, not so much as a haven but more as an effect of the inflationary shock of the rising energy prices. If the ceasefire becomes something more durable, conversely, it will probably be bearish for the US Dollar. This latter scenario is what the market is strongly expecting right now, so I will generally prefer to be short of the US Dollar over the coming week, unless the USA/Iran war restarts.
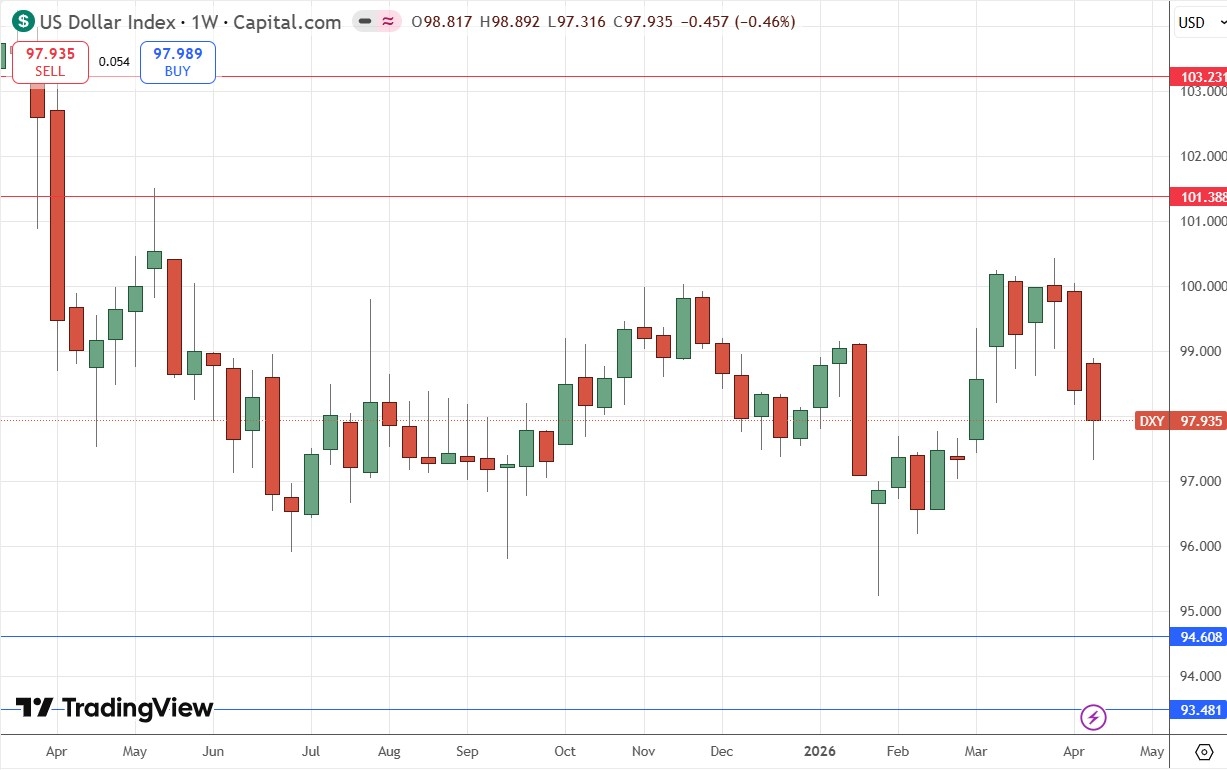
US Dollar Index Weekly Price Chart
The AUD/USD currency pair was at the heart of the Forex market yet again last week, with the Aussie gaining by more than any other major currency, while the US Dollar was the biggest loser. There has been a very long-term bullish trend in the Aussie, which seemed to have decoupled from risk sentiment to some extent, but we see the Aussie getting bid hard as the world enjoys the increasing expectation that there will be a peace deal soon concluded between Iran and the USA. This is also leading to a decline in the USD, as a safe haven is no longer in such demand.
Another factor pushing the Australian Dollar higher is the relatively hawkish central bank agenda of the RBA, which is likely to hike rates again. The AUD has the highest overnight carry of any major currency, so the Aussie is also being used as a long component in carry trades, possibly against the Swiss Franc or Japanese Yen (the Yen is probably better value overall for that role).
Technically, there is a long-term bullish trend. The price reached a new 3-year high last Friday above $0.7220 but then fell firmly. The price chart below shows last week printed a fairly large bullish candlestick, but it definitely has an upper wick to watch out for.
I think the coming week could give more good long trade opportunities. The support near $0.7150 looks quite strong, so a bullish bounce there might be a good trade entry signal. However, longs will need to watch out for more strong selling potentially above $0.7200.
This pair will likely be at the heart of market volatility, which can be great for day traders, and follow sentiment on the Middle East and the second order effect of a commodity price shock, both up and down.
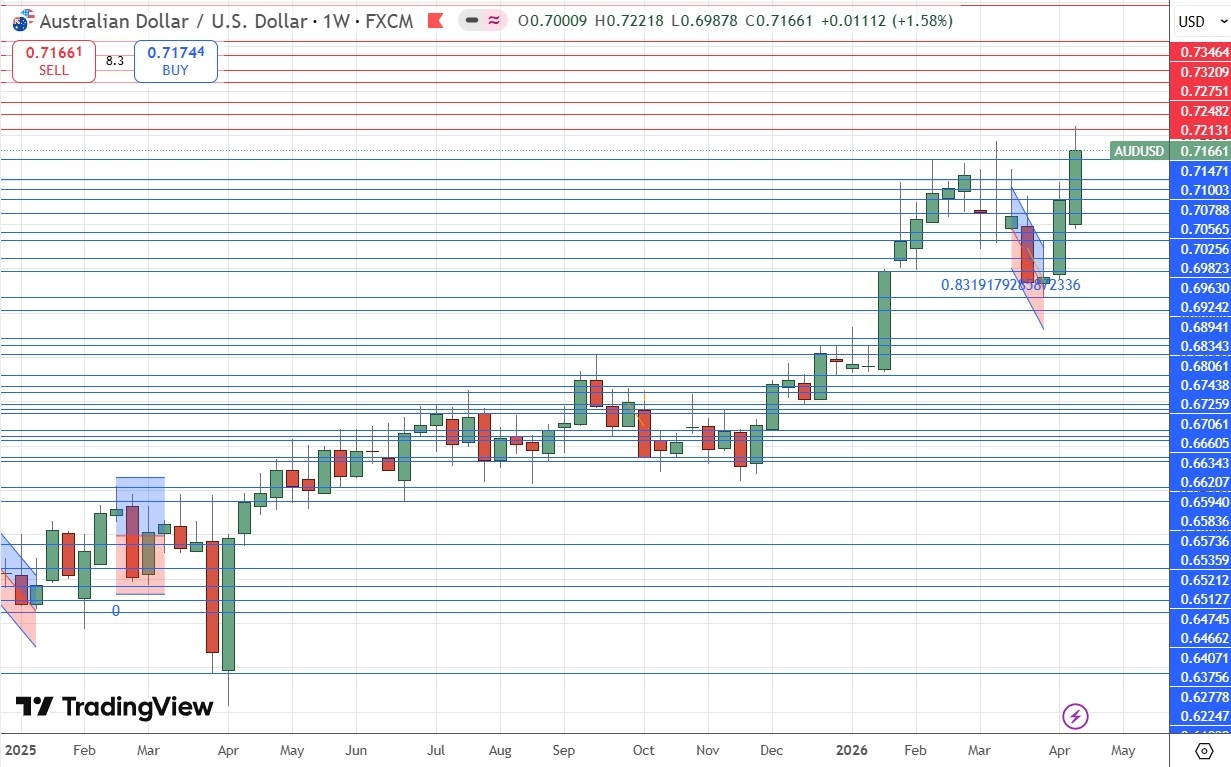
AUD/USD Weekly Price Chart
The USD/JPY currency pair lost some ground last week, three weeks after finally making the long-anticipated bullish breakout beyond the big round number at ¥160. The problem is not Yen weakness, which can be taken for granted over the long-term it seems. The problem for progress higher by this currency pair is the renewed weakness in the US Dollar now that there is a ceasefire seen as leading to a peace deal in the Middle East war, because if there is a longer-term agreement it will remove some inflationary pressure from the Fed through lower energy prices.
Trend traders will be worrying about the slight bearish bias we are seeing near the highs and the price’s unwillingness to break out, especially above the ¥160 level. The Japanese Yen is weak but the Bank of Japan might get nervous and work for an intervention to strengthen the Yen above that level, adding a potential extra hurdle for bulls.
Bulls might however be encouraged by the fact we see significant lower wicks on all the recent weekly candlesticks below. There is also a very solid ascending trend line which has been supporting the price action for a year.
If we do not see the price make a firm bullish move soon, I fear that we might have a bit of a bearish head and shoulders chart pattern which might complete below ¥157.50, finally knocking out most trend traders from their long position, although some will be setting their stop losses for a break below the trend line at about ¥155.
I remain long, but more cautious traders might want to wait for a daily (New York) close above ¥160 before entering a new long trade.
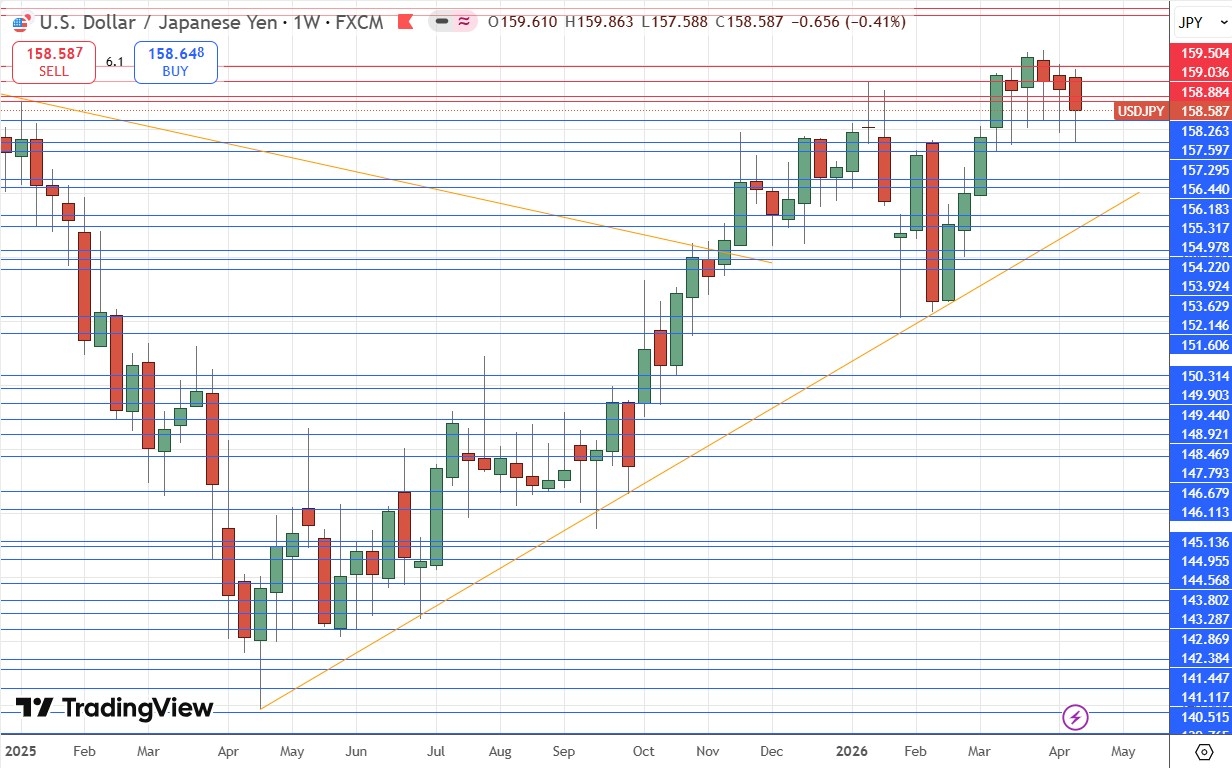
USD/JPY Weekly Price Chart
The S&P 500 Index has been on a wild ride over the past few weeks, rising by more than 13% in value within that time, especially over the past week. If this holds up, it will be the biggest calendar month gain by the Index since 1987, or possibly even 1974. This is quite an extraordinary turnaround after the price fell by about 10% to spend several days trading below the 200-day simple moving average and reaching new 7-month low prices. This is extraordinarily high volatility and an unusual event.
Stock markets are soaring through the same driver that was sending them plummeting just three or four weeks ago – the war between the USA and Iran. The ceasefire and negotiations have generated an increasingly strong expectation that the war will end soon with a comprehensive peace deal. This sent markets soaring higher, and we saw this Index end the week very near the high of its large range after reaching a new all-time high above 7,150.
This is overall a bullish development, this strong breakout to a new record high, and it is generally a signal that the price will go on to rise over the coming months. However, it might be worth considering what could happen if the war unexpectedly resumes this Wednesday when the two-week ceasefire expires. I find it hard to believe the Islamic Republic will accept giving up its nuclear program and will instead try to draw the USA into a long war of attrition, hoping the American eventually give up enough to accept some kind of compromise that leaves their nuclear program to fight for another day. If the war resumes, this would likely send stock markets sharply lower again. However, as a trend trader, I follow what happens, not what I think might happen, and I had to go long at this bullish breakout.
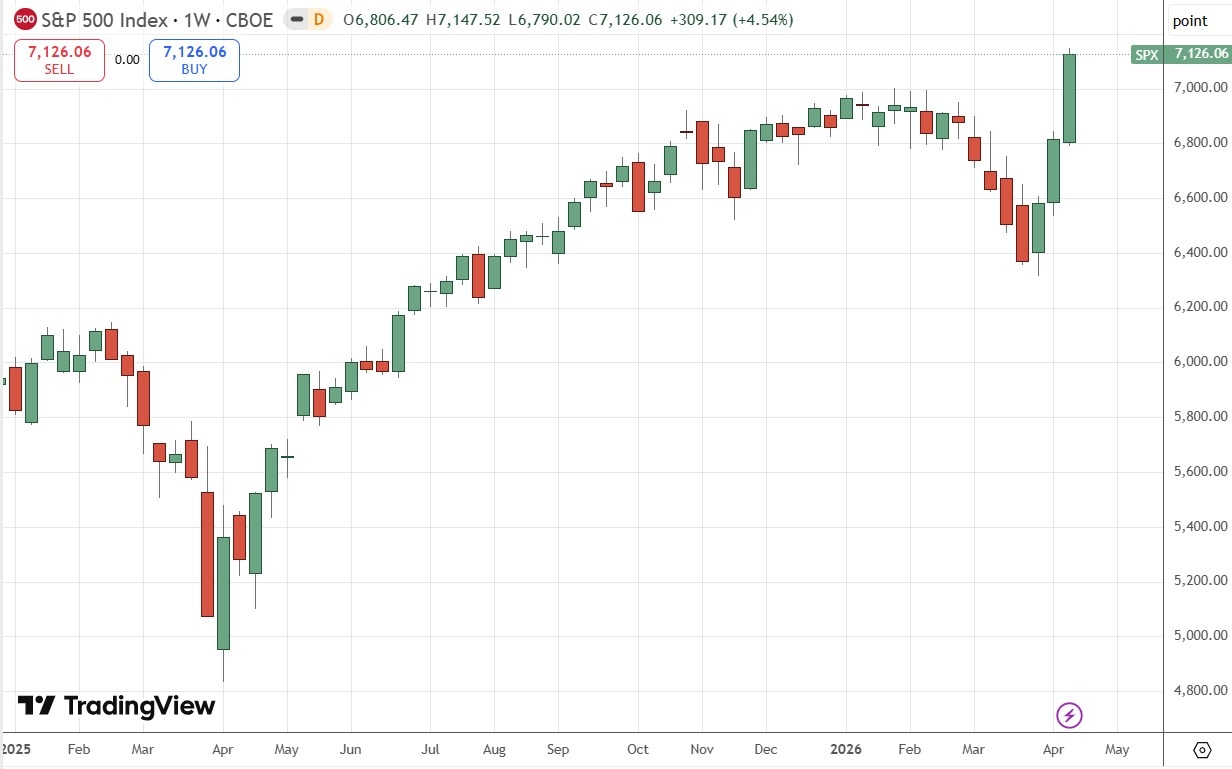
S&P 500 Index Weekly Price Chart
Everything I wrote above about the S&P 500 Index applies equally to the NASDAQ 100 Index, with the small adjustment that the bullish breakout to new record highs here looks maybe slightly less strong. However, the NASDAQ 100 averages a higher return than the S&P 500 Index, so if you want to be long there, you should seriously consider being long here too.
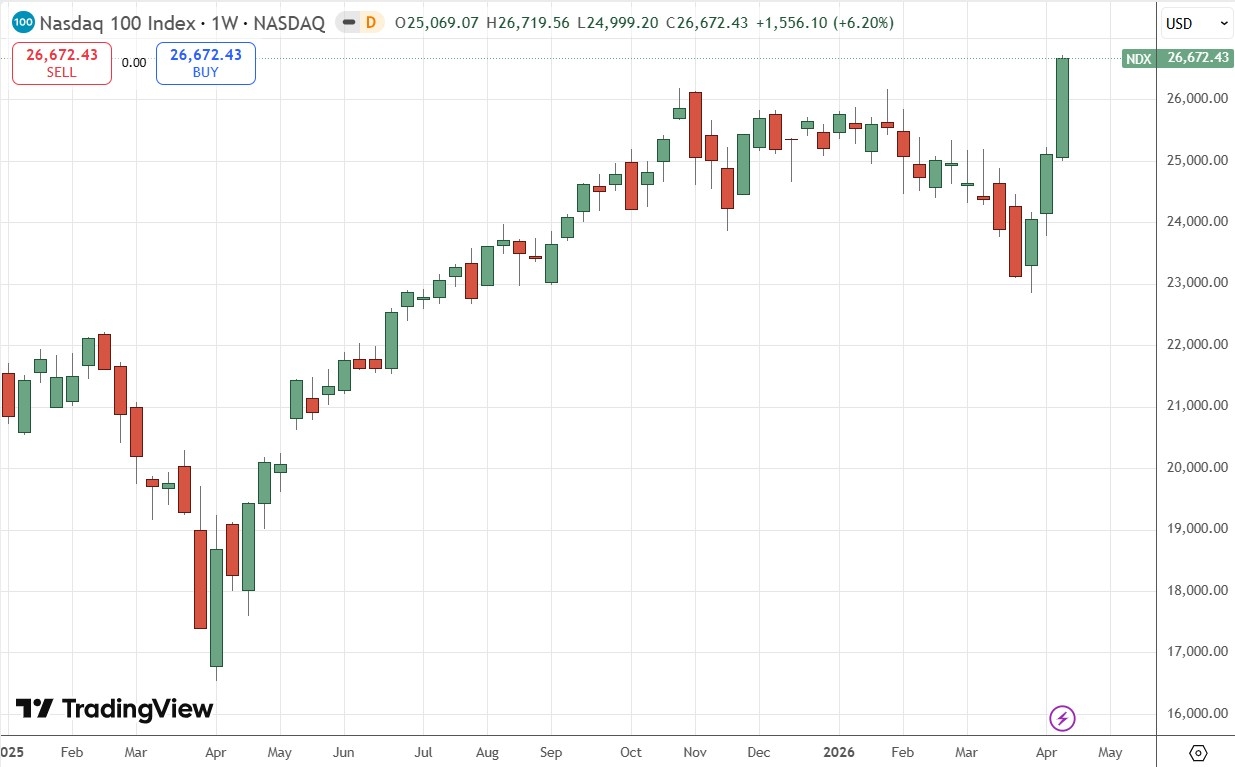
NASDAQ 100 Index Weekly Price Chart
Brent Crude Oil fell again last week, continuing its journey lower as the USA/Iran ceasefire has continued to hold and give rise to strong expectations of a comprehensive peace deal by the end of May. Just as this has pushed stocks higher, it has sent crude oil lower. Another factor here is the Strait of Hormuz, which Iran opened on Friday before closing again on Saturday and firing on at least three tankers, as the USA continues its blockade of traffic to and from Iranian ports.
This new situation might push the price up a bit, but it is very unlikely to send prices to new highs. I am not sure that the price will fall a great deal further even if there is a peace deal, it may take a while to do that, but it should continue to trade lower in that scenario.
The surprise to consider is, what if all the positivity from President Trump is a feint and he is planning to pretend to negotiate a ceasefire extension, but will then order a fresh attack on Iran the minute the ceasefire expires this Tuesday / Wednesday. If this happened, it would certainly send the price of oil racing higher, we might even see the price rise by $20 in a single day.
I think that unless you have a strong view on whether a resumption of the war is likely, there is no point trading crude oil right now, but on a surprise resumption of the war, a long trade could be a good idea.
I will go long here if we get a daily (New York) close above $112.50 per barrel.
If you do go long, Brent will likely be the better vehicle than WTI, as it is more exposed to events in the Strait of Hormuz.
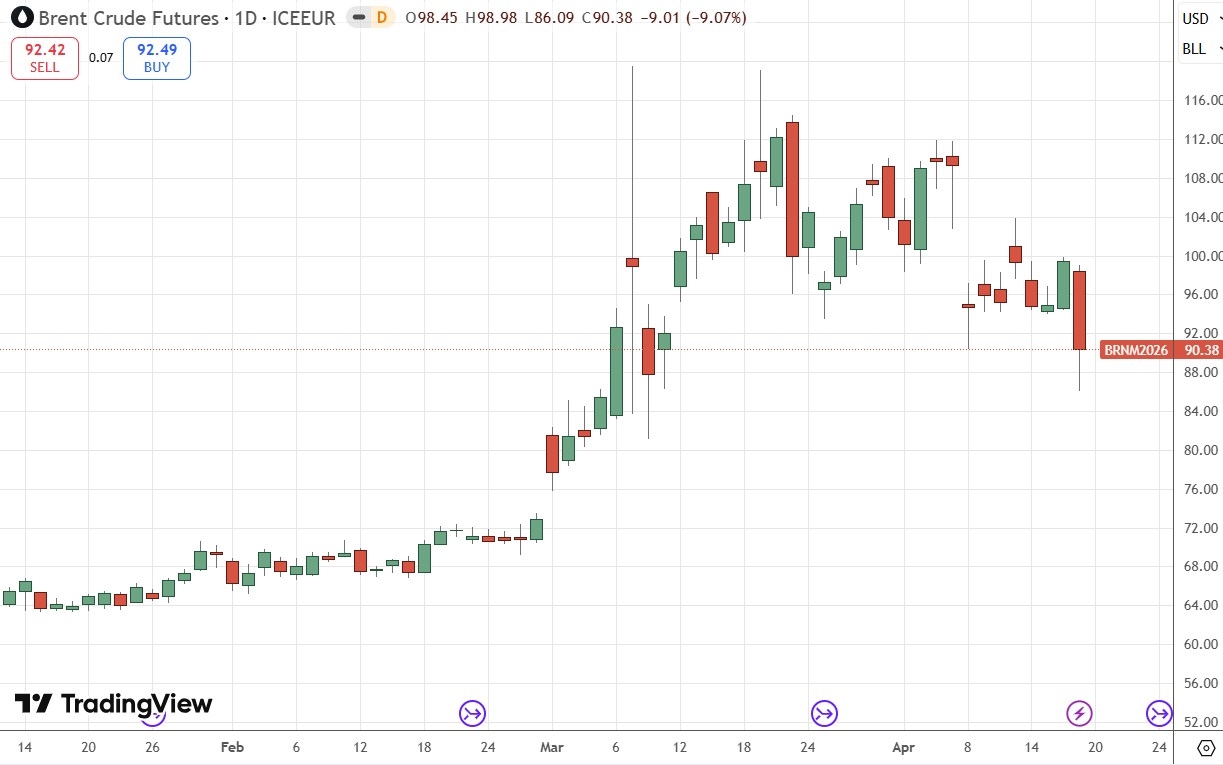
Brent Crude Oil Futures Daily Price Chart
I see the best trades this week as:
Long of the USD/JPY currency pair following a daily (New York) close above ¥160.
Long of Brent Crude Futures if we get a daily close above $112.50. This is extremely unlikely to set up unless there is a surprise resumption of the war.