The main category of All News Articles.
You can use the search box below to find what you need.
[wd_asp id=1]
The main category of All News Articles.
You can use the search box below to find what you need.
[wd_asp id=1]
The EURUSD pair declined in its last intraday trading, to gather the gains of its previous rises, attempting to offload its clear overbought conditions on the relative strength indicators, especially with the emergence of negative signals from them, to gather its positive strength that might help it recover and rise again, amid the dominance of bullish corrective wave on the short-term basis, with the continuation of the positive support that comes from its trading above EMA50, reinforcing the chances of near term recovery.
The EURJPY pair maintained its sideways movement below the resistance barrier at 187.40 during yesterday’s trading before reacting to the negative economic data. This led to a sharp bearish move, as the pair slipped below the ascending channel support at 185.65, suffering significant losses and reaching 182.45, before quickly rebounding to stabilize around 184.75.
For now, we will rely on the 185.40 level as an important additional resistance barrier. Repeated stability below this level would confirm the pair’s shift toward the bearish scenario, with the price expected to move lower toward 184.00, followed by an attempt to confirm a break below the support level at 183.95.
The expected trading range for today is between 184.00 and 185.30
Trend forecast: Bearish
The GBPJPY pair came under strong negative pressure during yesterday’s trading after touching the resistance barrier at 218.65, forcing the pair to launch a sharp bearish move and suffer significant losses, reaching 212.25, before rebounding to retest the broken support level, which has now turned into resistance at 216.35.
Repeated stability below 216.35 may force the pair to resume its bearish attempts, with the price expected to target 215.20 and 214.80, respectively. However, a break above 216.35 and sustained trading above it would temporarily delay the bearish scenario, allowing the pair to attempt a move toward 216.85 and 217.35, respectively.
The expected trading range for today is between 214.80 and 21650
Trend forecast: Bearish
The Japanese Yen rallied sharply on Thursday, with USD/JPY falling from close to 164 to below 158 before recovering above 160 in Asian trading.
The move came amid widespread speculation that Japanese authorities had intervened in the currency market ahead of the Bank of Japan meeting. Intervention was not officially confirmed, although reports also suggested that the US had conducted a rate check on USD/JPY.

US Treasury Secretary Scott Bessent added to the pressure by describing the Yen as “very undervalued”, while Japan’s top currency official Atsushi Mimura acknowledged concerns over the recent weakness without commenting directly on intervention.
MUFG said the scale of the move was similar to previous episodes of official action.
“The scale of the USD/JPY move is quite similar to past Yen selling interventions including in 2024, but may have a bit more to go based on historical experience of perhaps more than a 5% move,” the bank said.

USD/JPY fell by more than five Yen during Thursday’s session before recovering part of the decline.
MUFG remains cautious on the pair heading into the weekend, particularly with speculative positioning still heavily tilted against the Yen.
“With JPY net shorts still elevated close to all-time highs, authorities may be looking to flush out these positions,” the bank said.
It added that traders were likely to become “more cautious on the near-term bets on JPY given the balance of risks.”
That said, MUFG does not believe intervention alone will be enough to produce a lasting reversal.
“Ultimately it boils down to fundamentals over the medium term,” the bank said. “For USD/JPY to achieve a more durable retracement lower, it would require real interest rates to rise more substantially, and for market concerns around fiscal sustainability to be addressed.”

MUFG expects the Bank of Japan to leave rates unchanged at its latest meeting, although dissenting votes in favour of a hike could strengthen expectations of earlier tightening.
The bank’s global and Japan teams forecast BOJ rate increases in September 2026 and January 2027, a faster path than markets currently price.
“This in part underpins our view for USD/JPY to move lower below the 160 levels over time,” MUFG said.
Governor Kazuo Ueda’s guidance will now be closely watched for any indication that policymakers are becoming more willing to accelerate the pace of tightening.

USD/JPY remains well above its January levels despite the latest sharp reversal.
Our currency coverage draws on live market data, official economic releases and published bank research.
The USD/JPY pair is seen building on the previous day’s late recovery from sub-158.00 levels, or the lowest since May 14, and gaining positive traction during the Asian session on Friday. Spot prices climb back above the 160.50 level amid the emergence of some US Dollar (USD) buying and some repositioning trade ahead of the highly anticipated Bank of Japan (BoJ) rate decision.
From a technical perspective, strength beyond the 160.00 psychological mark and the 38.2% Fibonacci retracement level of the sharp corrective pullback from a four-decade peak backs the case for further intraday gains. However, the 14-period Relative Strength Index (RSI) near 31 and a negative Moving Average Convergence Divergence (MACD) reading around -0.43 suggest lingering downside pressure.
Hence, any further move up is more likely to confront stiff resistance near a dense Fibonacci band led by the 50.0% retracement at 160.99 and further capped by the 61.8% and 78.6% retracements at 161.69 and 162.69, respectively. Bulls would need to clear the said barriers to ease immediate pressure and pave the way for a rise back towards the cycle high region at 163.97.
On the downside, initial support is seen at the 38.2% Fibonacci retracement at 160.28, ahead of the 23.6% level at 159.41 and the structural swing low zone at 158.00. A convincing break and acceptance below the handle will be seen as a fresh trigger for bearish traders and pave the way for an extension of the suspected intervention-led corrective decline.
(The technical analysis of this story was written with the help of an AI tool. Know more.)
The table below shows the percentage change of Japanese Yen (JPY) against listed major currencies this week. Japanese Yen was the strongest against the US Dollar.
| USD | EUR | GBP | JPY | CAD | AUD | NZD | CHF | |
|---|---|---|---|---|---|---|---|---|
| USD | -1.01% | -0.86% | -1.85% | -0.51% | -0.33% | -1.02% | -1.15% | |
| EUR | 1.01% | 0.14% | -0.83% | 0.52% | 0.70% | -0.01% | -0.14% | |
| GBP | 0.86% | -0.14% | -1.06% | 0.39% | 0.56% | -0.15% | -0.28% | |
| JPY | 1.85% | 0.83% | 1.06% | 1.33% | 1.52% | 0.81% | 0.59% | |
| CAD | 0.51% | -0.52% | -0.39% | -1.33% | 0.15% | -0.51% | -0.65% | |
| AUD | 0.33% | -0.70% | -0.56% | -1.52% | -0.15% | -0.70% | -0.84% | |
| NZD | 1.02% | 0.00% | 0.15% | -0.81% | 0.51% | 0.70% | -0.14% | |
| CHF | 1.15% | 0.14% | 0.28% | -0.59% | 0.65% | 0.84% | 0.14% |
The heat map shows percentage changes of major currencies against each other. The base currency is picked from the left column, while the quote currency is picked from the top row. For example, if you pick the Japanese Yen from the left column and move along the horizontal line to the US Dollar, the percentage change displayed in the box will represent JPY (base)/USD (quote).
The Euro to Pound exchange rate (EUR/GBP) traded around 0.8574 on Thursday afternoon after the Bank of England held interest rates at 3.75%, with Sterling failing to draw lasting support from a surprisingly hawkish 6–3 vote.
Huw Pill, Megan Greene and Catherine Mann backed an immediate increase, but the guidance suggested most policymakers remain prepared to wait for clearer evidence that higher energy costs are feeding into persistent domestic inflation.
EUR/GBP initially moved lower before rebounding above 0.8585, then settled back near 0.8574. The pair remained around 0.4% lower for July but was well above its mid-month low near 0.8467.
MUFG had argued before the announcement that the unchanged rate itself would not determine Sterling’s direction. With “nothing priced for today”, the bank said markets would focus instead on “the vote, the communication in the statement, the minutes and the updated forecasts”.
That proved accurate. The three dissenting votes looked supportive for the Pound at first glance, yet the wider message did not materially increase confidence that a September hike was coming.
MUFG had set a clear test for Sterling: “For market rates to move higher and the pound to advance in response to today’s meeting we will need to see increased conviction on a September rate hike.”
The decision did little to meet that threshold.
The Monetary Policy Committee acknowledged that inflation risks remain skewed higher, particularly because of energy prices and the uncertain geopolitical backdrop. However, it also pointed to “clear signs of underlying disinflation” and limited evidence so far of stronger second-round effects.
That combination leaves the Bank concerned, but not yet ready to act.
MUFG had warned that if the inflation forecasts showed prices returning to target over time, “the take-away is likely to be that there is time to assess the inflation risks”.
In that scenario, the bank said “pricing for a September rate hike could ease back somewhat, taking the pound lower”. Thursday’s Sterling reaction was consistent with that interpretation.

The intraday move captured the market’s changing reading of the announcement. EUR/GBP initially fell as traders reacted to the three votes for higher rates, but the decline quickly reversed once the guidance was absorbed.
The pair’s jump above 0.8585 suggested the vote count was not enough to convince investors that the next increase had moved materially closer. Its later retreat showed that the decision was not decisively dovish either.
Energy prices remain the strongest argument for keeping a hike in play.
MUFG said the backdrop had become “difficult with crude oil and natural gas prices rebounding significantly”, while a prolonged increase in energy costs “could certainly force the BoE to act, even in circumstances of mixed labour market conditions”.
That risk prevents markets from abandoning tightening expectations altogether. It also helps explain why Sterling’s losses were contained rather than severe.

The wider price history shows EUR/GBP recovering sharply after Sterling’s strongest run of the year.
The pair fell below 0.8470 in July before rebounding by more than a cent. Thursday’s decision has not broken that recovery, and the cross is again approaching levels that repeatedly contained declines during May and June.
The implication is straightforward: EUR/GBP does not require a major improvement in the Euro outlook to move higher. A modest reduction in expected UK rate support may be enough.
MUFG expected Sterling to remain “well supported at these levels” only on the assumption that “pricing for a September rate hike holds up”.
After Thursday’s announcement, that assumption looks less secure.
The 6–3 vote keeps tightening risk alive, but the guidance suggests the majority is comfortable waiting. Unless energy prices rise sharply or incoming inflation data deteriorate, September may prove too early for another move.
A further decline in September hike expectations could send EUR/GBP back above 0.8590 and towards July’s high near 0.8619.
Pound Sterling would regain firmer support if markets conclude that the three dissenters represent the beginning of a broader hawkish shift. That would require stronger inflation evidence or clearer concern from the MPC’s swing voters.
The vote looked hawkish. The message was more patient. For EUR/GBP, that leaves the recovery from July’s lows intact.
Cup of coffee with coffee beans in burlap sack on coffee tree background by Amenic181 via Shutterstock
September arabica coffee (KCU26) today is down -0.40 (-0.12%), and September ICE robusta coffee (RMU26) is up +29 (+0.77%).
Coffee prices are mixed today. Arabica coffee is under pressure today on forecasts for mostly dry weather in Brazil’s coffee-growing regions over the next week, which should allow for the pace of the country’s coffee harvest to speed up.
On Tuesday, coffee prices rallied to 2-week highs amid concern that heavy rain in Brazil will further disrupt the country’s coffee harvest and tighten global supplies. On Monday, Somar Meteorologia reported that 32.4 mm of rain, or 2700% of the historical average, fell in the week ended July 26 in Minas Gerais, Brazil’s biggest coffee-growing region.
The slow pace of Brazil’s coffee harvest is supportive of coffee prices. The harvest among members of Cooxupe co-op was 58.3% complete as of July 24, behind the year-earlier pace of 67%. On July 17, Safras & Mercado reported that Brazil’s 2026/27 coffee harvest was 64% complete as of July 15, behind last year’s comparable level of 77% and the five-year average of 70%.
Rising inventories are weighing on robusta coffee as ICE robusta inventories climbed to a 4.25-month high of 4,254 lots last Wednesday, although inventories were mildly below that level at 4,133 lots today. By contrast, a bullish factor for arabica coffee prices was that ICE arabica coffee inventories fell to a 2.5-year low of 274,168 bags on Wednesday.
Last Friday, coffee prices tumbled to 3-week lows due to the USDA’s forecast last Wednesday that global coffee output in the 2026-27 season will rise by +6.0% (10.8 million bags) to a record 189.7 million bags, mainly due to improved growing conditions in Brazil. The USDA expects global arabica production to rise +12% y/y, although robusta production is expected to fall by -0.7% y/y. World ending stocks are expected to rise +1.9 million bags to 26.3 million bags. On June 3, the USDA’s Foreign Agricultural Service (FAS) forecast a record 2026/27 Brazil coffee crop of 71.9 million bags, up +14% y/y.
Concerns that an El Niño weather pattern could hurt Brazil’s coffee crop next year are bullish for prices. Coffee trader Commercial said the El Niño weather pattern may delay rains in Brazil this September and October, when tree flowering normally occurs, hurting Brazil’s 2026/27 coffee crop. On July 8, the US Climate Prediction Center said the El Niño weather pattern that emerged across the equatorial Pacific last month will likely be one of the strongest in more than 75 years. This sets the stage for months of possible floods, droughts, and temperature fluctuations later this year that could hinder coffee production in Asia and South America.
Soaring coffee exports from Vietnam, the world’s largest robusta producer, are bearish for robusta prices. On July 3, Vietnam’s National Statistics Office reported that Vietnam’s 2026 coffee exports (Jan-Jun) rose by +7.3% y/y to 1.05 MMT. Vietnam’s 2025 coffee exports jumped by +17.5% y/y to 1.58 MMT. Also, Vietnam’s 2025/26 coffee production is projected to climb +6% y/y to a 4-year high of 1.76 MMT (29.4 million bags).
On the date of publication, Rich Asplund did not have (either directly or indirectly) positions in any of the securities mentioned in this article. All information and data in this article is solely for informational purposes. For more information please view the Barchart Disclosure Policy here.
The British pound rose against the US dollar on Thursday after the Bank of England decided to keep its base rate unchanged at 3.75%. This decision was in line with the markets and showcases the central bank’s carefulness regarding inflation. The soft dollar helped GBP in staying supported with USD above the important levels of technical pressure. This came after the Fed kept the rates unchanged a day before.
The BoE believes, and the forecasts suggest, that inflation will experience a significant dip. The high prices of energy, due to the geopolitical unrest in the Middle East, will increase inflation again. There is now a combination of inflation, and an economy and labor market in a state of recession. The BoE now faces the problem of inflation vs recession.
This decision was on the back of the Bank’s Monetary Policy Report that has shown a significant dip in inflation. The UK consumer price index shows inflation rates of 2.6% in June, however, energy is expected to become more expensive and push inflation higher in the second half of 2026. The MPC believes that the current rate will ensure that the inflationary pressures, if any, will be temporary.

Officials noted that a more restrictive monetary policy weakens household spending and business investment. A more flexible labor market will likely prevent higher energy prices from producing broad-based wage and price inflation.
Market participants are focusing on the MPC vote split, along with upcoming inflation and growth forecasts, as the monetary policy forecast is already in the price following the rate decision. Andrew Bailey’s comments will also be watched for policy direction.
The market will assess whether the decision makers are keeping the door open for additional tightening if inflation persists, especially if geopolitically-driven energy price spikes also come into play.
Increased concern about inflation from the BoE would likely support the pound. The opposite would likely be true if a more dovish, growth-concerned approach is pursued.
https://www.bankofengland.co.uk/monetary-policy-report/2026/july-2026/
The pound also strengthened after the Federal Reserve chose to keep the target policy rate between 3.50 and 3.75. While three Federal Reserve policy makers were in favor of tightening, Fed Chair Kevin Warsh did not signal an imminent decision to tighten, which caused a September rate increase to be taken off the table, decreasing Treasury yields and strengthening the pound along with other major currencies.
The focus will be on the upcoming U.S. economic releases, especially the PCE deflator and second quarter GDP, as these may impact forecasts of U.S. monetary policy more than others.
UK inflation appears to be under control, but UK economic prospects remain weak. UK consumers and businesses remain under the pressure of high energy costs. This, paired with a slacking labor market and tightening financial conditions, suggests further weakness in UK economic prospects.
In contrast, the US economy is performing better with greater productivity and investment. This tilt in the economic balance is USD supportive in the medium term as the dollar has weakened recently on the back of FOMC comments.
With both central banks on hold, the main drivers of the GBP/USD rate will be divergence in economic data, inflation and central bank communications.
GBP/USD is continuing its upward trend after testing and successfully bouncing off of the rising trendline at 1.3272, with buyers breaking the 50-period EMA at 1.3346, and the 200-period EMA at 1.3363. Renewed buying momentum was confirmed by a bullish engulfing candle, and the pattern of higher lows was maintained.
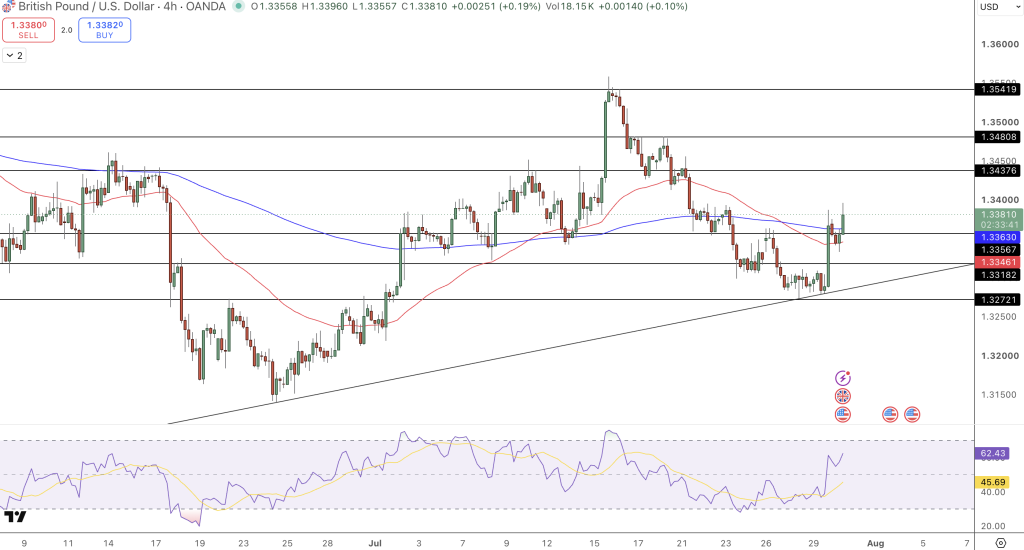
The next resistance level is at 1.3383, where prior price action has resulted in a pause. A break and close above this level will open price action to the 1.3438, 1.3481 and the July peak at near 1.3542.
Momentum indicators are bullish, with the RSI at approximately 62, indicating bullish momentum. The 50 and 200 period EMAs are converging and if price momentum continues, a bullish crossover of the EMAs is likely.
Resistance: 1.3383, 1.3438, 1.3481, 1.3542
Support: 1.3363, 1.3318, 1.3272
The decision by the Bank of England (BOE) to keep rates on hold was largely expected. Therefore, the market was second guessing the BOE’s future inflation assessment and monetary policy signaling. The BOE stated that inflation was on a downward trend; however, they highlighted that the situation may be reversed by higher energy prices in the second half of the year.
GBP/USD is technically in a good position while trading above the 1.3346 – 1.3363 EMA support range. A break above 1.3383 would add to the bullish momentum with 1.3481 in the line of sight. A break below 1.3318 would indicate a loss of bullish momentum, and would likely target the ascending trendline support, which is at 1.3272.
Arslan Ali Butt
Lead Markets Analyst – Multi-Asset (FX, Commodities, Crypto)
Arslan Ali Butt serves as the Lead Commodities and Indices Analyst, bringing a wealth of expertise to the field. With an MBA in Behavioral Finance and active progress towards a Ph.D., Arslan possesses a deep understanding of market dynamics.
His professional journey includes a significant role as a senior analyst at a leading brokerage firm, complementing his extensive experience as a market analyst and day trader. Adept in educating others, Arslan has a commendable track record as an instructor and public speaker.
His incisive analyses, particularly within the realms of cryptocurrency and forex markets, are showcased across esteemed financial publications such as ForexCrunch, InsideBitcoins, and EconomyWatch, solidifying his reputation in the financial community.
Silver price (XAG/USD) gives back its early gains and turns negative on Thursday. The white metal trades 0.7% lower at around $57.25 in the European trade after a positive start, which led to hitting an intraday high at $58.65.
Surging US Treasury Yields on expectations that the Federal Reserve (Fed) would need to hike interest rates in the near-term have diminished the appeal of non-yielding assets, such as Silver.
“Yields are a byproduct of the rate expectations, and if the market expects that inflation fears will translate into higher rates, yields will be higher,” and this is pressuring gold, ANZ analyst Soni Kumari said. The remarks from the bank were especially for Gold; however, historically, Silver reacts in a similar fashion to Gold against bond yields.
At press time, 10-year US Treasury Yields trade 1.8% higher, close to their 18-month high of around 4.71%. A decent recovery in the US Dollar Index (DXY) to near 101.00 after a weak Wednesday is also hurting the Silver price. Technically, a higher US Dollar makes the Silver price an unfavorable risk-reward bet for investors.
The table below shows the percentage change of US Dollar (USD) against listed major currencies today. US Dollar was the strongest against the Swiss Franc.
| USD | EUR | GBP | JPY | CAD | AUD | NZD | CHF | |
|---|---|---|---|---|---|---|---|---|
| USD | 0.27% | 0.22% | 0.18% | 0.11% | 0.04% | -0.19% | 0.43% | |
| EUR | -0.27% | -0.07% | -0.07% | -0.16% | -0.25% | -0.48% | 0.16% | |
| GBP | -0.22% | 0.07% | 0.00% | -0.10% | -0.18% | -0.40% | 0.25% | |
| JPY | -0.18% | 0.07% | 0.00% | -0.08% | -0.14% | -0.39% | 0.27% | |
| CAD | -0.11% | 0.16% | 0.10% | 0.08% | -0.07% | -0.31% | 0.34% | |
| AUD | -0.04% | 0.25% | 0.18% | 0.14% | 0.07% | -0.21% | 0.44% | |
| NZD | 0.19% | 0.48% | 0.40% | 0.39% | 0.31% | 0.21% | 0.68% | |
| CHF | -0.43% | -0.16% | -0.25% | -0.27% | -0.34% | -0.44% | -0.68% |
The heat map shows percentage changes of major currencies against each other. The base currency is picked from the left column, while the quote currency is picked from the top row. For example, if you pick the US Dollar from the left column and move along the horizontal line to the Japanese Yen, the percentage change displayed in the box will represent USD (base)/JPY (quote).
According to the CME FedWatch tool, there is an almost 75% chance that the Fed will deliver at least one interest rate hike by the October meeting.
The Silver price opened higher as the US Dollar fell sharply after the Fed’s monetary policy announcement on Wednesday, in which it decided to leave interest rates unchanged in the range of 3.50%-3.75%. Fed’s monetary policy statement and Chairman Kevin Warsh’s press conference signaled that policymakers are highly concerned about inflation remaining well-above the central bank’s 2% target for a longer period.
Silver is a precious metal highly traded among investors. It has been historically used as a store of value and a medium of exchange. Although less popular than Gold, traders may turn to Silver to diversify their investment portfolio, for its intrinsic value or as a potential hedge during high-inflation periods. Investors can buy physical Silver, in coins or in bars, or trade it through vehicles such as Exchange Traded Funds, which track its price on international markets.
Silver prices can move due to a wide range of factors. Geopolitical instability or fears of a deep recession can make Silver price escalate due to its safe-haven status, although to a lesser extent than Gold’s. As a yieldless asset, Silver tends to rise with lower interest rates. Its moves also depend on how the US Dollar (USD) behaves as the asset is priced in dollars (XAG/USD). A strong Dollar tends to keep the price of Silver at bay, whereas a weaker Dollar is likely to propel prices up. Other factors such as investment demand, mining supply – Silver is much more abundant than Gold – and recycling rates can also affect prices.
Silver is widely used in industry, particularly in sectors such as electronics or solar energy, as it has one of the highest electric conductivity of all metals – more than Copper and Gold. A surge in demand can increase prices, while a decline tends to lower them. Dynamics in the US, Chinese and Indian economies can also contribute to price swings: for the US and particularly China, their big industrial sectors use Silver in various processes; in India, consumers’ demand for the precious metal for jewellery also plays a key role in setting prices.
Silver prices tend to follow Gold’s moves. When Gold prices rise, Silver typically follows suit, as their status as safe-haven assets is similar. The Gold/Silver ratio, which shows the number of ounces of Silver needed to equal the value of one ounce of Gold, may help to determine the relative valuation between both metals. Some investors may consider a high ratio as an indicator that Silver is undervalued, or Gold is overvalued. On the contrary, a low ratio might suggest that Gold is undervalued relative to Silver.


