The main category of All News Articles.
You can use the search box below to find what you need.
[wd_asp id=1]
The main category of All News Articles.
You can use the search box below to find what you need.
[wd_asp id=1]
EUR/JPY halts its seven-day losing streak, trading around 177.40 during Asian hours on Tuesday. Technical analysis of the daily chart shows that the currency cross is remaining close to the lower boundary of the descending channel, suggesting the price holds support and a temporary bounce. However, a break below the channel would signal accelerating downward momentum in a steeper downtrend.
The EUR/JPY cross is maintaining a bearish tone as it holds beneath both the nine- and 50-period Exponential Moving Averages (EMAs). The currency cross has recently slipped below the nearer structural floor at 175.70, turning recent price action into a corrective phase, while the 14-day Relative Strength Index (RSI) at 29.78 hovers in oversold territory, hinting that while downside pressure is strong, fresh selling could become more measured in the short term.
The initial support lies at the lower boundary of the channel around 176.60, followed by an 11-month low of 175.70, recorded in November 2025. Further support lies at the 14-month low of 169.72.
On the upside, the EUR/JPY cross may rebound and test the nine-day EMA at 178.18, followed by the 50-day EMA at 181.20. Further resistance lies at the upper boundary of the descending channel around 184.20, followed by the all-time high of 187.95 set on April 17.
Analysts at Commerzbank argue that the ECB has scope to ease market tensions through communication before resorting to more forceful tools. They note that, despite elevated inflation, ECB representatives could “adopt a less hawkish tone in their public comments, thereby dampening expectations of interest-rate hikes and easing pressure on government bonds.” In their view, Christine Lagarde’s recent appearance before the European Parliament’s Committee on Economic and Monetary Affairs already points in this direction, as she stressed that “the sharp rise in bond yields would dampen economic growth and limit the pass-through of higher energy costs to consumers,” signalling greater sensitivity to the impact of tighter financing conditions.
(The technical analysis of this story was written with the help of an AI tool. Know more.)
The table below shows the percentage change of Euro (EUR) against listed major currencies today. Euro was the strongest against the Japanese Yen.
| USD | EUR | GBP | JPY | CAD | AUD | NZD | CHF | |
|---|---|---|---|---|---|---|---|---|
| USD | 0.05% | 0.10% | 0.16% | 0.03% | 0.01% | 0.04% | 0.10% | |
| EUR | -0.05% | 0.00% | 0.07% | -0.02% | -0.02% | -0.01% | 0.06% | |
| GBP | -0.10% | -0.00% | 0.08% | -0.04% | -0.02% | -0.02% | 0.08% | |
| JPY | -0.16% | -0.07% | -0.08% | -0.11% | -0.12% | -0.08% | -0.01% | |
| CAD | -0.03% | 0.02% | 0.04% | 0.11% | -0.02% | 0.00% | 0.09% | |
| AUD | -0.01% | 0.02% | 0.02% | 0.12% | 0.02% | 0.00% | 0.11% | |
| NZD | -0.04% | 0.00% | 0.02% | 0.08% | -0.00% | -0.01% | 0.10% | |
| CHF | -0.10% | -0.06% | -0.08% | 0.00% | -0.09% | -0.11% | -0.10% |
The heat map shows percentage changes of major currencies against each other. The base currency is picked from the left column, while the quote currency is picked from the top row. For example, if you pick the Euro from the left column and move along the horizontal line to the US Dollar, the percentage change displayed in the box will represent EUR (base)/USD (quote).
Disclaimer: For information purposes only. Past performance is not indicative of future results.
U.S. Dollar Index gains ground as traders react to ISM Services PMI report. The report showed that ISM Services PMI declined from 55.4 in August to 54.9 in September, compared to analyst forecast of 55. Numbers above 50 show expansion. The weaker-than-expected report did not put any pressure on the American currency.
Currently, U.S. Dollar Index is trying to settle above the resistance level at 102.35 – 102.50. In case U.S. Dollar Index manages to settle above the 102.50 level, it will head towards the next resistance, which is located in the 103.35 – 103.50 range.
– Written by
James Fuller
STORY LINK EUR/USD Forecast: Analysts Slash 12-Month Target to 1.12
The Euro to Dollar exchange rate (EUR/USD) traded near 1.1204 on Monday afternoon, down around 0.4% as concerns over French government finances weighed on the single currency.
Weaker US employment figures have failed to produce a lasting Euro recovery, with ING warning of further losses and Rabobank cutting its forecasts despite the softer American data.
ING expects EUR/USD to retreat towards 1.1100-1.1120 in the near term, with French fiscal uncertainty threatening a deeper decline.
According to ING; “We stick with our 1.1100/1120 EUR/USD target for the time being, with the risk of an extension to the 1.10 area.”
EUR/USD has slipped further from Friday’s close near 1.1252, extending the pressure that drove a 2.5% decline during September.
ING noted that markets have removed around 30 basis points of expected European Central Bank tightening since late September, compared with only 13 basis points for the Federal Reserve.
Get better rates and lower fees on your next international money transfer.
Compare TorFX with top UK banks in seconds and see how much you could save.
The smaller adjustment to US expectations has preserved a source of support for the Dollar.
Rabobank has also become more cautious, lowering its three-month EUR/USD forecast to 1.13 from 1.16 and its 12-month projection to 1.12 from 1.18.
The bank commented; “We have revised our EUR forecasts lower across the board”.
The revised targets are close to current levels, but represent a substantial retreat from its previous expectations of a stronger Euro.
Rabobank warned that investors selling French bonds may increasingly move funds outside the Eurozone rather than switch into other Euro-denominated assets.
It added; “This raises the prospect that the EUR could be impacted by outflows.”
French public debt reached 119.0% of GDP in the second quarter, up from 117.5% during the opening three months of the year.

US economic developments nevertheless remain an important counterweight to the Euro’s domestic difficulties.
Non-farm payrolls increased by just 29,000 in September, while revisions removed 60,000 jobs from the previous two months and unemployment increased to 4.2%.
Annual wage growth also eased to 3.0%, providing further evidence that labour-market inflation pressures are cooling.
ING said “the Fed leadership is clearly leaning in the direction of an October hold”, although it still expects another increase later this year.
It added; “December remains our call on the next Fed hike.”
Deutsche Bank’s analysis published last week offered a more constructive outlook, forecasting EUR/USD at 1.17 by the end of 2026.
The bank believes resilient growth outside the US, an eventual easing of energy pressures and already substantial expectations of Fed tightening should limit sustained Dollar gains.
According to Deutsche Bank; “This global growth environment is not consistent with US exceptionalism.”
The forecast is under pressure following the latest decline, but the bank argued that conditions did not justify assuming the Dollar’s advance would continue.
“This is the wrong time to be chasing EUR/USD lower,” the analysts added.
International Money Transfer? Ask our resident FX expert a money transfer question or try John’s new, free, no-obligation personal service! ,where he helps every step of the way,
ensuring you get the best exchange rates on your currency requirements.
TAGS: Euro Dollar Forecasts
Silver price (XAG/USD) extends its losses for the second successive day, trading around $64.10 per troy ounce during the Asian hours on Thursday. Silver faces increased downward pressure as both the US Dollar (USD) and US Treasury yields surge, driven by hawkish Federal Reserve (Fed) expectations and resilient domestic economic indicators.
TMGM Analysis: Financial Market News, Economic Calendar & Market Insights
The latest Flash US S&P Global PMI data for September highlighted this momentum, showing manufacturing expanding faster than expected at 52.0 and helping offset slight pullbacks in services and composite activity. Following these economic signals, market expectations for a 25-basis-point Fed rate hike in October surged to nearly 69.7%, up sharply from 48.7% last week.
Traders are now turning their attention to the upcoming US weekly Initial Jobless Claims report, while several Fed officials have reiterated support for the recent rate increase and issued fresh warnings regarding persistent inflation risks.
Fed’s Barr delivers a distinctly hawkish tone, with the FXS Speechtracker score at 8/10, above the 7/10 historical average and signaling a stronger-than-usual tightening bias. The emphasis that “further rate hikes [are] likely needed” and that risks to achieving 2% inflation have increased, while labor market risks have receded, underscores a clear prioritization of inflation control over growth concerns. The admission that the Fed was “out of position” and needed to “recalibrate” policy reinforces the message that the current stance may still be too loose, a backdrop that tends to support the Dollar and weigh on risk assets.
The FXS Fed Sentiment Index rose by 0.42 points to 148.81, firmly in hawkish territory well above the neutral 100 mark, consistent with the elevated FXS Speechtracker reading. This combination of a higher index level and above-baseline speech score confirms a market narrative of persistent Fed tightening risk, which should remain a supportive factor for the Dollar against lower-yielding peers.
Adding to the hawkish interest-rate outlook is a potential rebound in crude oil prices amid lingering uncertainty surrounding United States-Iran diplomatic talks. Speaking at the UN General Assembly, Iranian President Masoud Pezeshkian declared that Tehran would not yield to threats, reaffirming the country’s right to pursue nuclear technology for economic development. He also emphasized that Iran would restrict freedom of navigation through the strategic Strait of Hormuz for as long as US sanctions and blockades remain active. Because higher oil prices exacerbate inflationary pressures, these geopolitical tensions further reinforce expectations for prolonged monetary tightening, maintaining headwinds for Silver.
Silver is a precious metal highly traded among investors. It has been historically used as a store of value and a medium of exchange. Although less popular than Gold, traders may turn to Silver to diversify their investment portfolio, for its intrinsic value or as a potential hedge during high-inflation periods. Investors can buy physical Silver, in coins or in bars, or trade it through vehicles such as Exchange Traded Funds, which track its price on international markets.
Silver prices can move due to a wide range of factors. Geopolitical instability or fears of a deep recession can make Silver price escalate due to its safe-haven status, although to a lesser extent than Gold’s. As a yieldless asset, Silver tends to rise with lower interest rates. Its moves also depend on how the US Dollar (USD) behaves as the asset is priced in dollars (XAG/USD). A strong Dollar tends to keep the price of Silver at bay, whereas a weaker Dollar is likely to propel prices up. Other factors such as investment demand, mining supply – Silver is much more abundant than Gold – and recycling rates can also affect prices.
Silver is widely used in industry, particularly in sectors such as electronics or solar energy, as it has one of the highest electric conductivity of all metals – more than Copper and Gold. A surge in demand can increase prices, while a decline tends to lower them. Dynamics in the US, Chinese and Indian economies can also contribute to price swings: for the US and particularly China, their big industrial sectors use Silver in various processes; in India, consumers’ demand for the precious metal for jewellery also plays a key role in setting prices.
Silver prices tend to follow Gold’s moves. When Gold prices rise, Silver typically follows suit, as their status as safe-haven assets is similar. The Gold/Silver ratio, which shows the number of ounces of Silver needed to equal the value of one ounce of Gold, may help to determine the relative valuation between both metals. Some investors may consider a high ratio as an indicator that Silver is undervalued, or Gold is overvalued. On the contrary, a low ratio might suggest that Gold is undervalued relative to Silver.
The Japanese yen has become an important variable for currency markets in 2026, particularly after Japan returned to direct foreign exchange intervention. For traders studying the GBPJPY forecast, intervention risk matters because official yen buying can create sudden moves even when broader interest rate trends point in another direction. The key question is how intervention expectations interact with Bank of Japan policy, British monetary policy, positioning, and risk sentiment.
Foreign exchange intervention is designed to influence currency conditions, usually by buying or selling a currency in the market. When authorities buy yen, the immediate effect can be yen appreciation. Because GBP/JPY expresses the value of one pound in yen, stronger yen conditions can place downward pressure on the pair.
This makes intervention a major risk factor even though GBP/JPY is not the direct target of Japanese authorities. An intervention focused on dollar-yen can spread quickly across yen crosses as traders adjust positions. A sharp yen rally can therefore push GBP/JPY lower, potentially changing short-term technical structures and market expectations.
Japan’s intervention activity has made this risk more concrete in 2026. The Ministry of Finance stated that Japan purchased yen in coordination with the United States on July 31, describing the action as a response to excessive volatility and disorderly yen movements. The ministry also said it would not hesitate to conduct further joint intervention.
Reuters reported that Japan’s foreign exchange intervention between July 30 and August 26 reached 15.4 trillion yen, the largest intervention operation recorded in a single month. The yen initially strengthened sharply, although some of that move later reversed. These developments show why intervention is a practical risk when assessing yen crosses.
One of the most important developments for 2026 is the possibility that Japanese authorities could avoid identifying a specific exchange rate level before acting. Reuters reported in July that Japan was considering a more unexpected approach intended to make speculative yen selling more difficult.
For GBP/JPY traders, this increases uncertainty. If intervention is no longer preceded by obvious warnings or a predictable threshold, positioning around technical resistance becomes more complicated. A pair can remain supported by carry-trade dynamics and still experience a sudden decline if yen buying begins.
Intervention is only one part of the yen outlook. The Bank of Japan’s monetary policy also matters because higher Japanese interest rates can make yen-denominated assets relatively more attractive and reduce the incentive for some carry trades.
2026 developments have strengthened this connection. The Bank of Japan changed its monetary policy guidance in September, while market attention remained focused on the future path of rate increases. Reuters reported that the yen’s September rally had been strengthened by expectations for a more hawkish policy direction, although uncertainty remained over how quickly the central bank would continue tightening.
For GBP/JPY, this creates two sources of yen strength. A policy-driven yen rise can reinforce an intervention-driven move, making downward pressure on the pair more pronounced.
Intervention risk does not operate independently of the British pound. GBP/JPY reflects two economies, so developments in the United Kingdom remain important. If expectations for UK interest rates increase while Japanese policy stays comparatively cautious, the pound can receive support against the yen.
The opposite can also occur. If UK economic data weakens or expectations for further Bank of England tightening fade while Japanese rate expectations rise, the interest rate differential can move against the pound. In that environment, intervention risk could amplify an existing downward trend rather than create it from nothing.
Technical levels can become especially important during policy-sensitive periods because sudden yen buying may create sharp movements in GBP/JPY. Support and resistance zones can help identify areas where buying or selling pressure has previously appeared. A strong intervention move could push the pair below an established support level, while reduced intervention concerns and renewed carry-trade demand could support a recovery.
Moving averages and oscillators can also help assess whether market momentum is strengthening or weakening. However, technical indicators cannot anticipate unexpected intervention decisions. Instead, they can provide useful context for understanding existing price trends, momentum, and potential reactions when Japanese authorities enter the currency market.
Positioning is another important variable. When traders accumulate large short-yen positions, the market can become vulnerable to a rapid reversal. Intervention can force traders to close positions, creating additional yen demand and accelerating the move.
Risk sentiment also matters because the yen can respond to changes in global market confidence. A shift toward risk aversion may encourage investors to reduce leveraged positions and reconsider carry trades. For GBP/JPY, this can compound pressure created by Japanese policy actions.
Several developments deserve attention in late 2026. First, traders may watch Japanese government communication for signs that authorities consider yen movements excessive or disorderly. Second, Bank of Japan decisions and guidance will remain important for expectations about future rates. Third, UK inflation, growth, employment, and Bank of England communication can change the relative appeal of sterling.
The relationship between these factors matters more than any single headline. Intervention may produce a sharp short-term reaction, but sustained GBP/JPY direction can still depend on interest rate differentials and economic fundamentals.
Yen intervention risks can influence the GBPJPY forecast in 2026 because Japanese yen buying can transmit quickly into other yen crosses. The risk has become more significant after Japan’s intervention activity this year, while changing Bank of Japan policy expectations provide another potential source of yen strength. For GBP/JPY analysis, traders therefore need to monitor communication, intervention activity, Japanese and UK monetary policy, economic data, positioning, and technical levels together. This framework can explain why the pair may experience abrupt moves even when longer-term fundamentals appear stable.
However, the market must distinguish announced volumes from actual deliveries. This is not always the same thing. The pace of distribution can change as the balance between crude and products—a refinery question—comes into the picture, and the destinations receiving supplies will determine the practical impact. A barrel of crude oil in one country is not necessarily going to be the same as in others.
Improving Middle Eastern exports reinforced that pressure. Shipping data cited by Reuters showed exports exceeding pre-war levels on 4 days during the final week of September. That was well-received news, and that is part of what sent light sweet crude down. Meanwhile, Saudi Arabia reduced its November Arab Light selling price to Asian customers by $3 a barrel. Although not shown on this chart, it does show some relief. Both developments suggest greater availability in the short-term future.
The big distinction though is going to be that there is a difference between crude availability and refined fuel.
This is going to be a story about refiners before it is all said and done. From a technical analysis standpoint, the light sweet crude market is at an area that a lot of traders will be watching for confluence. The 50-day EMA, the $90 level, and the trend line all at least offer some hope.
The 2-year rate in the United States continues to be something I watch for signs of trouble. Ultimately, this is a market that shows that we still have quite a bit of stress out there, although it is fairly quiet today on Monday. Nonetheless, elevated rates do cause some issues for various risk appetite-based assets out there and are something that you need to be watching.
Gold recently underwent a sharp correction (dropping roughly 6% over September) after hitting historic all-time highs earlier in the year near $5,608.35 in January 2026. It hit a seven-week low near the $4,110–$4,150 range following a surge in Treasury yields.
Multi-decade-high US Treasury yields (with the 10-year yield near 5.3% and 30-year yields touching multi-year highs) have increased the opportunity cost of holding non-yielding assets like gold, putting severe downward pressure on prices.

Market expectations for Federal Reserve policy remain volatile Following mixed signals and stubborn inflation data (such as core PCE hovering around 3.0% y/y). Hawkish rhetoric from some Fed officials regarding potential rate hikes to counter persistent inflation has strengthened the U.S. dollar, weighing heavily on bullion.
Deadlocked negotiations involving the U.S. and Iran, combined with lingering shipping/export risks around the Strait of Hormuz, have kept crude oil volatile. While geopolitical conflicts typically boost gold as a safe-haven asset, the secondary inflationary shock of high oil prices has instead pushed yields higher, occasionally overriding gold’s traditional safe-haven bid.
Long-term support remains underpinned by robust central bank accumulation (led by countries like China and Poland) aiming to diversify reserves away from fiat currencies.
High absolute price levels have drastically altered physical demand dynamics globally—non-investment demand (like jewelry) has cooled significantly, while bar, coin, and ETF investment channels remain critical barometers for market direction. Major institutional desks (such as Morgan Stanley) view the $4,000 level as a major psychological and technical floor supported by structural central bank and Asian private sector demand.
Watch the $4,100 – $4,000 band as primary technical support. A sustained breakout back above $4,250 – $4,300 is required to invalidate the recent short-term bearish momentum.
Traders are closely monitoring incoming U.S. employment data (jobs reports) and upcoming Federal Open Market Committee (FOMC) meetings for further direction on interest rate trajectories.

Olumide Adesina
Financial Market Writer
Olumide Adesina is a French-born Nigerian financial writer. He tracks the financial markets with over 20 years of working experience in investment trading
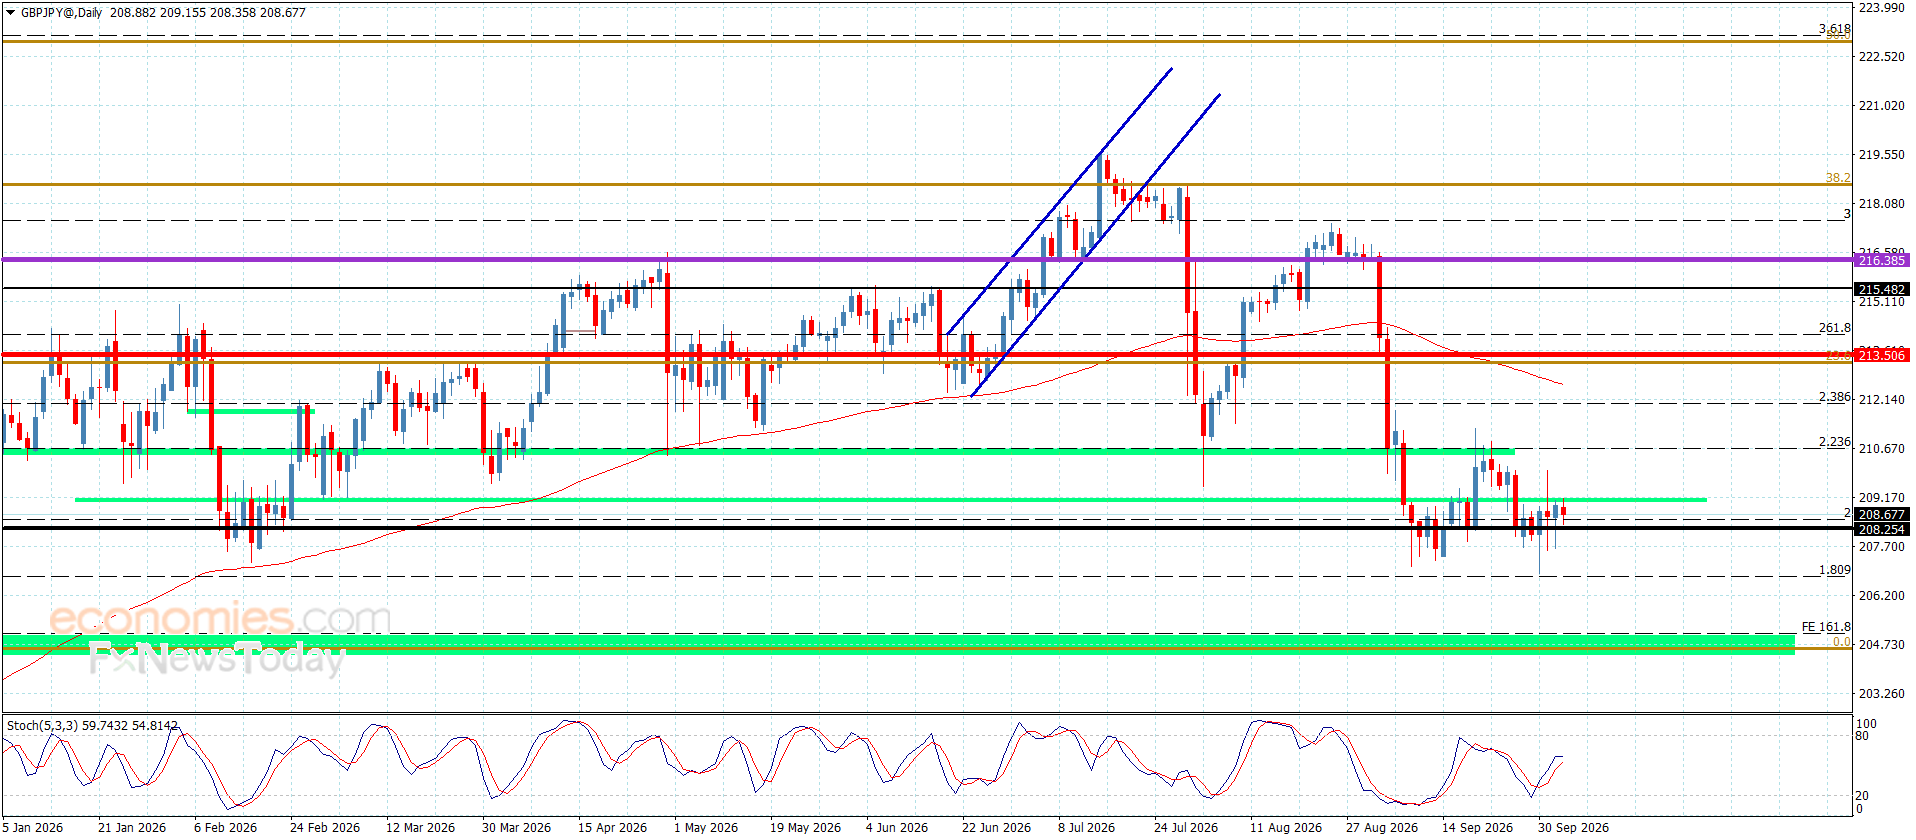
GBPJPY price continued to trade sideways with weak momentum, stabilizing near 208.60 and being affected by conflicting signals from the main indicators, particularly as the Stochastic indicator has remained above the 50 level recently.
We would like to reiterate that the repeated bearish stability below 210.40 barrier supports the chances of the price forming new bearish waves, with expectations of breaking below the obstacle at 208.10 and then renewing attempts to reach the bearish targets at 206.80 and 206.25.
The expected trading range for today is between 206.80 and 209.55.
Trend forecast: Bearish
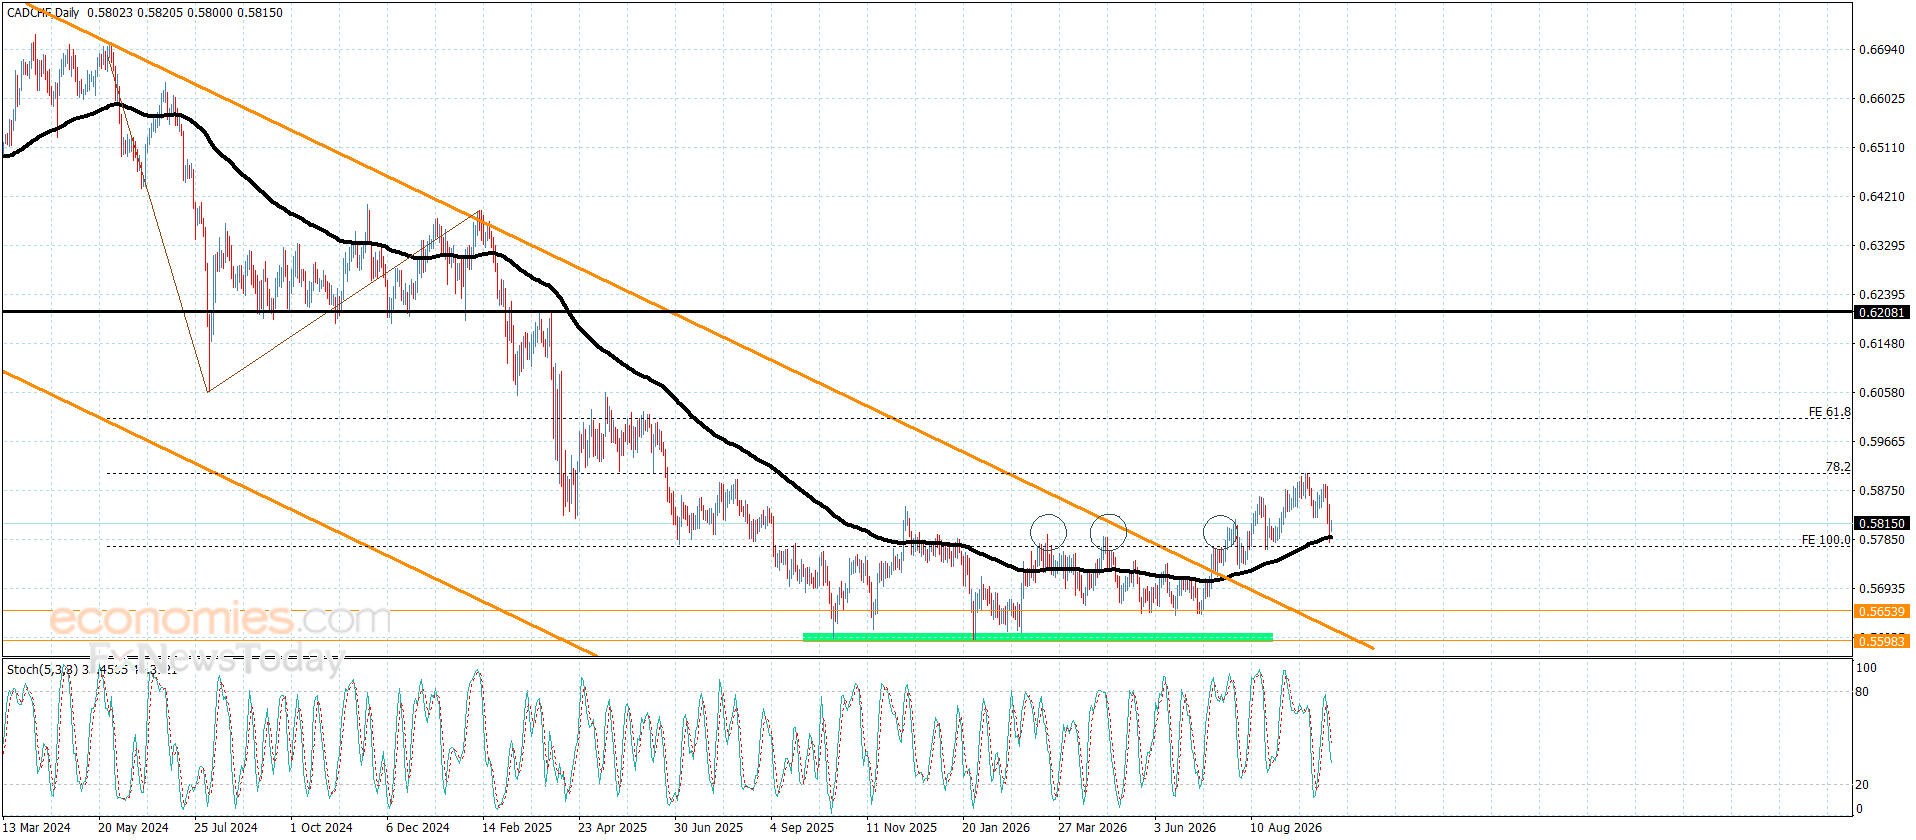
CADCHF price surrendered its recent positive momentum after failing to stabilize above the 0.5900 barrier, forcing it to activate a corrective move and slip toward 0.5780, approaching the initial support at 0.5770.
As shown on the chart, the 55-period moving average is positioned above the aforementioned initial support, attempting in turn to curb the negative impact on the current trading and provide the price with an opportunity to gather positive momentum, with the aim of forming new bullish waves and targeting 0.5845 and 0.5880.
The expected trading range for today is between 0.5780 and 0.5845.
Trend forecast: Bullish