The main category of All News Articles.
You can use the search box below to find what you need.
[wd_asp id=1]
The main category of All News Articles.
You can use the search box below to find what you need.
[wd_asp id=1]
Welcome, my fellow traders! I have prepared a price forecast for US Crude, XAUUSD, and EURUSD using a combination of the margin zones method and technical analysis. Based on the market analysis, I suggest entry signals for intraday traders.
Gold continues to trade under selling pressure.
The article covers the following subjects:
The oil price is maintaining a short-term uptrend. On Friday, the asset tested support A at 96.45–96.01. As a result, bulls managed to hold this zone. Today, the price opened with a gap and reached the first bullish target of 98.40.
Consequently, some of the remaining long trades can be shifted to the breakeven point and held until the second target of 100.75 is reached. If oil breaks below support A, the correction will extend toward support B of 94.27–93.61.
Hold part of the long trades opened at support A of 96.45–96.01. TakeProfit: 98.40, 100.75. StopLoss: at breakeven.
Gold remains under selling pressure. Last week, the price reached the first bearish target of 4,367. The second target is at 4,282. This level lies within the Gold Zone of 4,286–4,276. Therefore, if the price breaks below this zone, it may slide further to the Target Zone 2 of 4,158–4,135.
Hold part of the short trades opened at resistance B of 4,451–4,436. TakeProfit: 4,282. StopLoss: at breakeven.
After reaching the first bullish target set for trades opened at support B of 1.1585–1.1572, the euro price reversed lower. Today, it is attempting to break below support B. If it settles below this zone, the trend will turn bearish. In that case, consider short trades tomorrow, targeting the lower Target Zone of 1.1459–1.1434.
If the euro price returns to support B and forms a buy pattern, consider long trades, with the first target at 1.1642 and the second one at the August 21 high of 1.1711.
Watch the market.
Would you like to learn more about technical analysis methods and principles? Explore our comprehensive guide.
P.S. Did you like my article? Share it in social networks: it will be the best “thank you” 🙂
Useful links:
The content of this article reflects the author’s opinion and does not necessarily reflect the official position of LiteFinance broker. The material published on this page is provided for informational purposes only and should not be considered as the provision of investment advice for the purposes of Directive 2014/65/EU.
According to copyright law, this article is considered intellectual property, which includes a prohibition on copying and distributing it without consent.
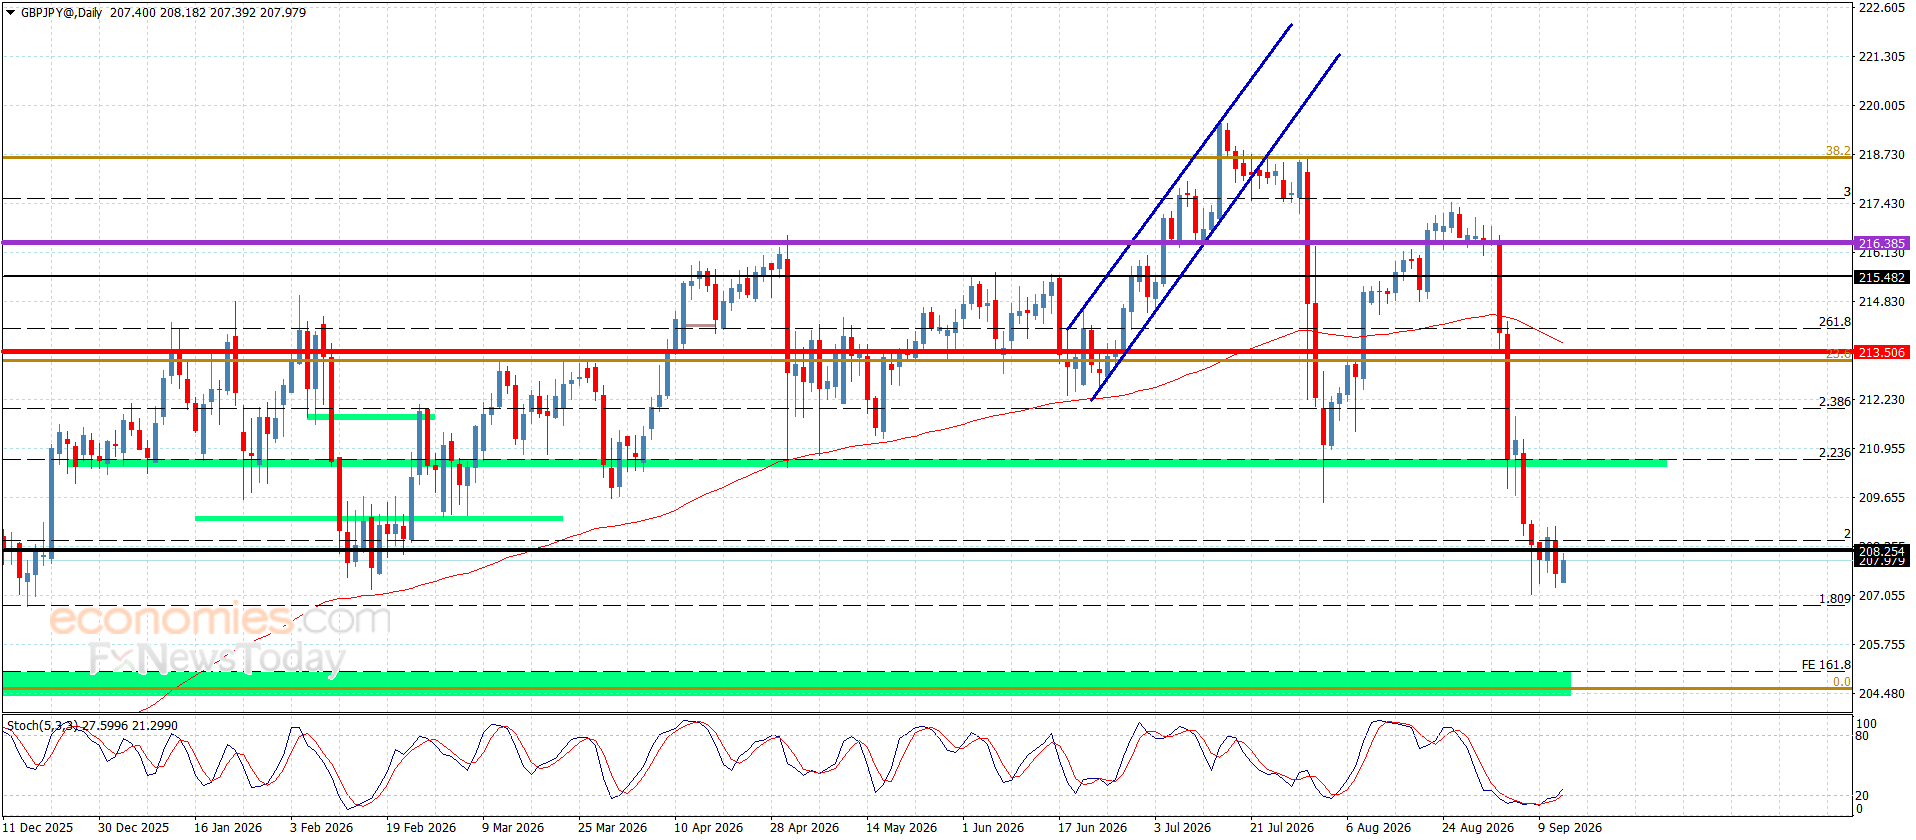
The GBPJPY pair provided more negative closes by moving away from 210.40 barrier, forming bearish waves by its stability below 208.10 level, announcing its readiness to resume the previously suggested negative trend.
Gathering extra negative momentum makes us expect reaching 206.70 level, where surpassing it will open the way for targeting more negative stations, to reach 205.90 and 205.10.
The expected trading range for today is between 206.70 and 208.70
Trend forecast: Bearish
But as things stand right now, it looks like the natural gas market is stuck between $3 on the top and somewhere right around $2.80 on the bottom. The 50-day EMA is flat, and the 200-day EMA sits above the $3 level, but it is drifting lower.
Ultimately, this, at least from what I can tell, still looks very range-bound. As a result, I have to play it that way. This time of year, we start to shift from bearish seasonality to neutral, and this is an interesting time of year because longer-term traders quite often will be putting their positions on.
Ultimately, we are going to need to see a significant drawdown in storage to make things change. We have not really seen that yet, and at last count, we were still running at about 5% above the five-year average as far as storage is concerned. So, there are still some bearish headwinds, but we are starting to think about winter.
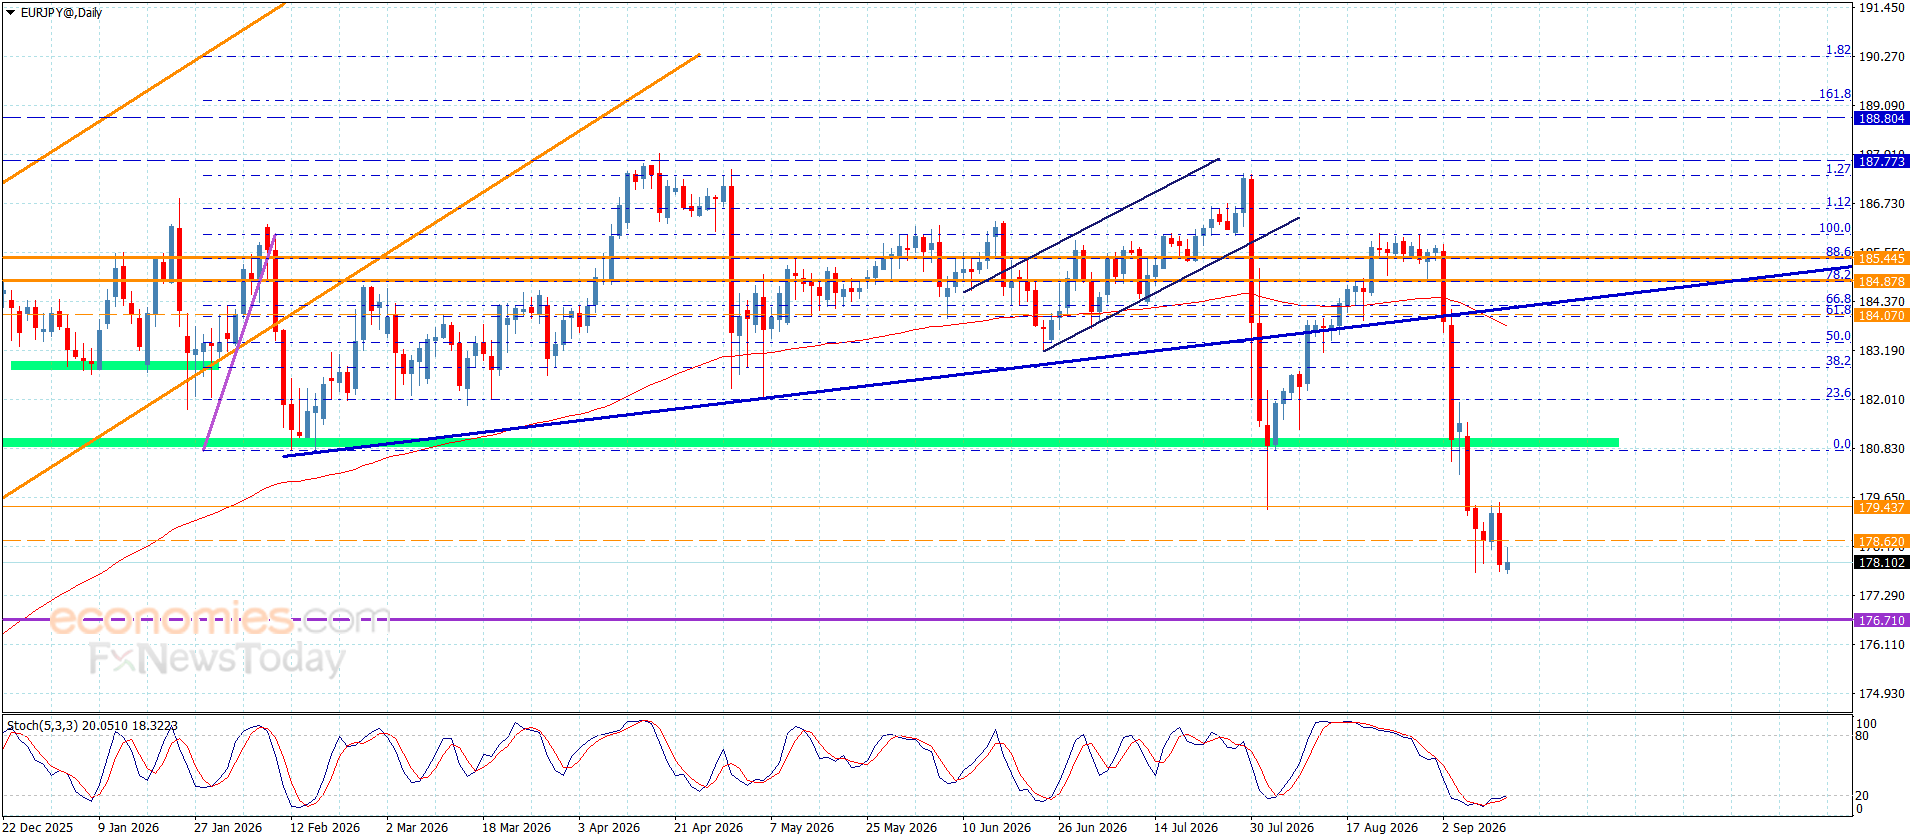
The EURJPY pair confirmed its readiness to resume the main bearish trend by providing a negative close again below the main barrier at 180.80 level, reaching 177.85 in Friday, achieving the previously awaited initial target.
The continuation of providing negative momentum by the main indicators will increase the efficiency of the negative trend, which might target new negative stations that begin at 177.35 reaching the next support near 176.70.
The expected trading range for today is between 177.35 and 178.60
Trend forecast: Bearish
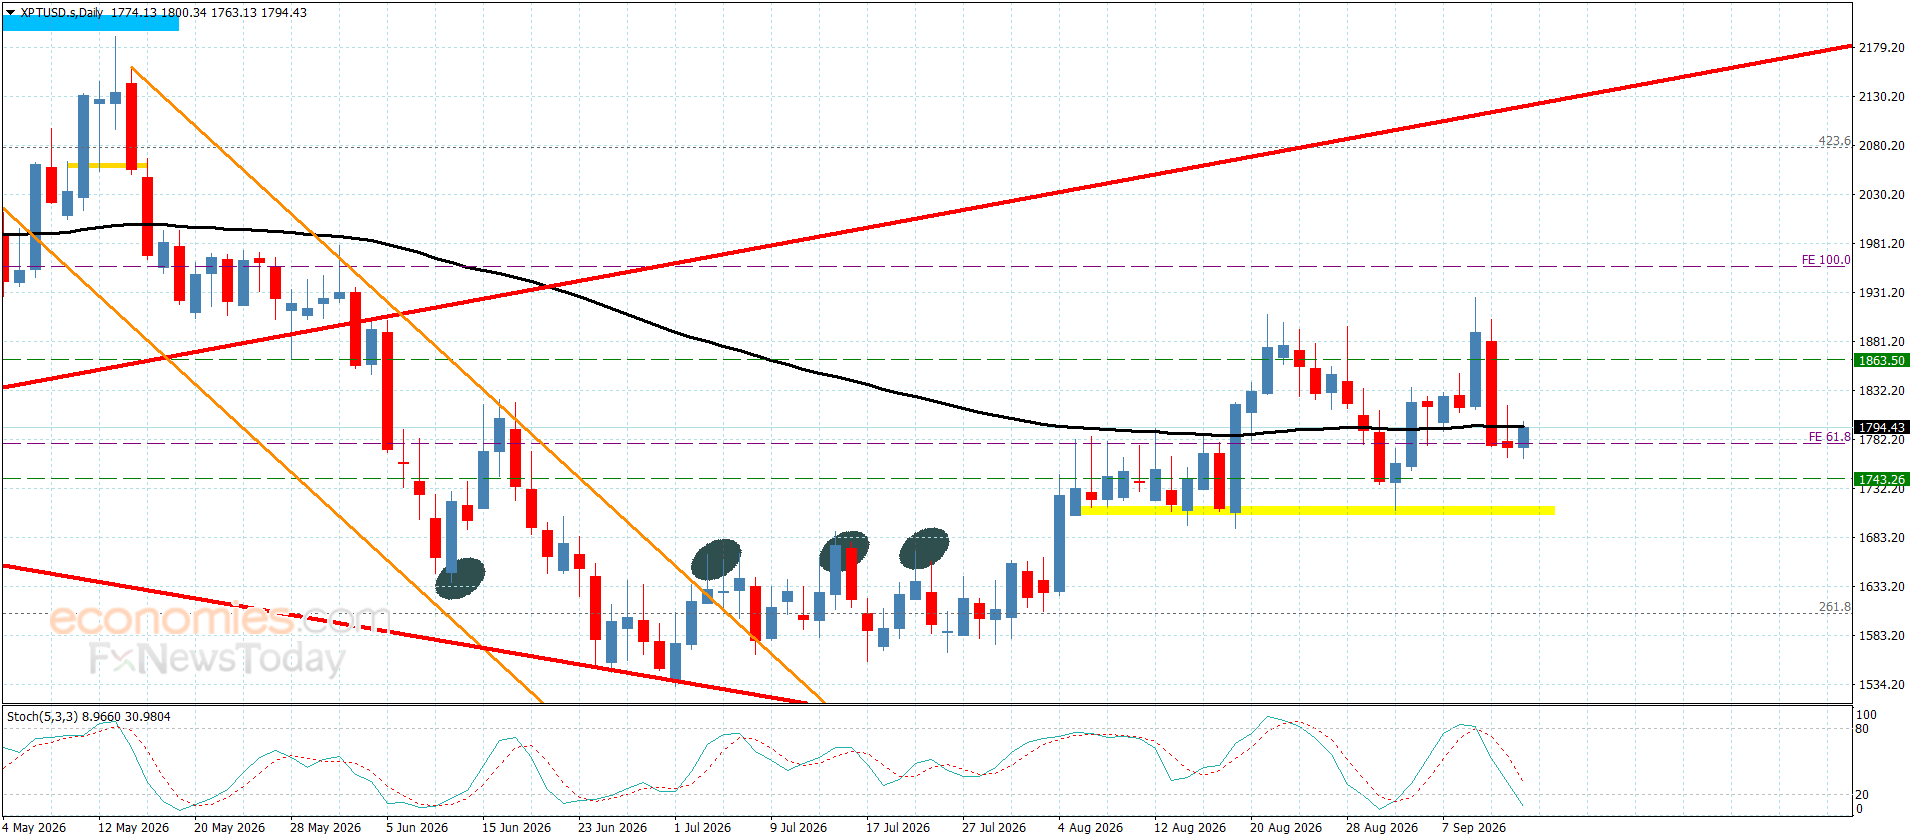
Despite the stability of platinum price above $1705.00 support level, it faced negative pressure by stochastic attempt to reach the oversold levels, and forming a strong obstacle at 1840.00 level against the current trading pushed it to form new sideways moves by its stability near $1790.00.
Note that the continuation of providing negative momentum by the main indicators might push the price to renew the pressure on the previously mentioned support, to monitor its behavior to detect the suggested targets in the upcoming trading.
The expected trading range for today is between $1705.00 and $1840.00
Trend forecast: Fluctuating within the bullish trend
Focus for the Euro is what occurs post the recent European Central Bank (ECB) decision. The ECB chose to increase interest rates by 25 basis points for the second time in 2022. Renewed increases in inflation, driven by rising energy prices, has policymakers focused on good policymaking. EUR/USD initially sold off on the news as investors digested the growing income risks against slowing economic conditions. Speeches from President Lagarde and many of her colleagues are due at various points today, market participants should closely follow these speeches for update on future policy decisions.
For sterling, the main event this Thursday is the Bank of England meeting. About 75% of participants expect the BoE to stand pat. In the absence of any blow-up Middle East conflict, we’ll see increased re-invigoration in demand for higher yielding assets. However, ruptures to Middle East Oil continue to grow and will further increase oil prices. Increased oil prices will lead to inflation in the UK, narrowing policy divergences between the BoE, Fed and ECB.
Fundamental bias: DXY moderately bullish, EUR neutral, GBP neutral, with this week’s Fed and BoE decisions likely to determine the next major policy divergence.
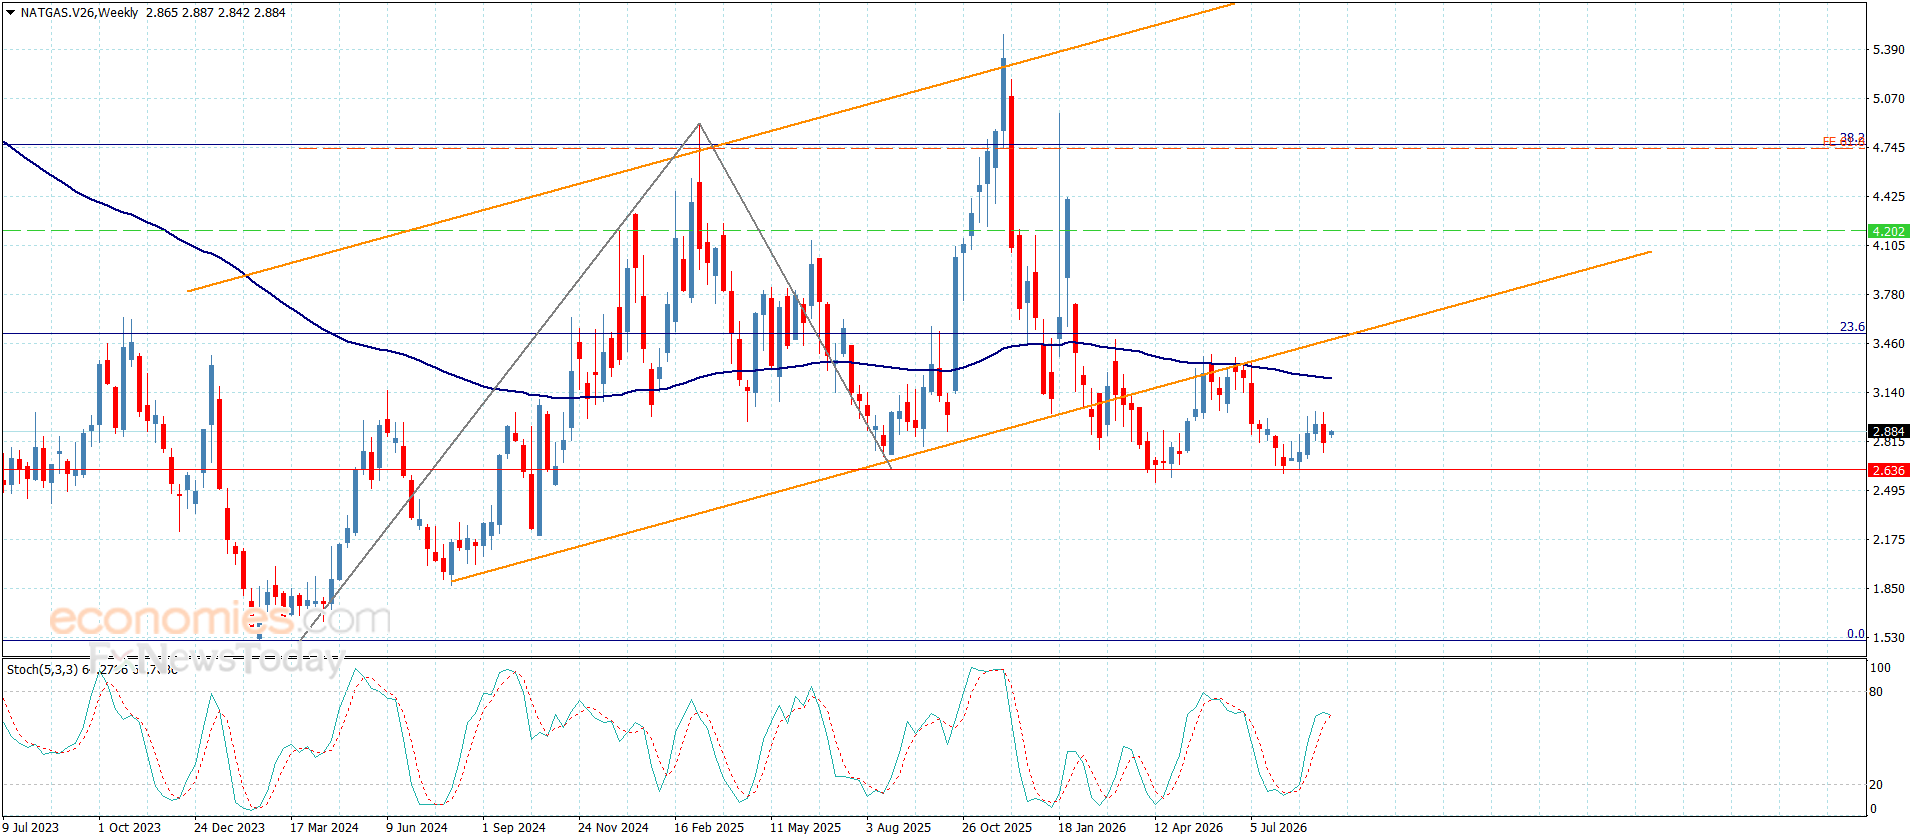
Despite the weakness of natural gas price’s last trading, its stability above the support level of $2.620 makes us keep the bullish trend, to notice its rally to settle near $2.880 level.
Note that stochastic stability above 50 level will increase the chances of gathering positive momentum in the current trading to form new bullish waves, paving the way towards surpassing $2.920 level and reaching the next target at $3.100.
The expected trading range for today is between $2.760 and $3.100
Trend forecast: Bullish
But a 25 basis point increase may already be priced in. Therefore, USD/JPY could decline more sharply if Ueda talks at the next couple of meetings about another hike or if he indicates that rates might be raised beyond 1.75%. A dovish press conference might have the opposite effect and move USD/JPY higher.
On the other hand, the expectation of a 25 basis point Fed rate hike in September has increased by 87% after the US inflation data. If both central banks raise rates by 25 basis points, the interest rate gap would remain broadly unchanged.
This could limit the immediate gains in yen. The move in USD/JPY would then depend mainly on which central bank signals a faster pace of future tightening.
USD/JPY remains under extreme pressure in the short term after failing at the long-term resistance zone of 160-162. The pair produced a high of 163.98 on July 20 but failed to hold it and dropped sharply. This drop indicates that the pair is moving toward the 150 area in the short term to find the next support.
This support is defined by the ascending channel pattern that stretches from the January 2023 lows. If this support holds and bottom forms around 150, it will likely initiate another rally toward 160-162.
The formation of bottoms in December 2023, September 2024 and April 2025 suggests positive price action in USD/JPY. Therefore, a confirmed break above the 162 level will likely open the way to higher levels, possibly reaching 175.
The Silver price recovered to $64.48 an ounce on Friday, clawing back less than a third of Thursday’s losses.
The 1.64% rebound still left XAG/USD down 2.6% over the week, with the metal needing a sustained recovery to reach UBS’s forecasts.
The bank’s silver price forecast starts at $70 in December 2026, rises to $75 in March and June 2027, then reaches $80 that September.
UBS has retained its earlier September projections, with December’s $70 estimate around 8.6% above Friday’s close and September 2027’s $80 target 24% higher.

Silver prices gained despite US core inflation accelerating to 0.3% month-on-month in August from 0.2% in July.
UBS had already anticipated a rate rise before those figures arrived.
The bank said on 10 September: “Our economists’ base case is that the Fed will raise its policy rate by 25bps. Given current market expectations, the hike itself should have a relatively limited impact.”
Its focus was the accompanying message: “More important will be whether markets interpret the decision and the tone of the subsequent press conference as leaning hawkish or dovish.”
In its currency outlook, UBS added: “In our base case, we do not expect a hawkish hike that would provide broad support for the dollar.”
That leaves room, in our view, for silver to recover even if US rates rise, provided the dollar does not strengthen materially.
The Fed’s 15–16 September meeting will test that reading, with most of Thursday’s silver losses still unrecovered.
Our currency coverage draws on live market data, official economic releases and published bank research.
The article covers the following subjects:
Consider long positions from corrections above 92.50 with a target of 115.50–125.50.
Breakout and consolidation below 92.50 will allow the asset to continue declining to the levels of 78.58–67.00.
On the weekly chart, a descending correction has likely finished developing as the second wave of larger degree (2) and an ascending third wave (3) is forming. On the daily chart, apparently, the first wave of smaller degree 1 of (3) has formed, a local correction has been completed as wave 2 of (3), and the third wave 3 of (3) is unfolding. Wave i of 3 continues developing on the H4 chart; within it, wave (iii) of i is unfolding. If the presumption is correct, WTI will continue to rise to 115.50–125.50. The level of 92.50 is critical in this scenario as a breakout below it will enable the asset to continue declining to the levels of 78.58–67.00.
This forecast is based on the Elliott Wave Theory. When developing trading strategies, it is essential to consider fundamental factors, as the market situation can change at any time.
The content of this article reflects the author’s opinion and does not necessarily reflect the official position of LiteFinance broker. The material published on this page is provided for informational purposes only and should not be considered as the provision of investment advice for the purposes of Directive 2014/65/EU.
According to copyright law, this article is considered intellectual property, which includes a prohibition on copying and distributing it without consent.