The main category of All News Articles.
You can use the search box below to find what you need.
[wd_asp id=1]
The main category of All News Articles.
You can use the search box below to find what you need.
[wd_asp id=1]
Welcome, my fellow traders! I have prepared a price forecast for the USCrude, XAUUSD, and EURUSD using a combination of the margin zones method and technical analysis. Based on the market analysis, I suggest entry signals for intraday traders.
The euro continues to keep its bearish bias.
The article covers the following subjects:
USCrude: Oil is attempting to rebound, but selling pressure still persists.
XAUUSD: Gold is approaching the support A of 4,091–4,080.
EURUSD: The euro is declining from the resistance B of 1.1482–1.1468.
Oil is correcting upward within the short-term downtrend, targeting the resistance level A of 73.23–72.67. Once this resistance is reached, consider short positions with targets of 70.15 and 67.06.
If the resistance A is pierced, the correction will likely continue toward the resistance B of 76.31–75.47. Short positions can also be considered near this key level.
Sell near resistance A at 73.23–72.67. TakeProfit: 70.15, 67.06. StopLoss: 74.65.
Gold is correcting downward in the short-term uptrend toward the support A of 4,091–4,080. Once this zone is reached, consider long positions with targets of 4,141 and 4,202. If the support A is broken through today, the price will likely reach the support B of 4,036–4,019. This level acts as a trend boundary, so buying opportunities may also appear near it.
Buy near support A of 4,091–4,080. TakeProfit: 4,141, 4,202. StopLoss: 4,052.
The euro keeps its bearish bias today. Last week, the price tested the resistance B of 1.1482–1.1468. Sellers defended the zone, and the price began to decline toward the first bearish target of 1.1403. Therefore, short positions can be kept open today until this target is reached. The second target is the June low near 1.1324.
If the euro exceeds the resistance B today, the short-term downtrend will reverse. In that case, consider buying the pair with a target in the upper Target Zone of 1.1641–1.1612.
Hold short trades opened at resistance B of 1.1482 – 1.1468. TakeProfit: 1.1403, 1.1324. StopLoss: 1.1512.
Would you like to learn more about technical analysis methods and principles? Explore our comprehensive guide.
P.S. Did you like my article? Share it in social networks: it will be the best “thank you” 🙂
Useful links:
The content of this article reflects the author’s opinion and does not necessarily reflect the official position of LiteFinance broker. The material published on this page is provided for informational purposes only and should not be considered as the provision of investment advice for the purposes of Directive 2014/65/EU.
According to copyright law, this article is considered intellectual property, which includes a prohibition on copying and distributing it without consent.
The EURJPY pair benefited from the positive stability above 184.10 support, forming several bullish waves, achieving some gains by reaching 185.55 level, facing %61.8 Fibonacci correction level, which forces it to decline directly towards 184.90.
The current decline will not threaten the attempt of activating the bullish trend, depending on the stability of the mentioned support, therefore, we will keep waiting for gathering extra bullish momentum to ease the mission of reaching 185.85, and surpassing this barrier will extend the trading towards achieving extra gains that begin at 186.20 and 186.60.
The expected trading range for today is between 184.60 and 185.85
Trend forecast: Bullish
Platinum price attempted to settle within the minor bearish channel’s levels by its fluctuation near $1605.00 level, taking advantage of the negative factors that are represented by forming main barrier at $1745.00 level, besides the attempt of providing negative momentum by the main indicators, especially by stochastic stability below 80 level.
Therefore, we will keep preferring the bearish trend in the near trading, to expect breaking $1600.00 level and holding below it to begin targeting negative stations, which might begin at $1570.00 and $1510.00.
The expected trading range for today is between $1570.00 and $1650.00
Trend forecast: Bearish
– Written by
Frank Davies
STORY LINK GBP/USD Forecast: ISM Services and UK Politics Leave Pound Sterling Flat
The Pound US Dollar (GBP/USD) exchange rate traded in a narrow range on Monday, as easing UK political concerns and renewed dip-buying in the US Dollar (USD) left the pairing without a clear direction.
At the time of writing, GBP/USD was trading at $1.3352, virtually unchanged on the day.
The US Dollar found some support on Monday as US markets reopened after the extended Independence Day break.
The ‘Greenback’ appeared to have drifted into oversold territory following last week’s sharp selloff, which came after the latest non-farm payrolls report revealed a much steeper-than-expected slowdown in job creation.
This encouraged some bargain hunters back into the market, allowing the US Dollar to recoup a portion of its recent losses.
At the same time, the latest ISM services PMI matched forecasts, slipping from 54.5 in May to 54 in June. While the reading pointed to a modest loss of momentum, it remained comfortably in expansion territory, suggesting the US services sector was still performing relatively well.
The Pound (GBP) remained resilient on Monday as investors continued to unwind some of the political risk premium that had recently weighed on Sterling.
Get better rates and lower fees on your next international money transfer.
Compare TorFX with top UK banks in seconds and see how much you could save.
Markets appear increasingly convinced that MP Andy Burnham will become the next Prime Minister without a prolonged Labour leadership contest causing further uncertainty.
Since announcing his bid for the Labour leadership, Burnham has attempted to calm market nerves by pledging to stick to the government’s current fiscal rules, while also setting out an ambitious economic agenda.
This has helped reassure GBP investors, allowing Sterling to hold firm as fears over UK political instability continue to fade.
Looking ahead, Tuesday’s data calendar is relatively quiet, with the US weekly ADP employment change figure the only notable release.
Although not a top-tier indicator, the report could still lend the US Dollar some support if it points to solid growth in private-sector hiring.
Beyond the data, broader market sentiment may also drive movement in the pairing. A weaker appetite for risk could favour the safe-haven US Dollar, while a brighter mood may help the increasingly risk-sensitive Pound.

As a result, any shifts in risk appetite could leave GBP/USD trading unevenly.
International Money Transfer? Ask our resident FX expert a money transfer question or try John’s new, free, no-obligation personal service! ,where he helps every step of the way,
ensuring you get the best exchange rates on your currency requirements.
TAGS: Pound Dollar Forecasts
Goldman Sachs revised its 12-month USD/JPY forecast to 165 from 155 on July 6, 2026, placing it among the most bearish calls in Bloomberg’s surveyed consensus, as strategist Karen Reichgott Fishman cited Japan’s fiscal pressures, persistently elevated US Treasury yields, and only gradual Bank of Japan rate hikes as the structural drivers of continued yen depreciation.
The yen was trading at 161.79 per dollar in early Asian trading that Monday, down 0.3% on the session and near its weakest level since 1986, cementing its position as one of the worst-performing major currencies in 2026.
Goldman’s three-month target moved to 162 from 160, and its six-month target to 163 from 158 – a consistent upward shift across the entire forward curve that signals conviction rather than a single-point revision.
Foreign exchange options markets are aligned: traders assign roughly a 72% probability that USD/JPY reaches 165 by June 2027, per Bloomberg data, while hedge fund net short positioning on the yen hit its most extreme level since 2017 last month.

Goldman Sachs outlook hinges on the rate differential between US Treasuries and Japanese Government Bonds, suggesting continued depreciation pressure on the yen despite its current undervaluation.
With the Federal Reserve maintaining high rates and elevated Treasury yields, capital is shifting from yen-denominated to dollar-denominated assets, exerting ongoing selling pressure on the JPY.
Japan’s fiscal challenges worsen the situation, as high debt servicing costs limit policy flexibility and undermine efforts to defend the yen.
Mark Cranfield from Bloomberg highlights that investors remember the significant drop in USD/JPY in the 1980s, indicating that the current 160–165 range isn’t unprecedented.
The Bank of Japan ended its negative-rate policy and yield-curve control in early 2025 but maintains a near-zero policy rate, emphasizing gradualism to protect growth.
A modest 25-basis-point hike does not close the gap with US rates, keeping the yen a low-yield funding currency. Goldman Sachs believes the BOJ’s tightening will remain too slow to impact its 12-month forecast.
The August 2024 rate surprise showed that such assumptions can lead to rapid yen rallies, compressing USD/JPY and triggering volatility across equities and crypto.
This incident highlighted the risks of crowded yen short positions, making Goldman Sachs 165 target a cautious base case with significant tail risks.
Goldman endorses the yen carry trade, leveraging low JPY borrowing to invest in higher-yielding assets, expecting this strategy to remain viable through mid-2027 due to persistent yen weakness.
This scenario supports broader risk-on behavior in equities, credit, and crypto markets. However, the significant short-yen positioning among hedge funds raises concerns; any sudden yen strength could lead to a disorderly unwinding of carry trades.
This is reminiscent of the sharp crypto volatility seen in August 2024, with the potential unwind now greater due to extended positioning.
Japan’s Ministry of Finance is believed to have intervened in late April and early May when USD/JPY briefly exceeded 160, with BOJ data showing a drop in current account balances consistent with FX support operations totaling about ¥9.8 trillion (around $62 billionBn).
Fishman notes that while such interventions may buy time, they do not change the yen’s structural weakness. Goldman’s view suggests that macro headwinds, yield gaps, and the BOJ’s limited pace of easing will overwhelm policy efforts over the next year.
While interventions can temporarily compress USD/JPY by several hundred pips, without significant shifts in interest-rate differentials, such actions historically reverse. The 165 target reflects potential intervention without suggesting a lasting trend reversal.
The author does not hold any position in the securities discussed in the article.
Silver (XAG/USD) pauses a four-day winning streak on Monday as buyers take a breather following last week’s 5.55% rally. A firmer US Dollar (USD) is also capping the precious metal’s upside. At the time of writing, XAG/USD is trading around $61.75, easing from its intraday high of $63.28, the highest level since June 23.
The US Dollar Index (DXY), which tracks the Greenback’s value against a basket of six major currencies is trading around 101.12, up 0.22% on the day.
Despite Monday’s modest pullback, Silver’s near-term outlook remains supported by easing expectations of a near-term Federal Reserve (Fed) interest rate hike following weaker-than-expected US Nonfarm Payrolls (NFP) data released on Thursday.
However, the technical picture tells a different story, as Silver remains capped below both its short- and long-term moving averages.
In the daily chart, XAG/USD remains in a bearish near-term bias as price holds below the 21-day Simple Moving Average (SMA) at $63.45 and the broader 200-day SMA at $70.06, underscoring a market that is still capped by medium- and long-term trend resistance.
The Relative Strength Index (RSI) has recovered from oversold levels but remains around 42, while the Moving Average Convergence Divergence (MACD) has turned slightly positive, suggesting the rebound may be temporary within the broader downtrend.
On the topside, initial resistance emerges at the 21-day SMA near $63.45, with a more meaningful barrier at the $70 horizontal level, reinforced by the 200-day SMA at $70.06 and the 50-day SMA at $71.05 clustering just above.
Further up, the 100-day SMA around $74.81 precedes additional caps at $80 and $90. On the downside, the next notable support is the horizontal floor near $55.00, where buyers could attempt to stabilize the decline if bearish pressure resumes.
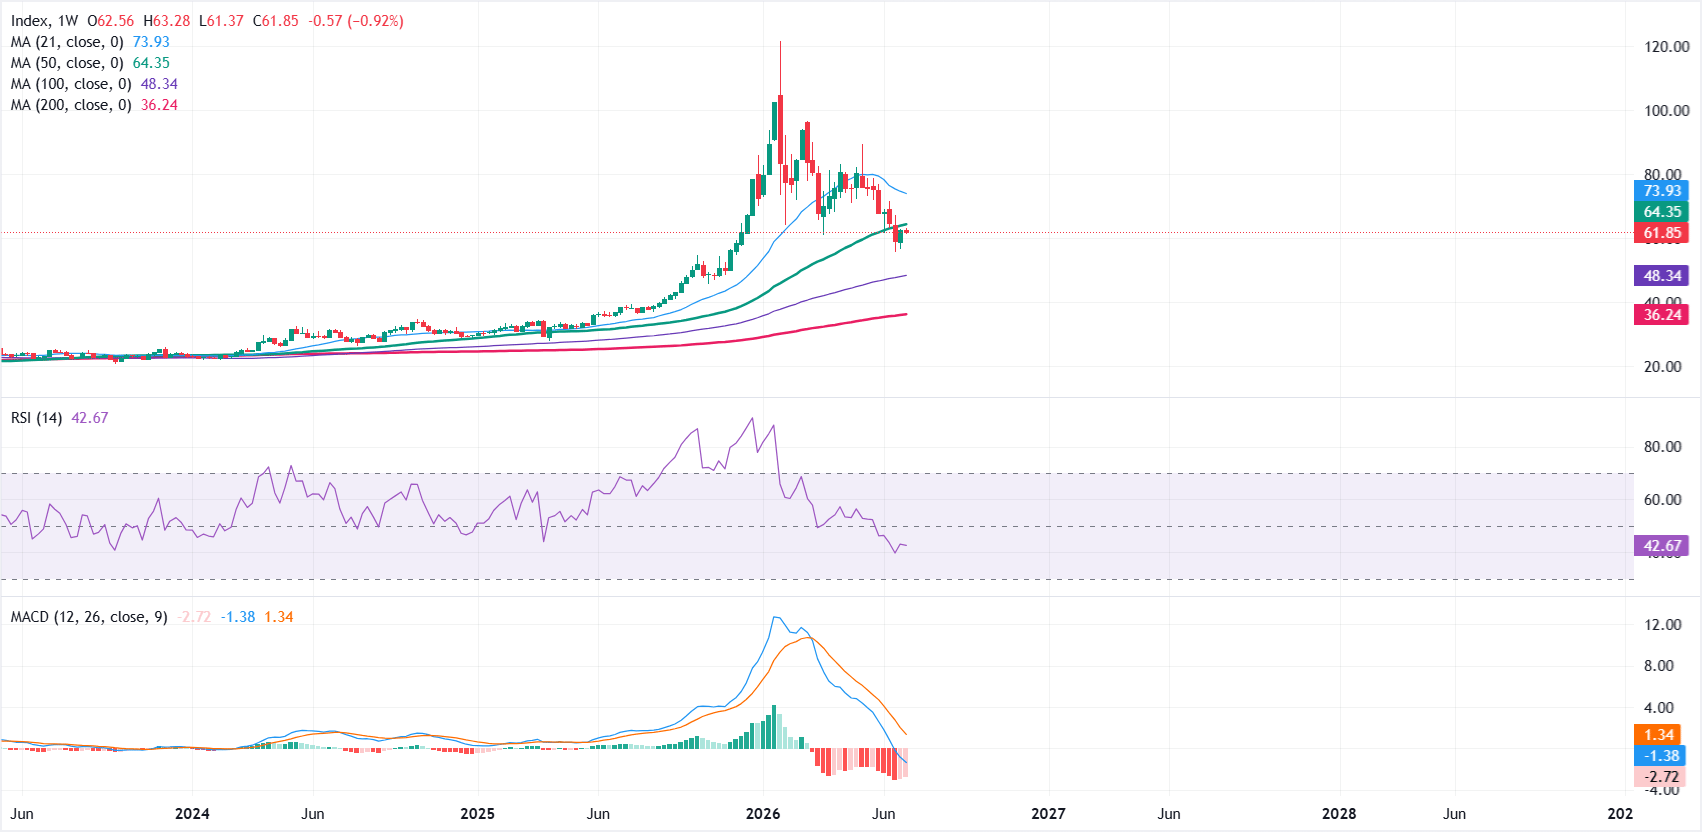
In the weekly chart, XAG/USD holds a clear bullish structural bias as price remains well above the 100-week and 200-week Simple Moving Averages (SMAs) at roughly $48.34 and $36.24, respectively, underscoring a firmly supported medium-term uptrend.
Momentum, however, looks subdued: the RSI hovers near 43, while the Moving Average Convergence Divergence (MACD) remains negative, which together hint that upside traction is waning despite the broader bullish backdrop.
On the topside, initial resistance emerges at the 50-week SMA near $64.35, with a stronger barrier higher up at the 21-week SMA around $73.93, levels that would need to be reclaimed to revive a more aggressive bullish phase.
On the downside, immediate support is seen at the 100-week SMA at $48.34, ahead of the deeper structural floor at the 200-week SMA near $36.24, where the broader bullish trend would be expected to attract buyers on a more pronounced correction.
(The technical analysis of this story was written with the help of an AI tool. Know more.)
Silver is a precious metal highly traded among investors. It has been historically used as a store of value and a medium of exchange. Although less popular than Gold, traders may turn to Silver to diversify their investment portfolio, for its intrinsic value or as a potential hedge during high-inflation periods. Investors can buy physical Silver, in coins or in bars, or trade it through vehicles such as Exchange Traded Funds, which track its price on international markets.
Silver prices can move due to a wide range of factors. Geopolitical instability or fears of a deep recession can make Silver price escalate due to its safe-haven status, although to a lesser extent than Gold’s. As a yieldless asset, Silver tends to rise with lower interest rates. Its moves also depend on how the US Dollar (USD) behaves as the asset is priced in dollars (XAG/USD). A strong Dollar tends to keep the price of Silver at bay, whereas a weaker Dollar is likely to propel prices up. Other factors such as investment demand, mining supply – Silver is much more abundant than Gold – and recycling rates can also affect prices.
Silver is widely used in industry, particularly in sectors such as electronics or solar energy, as it has one of the highest electric conductivity of all metals – more than Copper and Gold. A surge in demand can increase prices, while a decline tends to lower them. Dynamics in the US, Chinese and Indian economies can also contribute to price swings: for the US and particularly China, their big industrial sectors use Silver in various processes; in India, consumers’ demand for the precious metal for jewellery also plays a key role in setting prices.
Silver prices tend to follow Gold’s moves. When Gold prices rise, Silver typically follows suit, as their status as safe-haven assets is similar. The Gold/Silver ratio, which shows the number of ounces of Silver needed to equal the value of one ounce of Gold, may help to determine the relative valuation between both metals. Some investors may consider a high ratio as an indicator that Silver is undervalued, or Gold is overvalued. On the contrary, a low ratio might suggest that Gold is undervalued relative to Silver.
– Written by
Frank Davies
STORY LINK Euro to Dollar Week Ahead Forecast: Weak US Jobs Data Puts Fed Outlook in Focus
The Euro to Dollar exchange rate (EUR/USD) has stabilised above the 1.14 level after weaker-than-expected US jobs data prompted investors to reassess expectations for further Federal Reserve interest-rate hikes.
While the softer labour market report has eased some of the Dollar’s recent momentum, analysts remain divided over whether the pause is temporary or the start of a broader reversal.
Danske Bank maintains a 12-month Euro to Dollar (EUR/USD forecast of 1.12 as the US raises interest rates.
In contrast, Scotiabank is still backing EUR/USD gains to 1.22 by the end of 2026 as yields don’t back dollar gains.
EUR/USD again found support below 1.14 during the week and secured a limited net recovery to near 1.1450.
Interest rate expectations will be a key element with a particular focus on the Federal Reserve. Danske Bank commented; “We forecast two hikes for December and March. We see relative monetary policy as a negative driver for EUR/USD, especially towards 2027.”
Get better rates and lower fees on your next international money transfer.
Compare TorFX with top UK banks in seconds and see how much you could save.
The latest US employment report was weaker than expected with the increase in non-farm payrolls held to 57,000 for June compared with consensus forecasts of around 115,000. The main feature was a sharp drop in the labour force.
In response, there were fresh doubts whether the Fed would hike interest rates which curbed dollar support.
MUFG commented; “the tariffs implemented in 2025 are set to fall out of the annual CPI calculations over the coming months that will add downside pressure to annual inflation while a quirk in rental inflation should also reverse in H2. That will help ease Fed concerns over inflation risks that should see yields decline going forward.”
It added; “Apart from the RBNZ, no other G10 central bank has as much tightening priced as the Fed and hence there is scope for US yields to fall relative to elsewhere. This should see this recent dollar buying momentum reverse. We would also expect some renewed focus on US fiscal risks.”
Scotiabank also considers Fed expectations have overshot; “We see the USD’s latest gains as being counter to the longer-term fundamental trend, and see little upside from current levels.
It added; “The Fed’s belated reaction to the inflationary pressures arising from the US/Iran conflict have delivered a material reappraisal of its policy path. However, we believe that the Fed’s repricing is overdone while also suspecting that markets may be underestimating the hawkish appetites of the BoC, ECB, and BoE (as well as the BoJ).”
Danske still sees scope for net Euro losses; “We turned our EUR/USD forecast profile lower in May as we saw a structural shift in relative macro and monetary policy drivers. The moderation in energy prices is EUR-positive in isolation, but the fact that EUR/USD has still declined over the past month supports our view that the cross will be driven lower by more long-term factors.”
International Money Transfer? Ask our resident FX expert a money transfer question or try John’s new, free, no-obligation personal service! ,where he helps every step of the way,
ensuring you get the best exchange rates on your currency requirements.
TAGS: Euro Dollar Forecasts
TradingKey – As of the Asian session on July 6, WTI ( USOIL) crude oil prices extended last Friday’s rebound during intraday trading, peaking at $69.26 before consolidating around $68.60. From a technical perspective, oil prices have recovered after falling to a near four-month low, but the strength of the rebound remains limited. This is primarily due to the ongoing transit through the Strait of Hormuz and OPEC’s production increase measures.
From a fundamental perspective, WTI crude oil prices rebounded before paring gains today. The core reason is that while short-term prices rebounded due to previous oversold conditions and some Middle East uncertainties, the medium-term supply side is releasing more bearish signals.
First, the gradual recovery of transit through the Strait of Hormuz is a key factor suppressing the upward movement of oil prices. Previously, conflicts involving the U.S., Israel, and Iran briefly led to increased shipping risks in the Gulf, causing some tankers to reroute or delay transit through critical waterways, which drove up the oil price risk premium on fears of disrupted Middle East crude exports. However, the latest updates indicate that while some tankers still took unusual detours on Saturday, the main shipping lanes of the Strait of Hormuz had returned to near-normal by Sunday.
For WTI, the restoration of transit through the Strait of Hormuz directly eroded the geopolitical risk premium. Previously, oil prices were able to find some support at lower levels primarily due to market concerns over Middle East supply disruptions. Once the critical transport corridor recovered, traders shifted their focus back to actual supply and demand rather than continuing to bet on a war premium.
Second, the latest OPEC+ decision to increase output has further heightened oversupply concerns. OPEC+ has approved a production hike of 188,000 barrels per day for next month, driven mainly by Saudi Arabia and Russia.
In addition, the potential return of Iranian exports is putting further pressure on oil prices. The latest reports indicate that Iran has begun discussions with Japanese companies to resume crude oil sales under a temporary U.S. sanctions waiver framework. The waiver is valid for 60 days and will run until August 21. If Japanese buyers ultimately resume purchasing Iranian crude, it would mark a significant shift since 2019 and suggest that Iranian crude could reopen parts of the Asian market outside of China.
WTI crude oil daily chart, Source: TradingView
Looking at the daily chart of WTI crude oil, although today’s oil price continued last week’s rebound at the open and briefly surged above $69 during the session, it fell back to around $68 intraday. This indicates heavy upward pressure on market bulls, with market sentiment leaning more towards the bears. Meanwhile, the recent K-line movement of oil prices has remained below the 5-day Simple Moving Average (SMA5), further proving that market sentiment is tilted to the bearish side.
Currently, as oil prices have broken below the $70 psychological level and the Fibonacci 0.786 retracement level of $69.40, the downside space for oil prices has opened up further. The primary target will be to test the $60 psychological level on the downside. If oil prices fail to hold $60, they will fall further toward the Fibonacci 1.0 retracement level near $56.
On the upside, key resistance levels above to watch are $69.40-$70. Only if oil prices can establish a firm foothold above $70 will the upside space be opened, with the potential to test $73 on the upside, and further up, watch $78.
This content was translated using AI and reviewed for clarity. It is for informational purposes only.
The British Pound has strengthened against both the Euro and the US Dollar following signs that political uncertainty in the UK is easing, with EUR/GBP falling to around 0.8550 and GBP/USD holding above 1.3350.
JPMorgan has turned more constructive on Sterling, upgrading its 2026 forecasts following Andy Burnham’s reassuring commitment to the UK’s fiscal rules.
The bank is now bullish on the Pound against lower-yielding currencies and has trimmed its EUR/GBP forecasts.
JPMorgan now expects EUR/GBP at 0.87 in the third quarter, 0.88 in the fourth quarter, 0.89 in one year and 0.86 over the longer term.
According to the bank, Burnham’s communication around fiscal discipline has reduced political risk and should support Sterling over the coming months.
However, JPMorgan cautions that the current improvement may prove temporary.
As the Labour Party conference approaches in September, investors could begin rebuilding a political risk premium depending on the details of future fiscal policy.
The bank remains broadly constructive on Sterling, although it notes that the outlook for GBP/USD is mixed because it also depends on the direction of the US Dollar.
JPMorgan forecasts GBP/USD at 1.28 over the next quarter and 1.28 on a one-year view.

JPMorgan believes easing political uncertainty has improved the near-term outlook for the Pound, but fiscal policy announcements later this year will determine whether Sterling can extend its recent gains.
| USD | EUR | GBP | JPY | CAD | AUD | NZD | CHF | |
|---|---|---|---|---|---|---|---|---|
| USD | -0.28% | -1.18% | +0.33% | +0.21% | -0.61% | -0.79% | -0.41% | |
| EUR | +0.28% | -0.90% | +0.60% | +0.48% | -0.33% | -0.51% | -0.13% | |
| GBP | +1.19% | +0.91% | +1.52% | +1.40% | +0.57% | +0.39% | +0.78% | |
| JPY | -0.33% | -0.60% | -1.50% | -0.12% | -0.93% | -1.11% | -0.73% | |
| CAD | -0.21% | -0.48% | -1.38% | +0.12% | -0.81% | -0.99% | -0.61% | |
| AUD | +0.61% | +0.34% | -0.57% | +0.94% | +0.82% | -0.18% | +0.20% | |
| NZD | +0.79% | +0.51% | -0.39% | +1.12% | +1.00% | +0.18% | +0.38% | |
| CHF | +0.41% | +0.13% | -0.77% | +0.74% | +0.62% | -0.20% | -0.38% |
The FX heat map compares how Pound Sterling (GBP) has performed against a basket of major currencies over the past week. The largest move was against the Japanese Yen, where Pound Sterling made its strongest advance. Data comparing prices today (06/07/2026 15:23 UTC) and daily close on 29/06/2026.
To read the table, choose the base currency from the left-hand column and then move across to the quote currency along the top row. For example, the GBP row and USD column shows the weekly percentage move in GBP/USD.
(ETHUSD) declined slightly in its latest intraday trading, due to the stability of the resistance at $1,775, which was our last expected targets, with the beginning of negative overlapping signals’ emergence on the relative strength indicators after reaching overbought levels, and there is a possibility to form negative divergence.
On the other hand, the price is benefited from the continuation of the dynamic support that is represented by its trading above EMA50, with the dominance of the bullish corrective trend on the short-term basis, so we might witness some bearish corrective rebounds to look for a new rising low, that might provide bullish momentum to help the price breach this resistance.


