The main category of All News Articles.
You can use the search box below to find what you need.
[wd_asp id=1]
The main category of All News Articles.
You can use the search box below to find what you need.
[wd_asp id=1]
Gold price soared to a fresh all-time high on Tuesday, trading at $4,497 a troy ounce during European trading hours as market players kept dropping the US Dollar (USD). The bright metal also found favor in Middle East tensions, following weekend headlines indicating Israel is considering resuming its war with Iran.
The USD, however, found some near-term footing at the beginning of the American session after the release of mixed United States (US) data. The ADP Employment Change 4-week average showed that the private sector added an average of 11,500 jobs per week, in the week ending December 6, slightly below the previous 16,250 but still positive. Additionally, the Q3 Gross Domestic Product (GDP) reported annualized growth of 4.3% in the three months to September, well above the previous 3.8% and the expected 3.3%. On a negative note, the GDP Price Index, a measure of inflation, jumped from 2.1% to 3.7%.
The country also reported that Durable Goods Orders fell 2.2% in October, a worsening from the 0.7% advance posted in September. Finally, CB Consumer Confidence in December edged lower for the fifth consecutive month, declining to 89.1 from 92.9 in November.
Most countries celebrate Christmas, which means there won’t be any macroeconomic releases to worry about in the coming days. Japan is the only exception, releasing some interesting figures, including Tokyo Consumer Price Index (CPI) data, next Friday.
The XAU/USD fell towards the $4,450 region with the headlines, but resumed its advance after the dust settled, and trades around $4,480 at the time of writing.
Technically, the 4-hour chart shows XAU/USD trades at $4,474.84, holding on to modest intraday gains. The 20-, 100-, and 200-period Simple Moving Averages (SMAs) are bullish, with the price holding above all three, usually indicating that bulls maintain the lead. The 20 SMA near $4,398.04 offers nearby dynamic support. At the same time, the Momentum indicator eased but holds well above its midline, while the Relative Strength Index (RSI) indicator stands at 70. With the Momentum still positive and the RSI stretched, consolidation could precede another leg higher. A sustained push from current levels would extend the uptrend, while a pullback that holds above the cited SMAs would keep the bullish structure intact.
In the daily chart, XAU/USD trades far above an ascending 20-day SMA, with the latter developing above the 100- and 200-day SMAs. Price holds above all three, with the 20-day SMA at $4,267.83 providing nearby support and the 100-day SMA at $3,891.93 anchoring the trend. Finally, the Momentum indicator advances above its midline, while the RSI indicator at 80 barely decelerated its advance.
(The technical analysis of this story was written with the help of an AI tool)
– Written by
Tim Boyer
STORY LINK Pound-to-Dollar Forecast: GBP/USD Higher as Rate Outlooks Diverge
The Pound to Dollar exchange rate (GBP/USD) edged higher as a softer US currency offset lingering concerns over the UK growth outlook.
Markets are increasingly focused on Fed policy and political pressure for looser monetary conditions in the US.
Any further gains in GBP/USD are likely to depend on continued dollar losses rather than renewed confidence in the UK economy.
The Pound to Dollar (GBP/USD) exchange rate has secured net gains to around 1.3440 on Monday with pair within touching distance of 2-month highs just above 1.3450.
The Pound has secured a limited net gain in global markets while there was a generally soft dollar.
The main focus was a fresh surge in precious metals prices with gold and silver both surging to fresh record highs.
Get better rates and lower fees on your next international money transfer.
Compare TorFX with top UK banks in seconds and see how much you could save.
US equity markets held firm, although the FTSE 100 index posted a decline of just over 0.5%.
There is the risk of choppy trading in the very short term as trading volumes dip ahead of the Christmas holiday period.
Federal Reserve policy and personnel will remain a key element over the next few months.
At this stage, markets are pricing in close to a 20% chance of a further cut in January with a round a 50% chance of a cut by March.
Danske Bank commented; “We expect the Fed to pause in January and deliver two additional 25bp cuts in 2026, in March and June.”
The policy outlook is complicated by the fact that a new Fed Chair will be nominated while the Administration is continuing to lobby for faster and further rate cuts.
According to MUFG; “Whether Hassett, Waller, or Warsh is chosen, the likelihood is that the new Chair will be more aligned with Trump’s views and will push more forcefully for fundamental change at the Fed that will inevitably shape investor expectations that the Fed will align more toward policies to fuel growth over price stability rather than the current symmetric policy approach.

It added; “This would give momentum to the US yield curve steepening which tends to coincide with a weaker dollar.”
Markets will also be monitoring any developments surrounding the Supreme Court with two crucial cases surrounding the dismissal of Fed Governor Cook and Trump’s reciprocal tariffs.
Domestically, the final GDP data for the third quarter confirmed GDP growth of 0.1%, although there was a slight downward revision to 0.1% for the second quarter from the previous estimate of 0.2%.
The year-on-year growth rate was unchanged at 1.3% due to a small upward revision to 2024 data.
AJ Bell head of financial analysis Danni Hewson remains uneasy over the outlook; “With the Bank of England expecting growth to come to a standstill in the last few months of the year, thanks in part to the impact of the Budget on overall confidence, it’s clear there are huge challenges to overcome if the UK’s growth story is going to become more compelling.”
Elsewhere, the current account deficit was estimated at £12.1bn for the third quarter of 2025 from a revised £21.2bn the previous quarter.
Danske Bank is still concerned over balance of payments risks; “The UK runs a large current-account deficit, which makes GBP vulnerable when capital inflows fade.”
International Money Transfer? Ask our resident FX expert a money transfer question or try John’s new, free, no-obligation personal service! ,where he helps every step of the way,
ensuring you get the best exchange rates on your currency requirements.
TAGS: Pound Dollar Forecasts
Caroline Bishop
Dec 23, 2025 10:17
MATIC price prediction shows potential 18-53% upside to $0.45-$0.58 range if critical $0.58 resistance breaks, though immediate support at $0.35 remains crucial for bulls.
Polygon (MATIC) finds itself at a critical technical juncture as December 2025 draws to a close, trading near its 52-week lows with mixed signals emerging from key indicators. Our comprehensive MATIC price prediction analysis suggests a potential recovery phase may be brewing, contingent upon breaking through crucial resistance levels in the coming weeks.
• MATIC short-term target (1 week): $0.35-$0.42 range (+8% upside potential)
• Polygon medium-term forecast (1 month): $0.45-$0.58 range (+18-53% upside potential)
• Key level to break for bullish continuation: $0.58 resistance
• Critical support if bearish: $0.35, with ultimate support at $0.33
The latest analyst consensus reveals a cautiously optimistic outlook for Polygon’s price trajectory. Multiple forecasts from Blockchain.News over the past three days consistently point to a MATIC price target in the $0.35-$0.42 range for short-term trading, while medium-term projections suggest a more substantial recovery to $0.45-$0.58.
This Polygon forecast alignment among analysts indicates strong technical confluence around key resistance levels. The recurring mention of the $0.58 level as a critical breakout point suggests this price zone will determine whether MATIC can mount a meaningful recovery from its current oversold conditions. Notably, all recent predictions carry medium confidence levels, reflecting the uncertain market environment but acknowledging the technical setup for potential upside.
The analyst community appears divided between immediate caution and medium-term optimism, with most agreeing that breaking the $0.58 resistance could trigger a 53% rally from current levels.
Current Polygon technical analysis reveals a mixed but potentially improving picture. Trading at $0.38, MATIC sits just above the critical $0.35 support level that analysts have repeatedly identified as crucial for maintaining bullish structure. The token’s position within the Bollinger Bands at 0.29 suggests it’s trading in the lower portion of its recent range, often a precursor to mean reversion moves.
The RSI reading of 38.00 places MATIC in neutral territory with room to move higher before reaching overbought conditions. This positioning is particularly significant given the token’s proximity to its 52-week low of $0.37, suggesting limited downside risk relative to potential upside.
However, bearish momentum persists with the MACD histogram at -0.0045 and the price trading below all major moving averages except the 7-day SMA ($0.37). The 20-day SMA at $0.43 represents the first major hurdle, followed by the critical $0.58 resistance that has captured analyst attention.
Volume analysis from Binance spot trading shows $1.07 million in 24-hour volume, indicating moderate interest but lacking the conviction typically seen during major breakouts. This suggests any MATIC price prediction should account for potentially choppy price action until volume confirms directional moves.
The primary bullish scenario for our MATIC price prediction centers on breaking above the $0.42 immediate resistance, which would likely trigger momentum toward the critical $0.58 level. Successfully clearing this zone could unleash the 53% rally that analysts have identified, targeting the $0.58-$0.60 range initially.
Beyond $0.58, the next significant target sits at the 50-day SMA of $0.45, which would represent an 18% gain from current levels. A sustained break above this level could open the door to testing the upper Bollinger Band at $0.56 and potentially the $0.60 psychological resistance.
For this bullish Polygon forecast to materialize, MATIC needs to see increased buying volume and RSI momentum above 50. The stochastic indicators at %K 25.19 and %D 19.74 provide ample room for upward movement before reaching overbought territory.
The bearish scenario becomes active if MATIC fails to hold the $0.35 support level that analysts have consistently highlighted. A break below this zone would likely target the $0.33 strong support, representing a 13% decline from current levels and testing the 52-week low area.
Further deterioration could see MATIC challenge the lower Bollinger Band at $0.31, which would represent a significant breakdown from current technical structure. This scenario becomes more probable if the MACD histogram continues to trend lower and RSI breaks below 30 into oversold territory.
Key risk factors include broader cryptocurrency market weakness, reduced institutional interest in Layer 2 solutions, or failure to maintain developer activity on the Polygon network.
Based on current technical levels, the question of whether to buy or sell MATIC depends heavily on risk tolerance and investment timeframe. For aggressive traders, the current $0.38 level presents a compelling risk-reward opportunity with tight stop-losses below $0.35.
Conservative investors should wait for confirmation above $0.42 before establishing positions, as this would signal the beginning of the analyst-predicted recovery phase. This approach sacrifices some upside potential but significantly reduces the risk of catching a falling knife.
Position sizing should remain conservative given the medium confidence levels expressed by analysts. A scale-in approach works well in this environment, with initial positions at current levels and additional buying on any dip toward $0.35 support, provided that level holds on increased volume.
Stop-loss levels should be placed below $0.33 for most positions, as a break of this level would invalidate the bullish thesis and suggest further downside ahead.
Our MATIC price prediction suggests a 18-53% upside potential over the next 4-6 weeks, targeting the $0.45-$0.58 range that analyst forecasts consistently highlight. However, this Polygon forecast carries medium confidence given the current bearish momentum and requires confirmation above key resistance levels.
The critical factor for this prediction remains the $0.58 resistance level, which has emerged as the make-or-break point for MATIC’s recovery prospects. Traders should monitor this level closely, along with volume confirmation and RSI momentum above 50 for validation of the bullish scenario.
Timeline for this prediction centers on the next 4-6 weeks, with initial confirmation signals expected within 1-2 weeks if the recovery scenario begins to unfold. Failure to hold $0.35 support would invalidate this prediction and suggest further consolidation or decline ahead.
Image source: Shutterstock
Natural gas markets are ending the year in classic winter fashion: price swings driven less by what’s happening today than by what weather models might show next week.
On Tuesday, December 23, U.S. Henry Hub futures rebounded from recent weakness as record LNG export demand and a higher near-term consumption outlook helped offset a major bearish force—forecasts calling for warmer-than-normal temperatures into early January. [1]
Across the Atlantic, European benchmark prices moved the other direction. Dutch and British gas contracts slipped as traders digested weather forecasts pointing to a quicker end to a cold spell and weighed still-stable supply and LNG availability into January. [2]
Below is a complete, publication-ready rundown of the key news, forecasts, and market drivers shaping natural gas today.
U.S. (Henry Hub / NYMEX front month)
Europe (TTF / U.K. front month)
Asia (JKM as a global LNG marker)
The most important bullish headline in today’s U.S. market is straightforward: LNG export terminals are pulling record volumes of natural gas from the U.S. grid.
Reuters reporting cited:
In other words, even when domestic weather turns less supportive, export pull is creating a floor under demand—and traders are reacting.
Reuters also cited LSEG projections showing average demand across the Lower 48 (including exports) rising from about 127.9 Bcf/d this week to 136.0 Bcf/d over the next two weeks—an upward revision versus Monday’s outlook. [11]
That forecast shift matters because winter gas pricing is often determined at the margin: a few Bcf/d up or down can translate into sharp moves in futures when storage and weather risks are priced in.
Even with stronger LNG flows, the market is still fighting the same near-term problem: mild temperature outlooks reduce heating demand.
Reuters cited meteorologists calling for the U.S. to remain mostly warmer than normal through January 7, keeping heating-related consumption lower than typical for late December and early January. [12]
This push-pull—record exports vs. warm forecasts—is the core tension in natural gas today.
The other reason today’s rebound hasn’t turned into a runaway rally is supply.
Reuters cited LSEG estimates showing Lower 48 U.S. natural gas output at a record 111.1 Bcf/d in December, beating November’s record pace. [13]
High production changes the psychology of winter trading:
This is one reason the market can rally on demand revisions and export strength while still staying vulnerable to any fresh wave of “warmth-added” model runs.
One underappreciated catalyst in today’s Reuters reporting: U.S. policy news that could affect power generation.
Reuters cited that the Trump administration suspended leases for five large offshore wind projects under construction off the U.S. East Coast, citing national security concerns. The report added that reduced renewable generation expectations could mean greater reliance on natural gas-fired electricity. [14]
This is not an immediate “tomorrow morning” demand shock, but it’s a meaningful narrative tailwind for natural gas: when reliability concerns rise, gas often regains strategic importance in grid planning.
European gas pricing today is being pulled by weather expectations and the pace of winter storage drawdowns.
Reuters reporting (via LSEG data) showed:
On the fundamentals, Europe is not flashing the panic signals seen in past winters:
Bottom line: Europe’s market tone today looks more like managed winter balancing than crisis bidding—and that helps cap global LNG spillover into U.S. pricing.
Two LNG trade developments worth watching beyond day-to-day futures moves:
Reuters cited Kpler expectations that Myanmar will resume LNG imports next year, after a more than four-year hiatus (following partial cargo delivery last month). [20]
Myanmar won’t move global prices alone, but it’s a reminder that LNG demand growth increasingly comes from smaller, price-sensitive buyers—which can matter in tight winters and shoulder seasons.
Australia’s government has announced a new gas reservation approach beginning in 2027 that would require LNG exporters to set aside 15–25% of production for domestic use—designed to prevent shortages and reduce local price pressure. [21]
RBC analysis reported by The Australian described Santos-led GLNG as particularly exposed due to its supply profile and reliance on third-party gas versus peers. [22]
This is not an immediate December 2025 price mover—but in LNG, policy direction becomes today’s forward curve, influencing investment, contracting behavior, and long-term supply expectations.
With Christmas week liquidity and weather volatility, the next several sessions are likely to hinge on three catalysts:
1. www.bairdmaritime.com, 2. www.worldenergynews.com, 3. www.wsj.com, 4. www.bairdmaritime.com, 5. markets.businessinsider.com, 6. markets.ft.com, 7. www.worldenergynews.com, 8. www.investing.com, 9. www.bairdmaritime.com, 10. www.bairdmaritime.com, 11. www.bairdmaritime.com, 12. www.bairdmaritime.com, 13. www.bairdmaritime.com, 14. www.bairdmaritime.com, 15. www.worldenergynews.com, 16. www.worldenergynews.com, 17. www.worldenergynews.com, 18. www.worldenergynews.com, 19. www.worldenergynews.com, 20. www.bairdmaritime.com, 21. www.theaustralian.com.au, 22. www.theaustralian.com.au, 23. www.bairdmaritime.com, 24. www.bairdmaritime.com, 25. www.worldenergynews.com
If we can break above the 158 yen level, then it’s likely that the market will eventually break out to the 160 yen level. I do believe that happens given enough time, but the US dollar itself is giving back some of its strength during the day against multiple currencies, so I think this is more or less an indictment on the US dollar during the session than it is saying anything about the Japanese yen.

The 154.50 yen level is where we had seen quite a bit of support previously, and I think ultimately the fact that the 50-day EMA is approaching that level as well opens up the possibility of it being a short-term floor. We are heading into the holiday week, and therefore, I think it’s probably a market that’s going to be choppy and sideways more than anything else, but we’ll have to wait and see how that plays out.
I do think this is a situation where you are looking for value, and you are taking advantage of it because despite the fact that the Bank of Japan just raised rates and the Federal Reserve cut rates, you could still drive a truck through the interest rate differential between the two, and that spread pays you at the end of every day. This is what I’ve been taking advantage of since July, and I don’t plan on changing that anytime soon. So with that being said, I think this is just a little bit of give back from that massive move on Friday, but I wouldn’t read much more into it than that, being the case. I think it’s just a little bit of a pullback, a little bit of profit-taking as we are reaching a resistance barrier. I remain bullish.
Want to trade our USD/JPY forex analysis and predictions? Here’s a list of forex brokers in Japan to check out.
Christopher Lewis has been trading Forex and has over 20 years experience in financial markets. Chris has been a regular contributor to Daily Forex since the early days of the site. He writes about Forex for several online publications, including FX Empire, Investing.com, and his own site, aptly named The Trader Guy. Chris favours technical analysis methods to identify his trades and likes to trade equity indices and commodities as well as Forex. He favours a longer-term trading style, and his trades often last for days or weeks.
Nearly three-quarters of Americans take supplements to help fill nutrient gaps or support overall wellness. But some commonly used products may come with an unintended side effect: disrupted sleep. Here are three to keep in mind.
Some pre-workout supplements, as well as those marketed for weight loss or energy, contain caffeine, said Pieter A. Cohen, MD, an associate professor of medicine at Harvard Medical School and an Internal Medicine doctor at the Cambridge Health Alliance. As a result, they may interfere with sleep if taken too close to bedtime.
While some supplements list caffeine as an ingredient, many do not disclose the amount. Others may contain caffeine without clearly labeling it at all. “It’s often very difficult, if not impossible, for consumers to see how much caffeine is in a product by looking at the label,” Cohen told Health.
Vitamin B12 is essential for nerve function, red blood cell formation, and energy production. It may also play a role in regulating melatonin (the hormone involved in the sleep-wake cycle), which could help support sleep and daytime functioning for people with a deficiency, Grace Derocha, RDN, spokesperson for the Academy of Nutrition and Dietetics, told Health.
That said, vitamin B12’s relationship with sleep appears to be complex—with some evidence suggesting it may actually reduce your nightly shuteye. For example, one small study in healthy adults found that vitamin B12 influenced melatonin levels, and that one form—methylcobalamin—was associated with less sleep, though not with poorer sleep quality overall.
But whether the supplements actually disrupt sleep—and why they might do so—remains unclear. “Overall, the research is mixed,” Fariha Abbasi-Feinberg, MD, a member of the board of directors of the American Academy of Sleep Medicine, told Health. “Additional cross-sectional studies are needed to fully understand the relationship between sleep, circadian rhythm, and vitamin B12.”
While there isn’t strong evidence that multivitamins interfere with sleep, there are a couple reasons why they might. Many multivitamins contain vitamin B12, a nutrient linked to sleep disruption, and one study found that people who took multivitamins reported higher rates of insomnia and more nighttime awakenings than those who did not.
However, Abassi-Feinberg cautioned against making too much of those findings. “It’s important to remember that one study is not indicative of a definitive trend or causation,” she said. The study also had important limitations, including a relatively small sample size, a nonrandomized design, and reliance on self-reported sleep data.
Dogecoin (DOGE) is hammering on $0.13 support at the time of writing on Tuesday as overhead pressure continues to spread across the crypto market. The largest meme coin by market capitalization faces a deteriorating technical structure, weighed down by a weak derivatives market.
The Dogecoin derivatives market has remained significantly suppressed since the October 10 crash, which led to extensive deleveraging. According to Glassnode’s data, futures Open Interest (OI) across all exchanges stood at approximately $645,000 as of Monday, up slightly from roughly $640,000 the previous day but significantly below the $1.5 billion recorded on October 10.
Dogecoin’s OI hit a record high of approximately $3 billion on September 13, which emphasizes the significant decline in trader interest and confidence. The suppressed OI suggests that traders are unwilling to take on risk, a situation that continues to limit rebounds.
Dogecoin’s futures perpetual funding rate continues to fluctuate, depriving the meme coin of the tailwind it needs to sustain its recovery. According to Glassnode’s data, the funding rate is silent at zero as of Monday, down from 0.001% the previous day and 0.007% on Sunday.
A negative funding rate indicates that traders are piling into short positions, helping keep the price suppressed. A positive but low funding rate suggests that fewer traders are increasing exposure to the meme coin. On the other hand, a rising funding rate would support the bullish outlook and increase the odds of a steady uptrend.

Dogecoin is trading above $0.13 at the time of writing on Tuesday. The meme coin holds below the falling 50-day Exponential Moving Average (EMA) at $0.15, the 100-day EMA at $0.17 and the 200-day EMA at $0.19, all of which underscore a bearish setup.
The Relative Strength Index (RSI) stands at 41, below the midline on the daily chart, confirming restrained buying interest. If the RSI declines further toward oversold territory, the path with the least resistance would stay downward, increasing the odds of DOGE retesting support at $0.12.
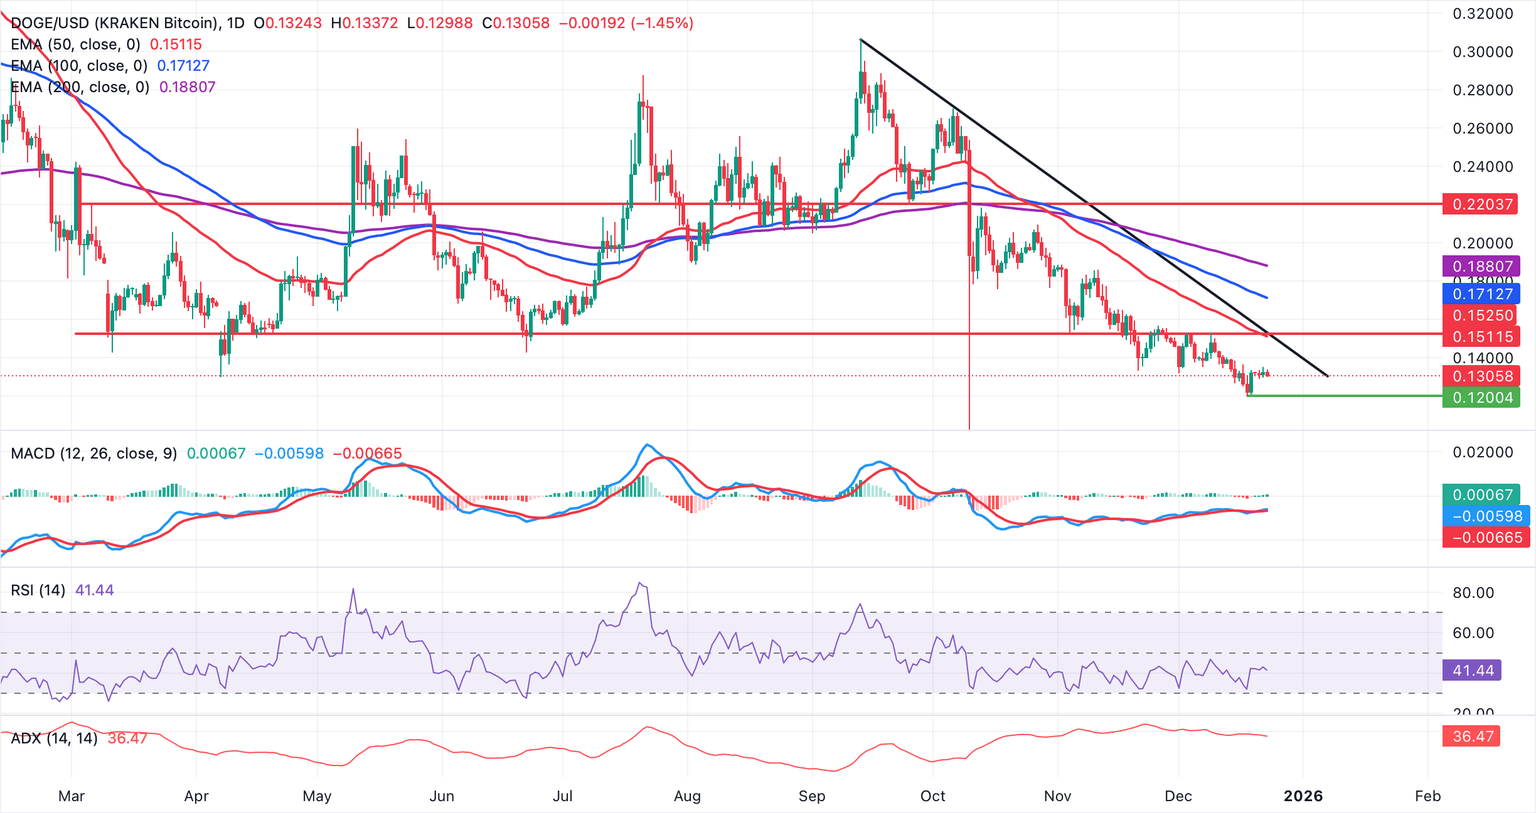
Still, a bullish crossover emerges as the Moving Average Convergence Divergence (MACD) line climbs above the signal line on the same chart. The green histogram bars have turned slightly positive above the mean line, suggesting improving momentum.
However, a sustained break above $0.15 resistance could open the way toward the 100-day EMA at $0.17. Failure to reclaim that barrier would keep bears in control beneath the 200-day EMA at $0.19. Meanwhile, the Average Directional Index (ADX) at 36 continues to fade, pointing to softer trend strength and a consolidative tone until a clear break.
(The technical analysis of this story was written with the help of an AI tool)
Recent news today in the crypto market shows new strength in NFTs and surging growth in real-world asset tokenization. These sectors have been written off in the downturn, but capital has begun to turn round as confidence returns. This pattern is familiar. Crypto bull phases rarely happen in a straight line. Capital rotates from the one story to the other as traders reposition.
Pepeto ($PEPETO) becomes relevant at this stage because meme utility historically follows these rotations. When capital completes an orbit of structured narratives, often the focus is moved to high-engagement sectors where asymmetric upside lies on the horizon.
Source: https://www.ainvest.com/news/nft-market-correction-strategic-inflection-point-investors-2512/
How Capital Usually Turns Around During Bull Phases
Every main cycle is run through by a loose progression. Bitcoin (https://coinmarketcap.com/currencies/bitcoin/) stabilizes first as confidence returns. Ethereum (https://coinmarketcap.com/currencies/ethereum/) follows as infrastructure activity picks up. Then narrative sectors emerge, this includes NFTs, gaming, and real-world asset tokenization. These areas are a boon to capital looking to gain thematic exposures.
Once these narratives get overcrowded, traders seek sectors that are a combination of attention and liquidity. This is where meme coins traditionally fit in. However, there is no pure hype in the next phase.
However, investors looking for the best crypto to buy now increasingly wish for meme exposure that entails utility and not hollow stories. This change provides the foundation for meme utility projects to provide the next wave in capital rotation.
Why Meme Utility is the Logical Next Sector
Meme coins survive on engagement. They are easy to understand, quick to trade, and culturally powerful. In previous cycles, this simplicity led to massive volume. The problem was sustainability.
The current environment is conducive to another model. Traders calculating the best crypto investment want projects that have the ability to capture one after another meme-driven volume. And that’s what utility provides. Meme utility is at the crossroads between engagement and infrastructure and is a natural next step after the capture of first flows by NFTs and RWAs (https://www.ainvest.com/news/rise-ethereum-powered-rwa-tokenization-implications-institutional-capital-allocation-2512/). This is where Pepeto enters with a structure designed specifically to monetize meme activity.
Pepeto’s Infrastructure Positions It for the Next Rotation
Pepeto (https://pepeto.io) operates on the Ethereum mainnet with a fixed supply of 420 trillion tokens. It is designed as an ecosystem where all swap, exchange, and trade volume routes through $PEPETO, turning activity into recurring token demand. PepetoSwap offers zero-fee swaps, encouraging high-frequency participation without friction. Pepeto Bridge expands access across chains while keeping liquidity unified.
Pepeto Exchange functions as a verified meme exchange, listing curated and audited projects rather than random launches. This is a direct response to discovery and trust problems that have been so prevalent in meme markets throughout history. Staking to provide further strengthening of the model. With staking APY hovering in the 216% range, holders are incentivized to lock their tokens, meaning the circulating supply of the tokens reduces the more activity increases.
Pepeto has completed audits by SolidProof and Coinsult, has raised more than $7.1M in presale funding, and is supported by a community exceeding 100,000 members. It presents itself as meme culture + real utility, sometimes referred to as “PEPE + Technology + Optimization.” This structure is why Pepeto is increasingly discussed as the best meme coin to buy and the best crypto presale to buy during early rotation phases.
How to Buy Pepeto Before Meme Utility Gains Attention
The Pepeto presale is live at https://pepeto.io. The current presale price is approximately $0.000000173 per $PEPETO token. Investors can enter by using a wallet via the official website and buy with ETH, USDT, BNB, or a bank card.
Early buyers are able to stake right away for the presale and earn high APY before launch. There is also a $700,000 giveaway in progress and on the official website as an incentive for those who participate early. Always make sure that you are using the official one, as there is a tendency of imitation sites to always come around the phase rotation.
Rotation Creates Opportunity Prior to Consensus Forming
Capital rotation does not verbally announce that it is. By the time the sector is obvious, much of the upside is already covered. This is why traders look for early signs and not confirmation.
For those looking for the best crypto to invest in, the next meme coin to blow up, or the next 100x meme coin opportunity, meme utility is an emerging phase and not a saturated phase. Pepeto fits this transition point, combining meme engagement with infrastructure that can sustain volume beyond a single trend.
As NFTs and RWAs consume attention, the next rotation convivially builds somewhere else. Pepeto offers exposure before meme utility becomes a dominant headline. Early positioning phase rotation has historically provided the strongest returns, and late May may just pick up the momentum minus multiples.
This pattern is the reason for not waiting for each sector to peak before reallocating according to experienced traders. They stand ahead of the shift, and not after it. Meme utility projects that already have infrastructure in place are better placed than reactive launches that come in once the trend is obvious.
Pepeto benefits from this timing advantage. It is already building use cases, community inertia, and token demand mechanisms-before meme utility becomes the dominant narrative. That early positioning is what makes the difference between rotation leaders and short-lived followers.
To stay ahead of key updates, listings, and announcements, follow Pepeto on its official channels only:
Website: https://pepeto.io
X (Twitter): https://x.com/Pepetocoin
Telegram: https://t.me/pepeto_channel
Instagram: https://www.instagram.com/pepetocoin/
Contact: Dani Bonocci
Website: https://www.tokenwire.io
Phone: +971586738991
SOURCE: Pepeto
Press release distribution
This release was published on openPR.
HP Inc. (HPQ) declined in its latest intraday trading, under continued negative pressure as it trades below its 50-day SMA, reinforcing the stability and dominance of the main downward trend on the medium term, especially with its movement along a downward-sloping trend line. In addition, negative signals continue to emerge from momentum indicators, despite their arrival at extremely oversold levels.
Therefore we expect the stock price to decline in its upcoming trading, as long as it remains below the key resistance level at $25.95, targeting the pivotal support level at $22.25.
Today’s price forecast: Bearish
The EUR/USD began the penultimate trading week of 2025 on a positive note, rebounding toward the 1.1769 resistance level. Bulls are attempting to return to the 1.1800 psychological resistance area, a level critical for preparing for stronger upward breakouts. According to reliable trading platforms, the Euro is currently capitalising on the market’s primary focus on Federal Reserve expectations rather than Eurozone policy.
Expectations for further monetary easing by the Fed in 2026 continue to weigh on the US Dollar, even as the European Central Bank (ECB) signals no urgent need for interest rate adjustments. Risks remain tied to US economic growth, inflation, and political pressure on the Federal Reserve.
Currently, technical indicators confirm a shift in the EUR/USD trend, with the 14-day Relative Strength Index (RSI) hovering around 65, close to the overbought level, and the MACD indicator also trending upwards. The strong buying pressure from technical indicators is prompting bulls to push quickly towards the psychological resistance level of 1.2000. Today’s EUR/USD trading will be influenced by the release of US economic growth figures and durable goods orders data, both at 3:30 PM Egypt time, followed by the US consumer confidence index from Michigan at 5:00 PM Egypt time.
Traders are advised to wait for market and investor reactions to the important US economic announcements, as this reaction will determine the direction of currency prices for the remainder of 2025 trading. Therefore, it is not recommended to keep positions open during the holiday season.
In this context, Nordea Bank expects the EUR/USD exchange rate to rise to 1.24 by the end of 2026. HSBC expects EUR/USD to rise to 1.20 at the beginning of 2026 before retreating to 1.18 by the end of the same year.
Similarly, Société Générale commented on the short-term outlook for the EUR/USD pair, stating: “A slight pullback is currently forming; maintaining the 50-day moving average near 1.1610 will be crucial for the continuation of the upward trend. If the pair breaks above the 1.1800/1.1830 resistance levels, it is likely to experience further upward movement. The next targets could be the September high of 1.1920 and the psychological resistance at 1.2000.”
In this regard, the European Central Bank made no changes to interest rates at its latest meeting, keeping the deposit rate at 2.00%. Eurozone growth expectations have seen a slight improvement, while inflation is expected to remain around 2.00% over the medium term. ECB President Lagarde stated that there is no pre-determined path for interest rates.
In this regard, MUFG Bank commented on the European Central Bank’s policies, stating: “We have scrapped our forecast of a final 25 basis point interest rate cut by the ECB in 2026. However, it is still too early for the Eurozone interest rate market to expect an early rate hike next year, given that inflation is still expected to remain below the ECB’s target.” They added: “With the Bank of England and the Federal Reserve still expected to cut interest rates further next year, we anticipate continued strength in the euro in 2026, while the ECB maintains its current monetary policy stance.”
As for the United States, financial markets continue to expect further US interest rate cuts by the Federal Reserve in 2026 following the decline in inflation. The unemployment rate has reached a four-year high of 4.6%, while US jobs data overall has been mixed.
According to Nordea Bank; We expect the US dollar to weaken by 2026, as growth differentials and political uncertainty turn against it. We are particularly concerned about the Trump administration’s focus on influencing the Federal Reserve. Rabobank also commented: “We expect the US economy to enter a cyclical recession next year. While many G10 central banks have completed their interest rate-cutting cycles, the Fed is likely to continue its monetary easing until 2026.”
The bank added in its outlook: “Additional risks to the US dollar include a new round of tariffs, persistently high inflation coupled with negative real interest rates, or a sharp correction in AI-related stocks.”
Ready to trade our daily Forex forecast? Here’s a list of some of the best regulated forex brokers to check out.


")
:max_bytes(150000):strip_icc()/Health-GettyImages-1450382928-43d2039c8e944611873fb584d9caec0e.jpg "3 Common Supplements That Could Be Ruining Your Sleep")


")