The main category of All News Articles.
You can use the search box below to find what you need.
[wd_asp id=1]
The main category of All News Articles.
You can use the search box below to find what you need.
[wd_asp id=1]
The Bank of England will deliver its first monetary policy decision of 2026 at midday today. Expectations are that the central bank will leave interest rates unchanged at 3.75% after cutting rates by 25 basis points at the December meeting.
The December rate count was a narrow vote of five to four. Highlighting how finely balanced the debate about further rate cuts has become. The message from policymakers was still cautiously dovish, with a gradual downward path for rates, meaning that further cuts would be harder to justify as policy moves closer to neutral.
Growth momentum is showing signs of fading, with the economy expected to flatline in Q4. The central bank expects inflation to return to the 2% target by spring, despite rising to 3.4% in January.
There are signs, however, that the labour market is cooling, with the 5.1% percent. data from yesterday showed that the employment subcomponent fell sharply in January, continuing a trend that began in October 2024, marking the longest period of job shedding in the UK service sector in 16 years.
Further weakening in the jobs market would put downward pressure on wage growth and pull service sector inflation lower. Wage growth and service-sector inflation are currently too high for the Bank of England to be comfortable with further rate cuts, or to be consistent with inflation back at 2%.
The focus will be on the vote split, which is expected to be 7-2. A more dovish vote could put pressure on the pound. Bank of England Governor Andrew Bailey’s comments will be in focus, and dovish commentary would be pound-negative.
Meanwhile, the is rising as it nears a 2-week high amid market pricing in a slower pace and potential Federal Reserve rate cuts.
Federal Reserve governor Lisa Cook emphasised concerns over sticky inflation rather than the cooling labour market, suggesting that she was not supporting a rate cut until there are further signs of inflation easing.
Data yesterday showed the remained at 53.8 in January, aligning with the previous month’s figure and exceeding expectations from a client of 53.5. However, prices paid also increased to 66.6 from 65.1, signalling rising inflationary pressures. Attention will now turn to U.S. initial jobless claims, which are expected to rise modestly to 212K, up from 209 K.
trended higher from 1.30 before running into resistance at 1.3870. GBP/USD rebounded lower from here and is testing support at the 1.36 zone, the round number, horizontal and trendline support.
A break below here exposes the 200 SMA at 1.3420. A break below 1.3350 creates a lower low, bringing 1.32 into focus.
Should the support hold, buyers will look to rise above 1.37. A rise above here brings 1.3870 back into play.
has fallen back to 1.18 ahead of the ECB rare decision at 13:15 GMT where the central bank is widely expected to leave interest rates unchanged at 2% (deposit rate). The ECB last cut rates in June last year. However, inflation hovering around the 2% target led policymakers to consider monetary policy to be in a good place.
However, this meeting comes after data yesterday showed cooled by more than expected to 1.7% YoY in January, down from 1.9% in December and further from the ECB’s 2% target, reopening the debate over whether the ECB will cut again this year.
A stronger EUR, – EUR/USD rose to a 4-year high above 1.20 in late January, and cheap Chinese exports, which have flooded the eurozone, exert deflationary pressure and, if this persists, could amplify dovish calls within the ECB.
Given that no rate cut is expected, the focus will be on the tone of President Lagarde’s press conference as the near-term catalyst for the EUR.
A stronger USD and a slightly more dovish ECB could pull EUR/USD back towards 1.17.
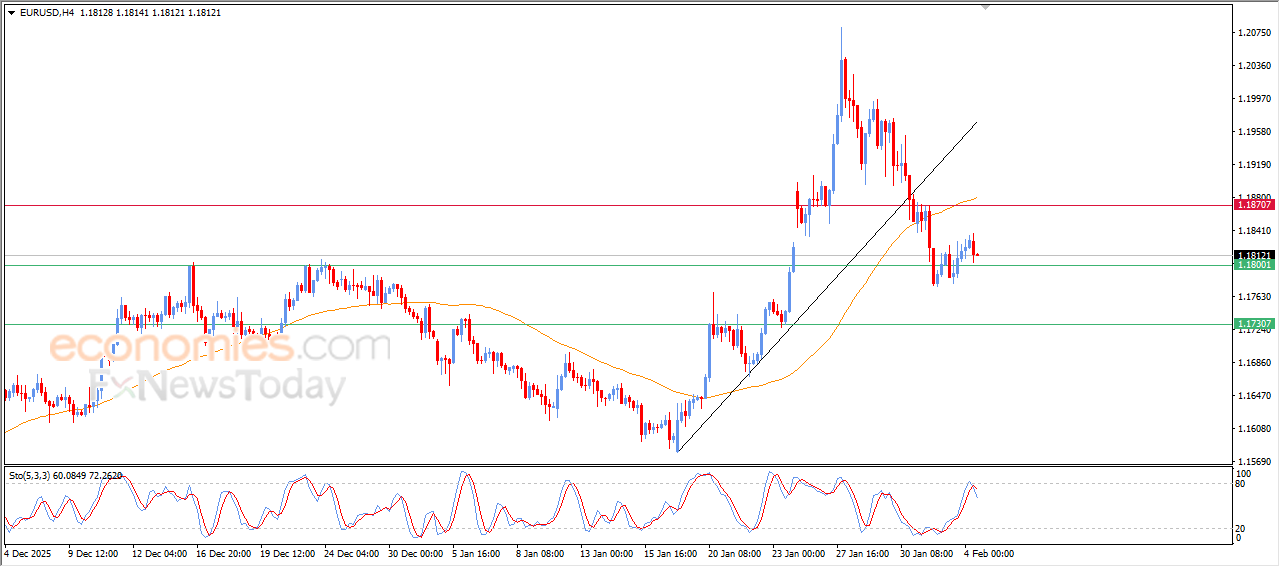
After recovering from the 200 SMA support and rising to a 4-year high of 1.2085, EUR/USD has fallen back and is testing the 1.18 support, the round number, the December high and the falling trendline support. The RSI is close to neutral.
Should buyers successfully defend this support, upside resistance is at 1.1870, with a rise above here bringing 1.20, the psychological level and 1.2085 back into focus.
Should sellers remove the 1.18 support, this would expose the 50 SMA and the 1.17 level. Below here, the 200 SMA at 1.16 comes into play, along with the 2026 low.
Silver price (XAG/USD) plunged over 10% after two days of gains, trading around $77.00 per troy ounce during the Asian hours on Thursday. Silver prices fall as precious metals face renewed selling pressure and increased volatility.
Dollar-denominated precious metals, including Silver lose ground amid a stronger US Dollar (USD), fueled by hawkish signals from the Federal Reserve (Fed) and expectations of a slower pace of US rate cuts.
Fed Governor Lisa Cook said she would not back another cut without clearer evidence that inflation is easing, stressing greater concern over stalled disinflation than labor market weakness.
Investors also weighed the implications of Kevin Warsh’s nomination as Fed chair, citing his preference for a smaller balance sheet and a less aggressive approach to rate reductions. Meanwhile, US President Donald Trump said he would not have nominated Warsh if he favored rate hikes. Trump further stated that there was “not much” doubt the US central bank would lower rates because “we’re way high in interest,” but now “we’re a rich country again.”
The safe-haven demand for Silver fades amid geopolitical tensions, which eased after the US and Iran are set to hold a new round of talks on Friday, though the agenda remains unclear. Tehran aims to limit discussions to its nuclear program, while Washington wants to include ballistic missiles, regional militant support, and human rights concerns.
Silver is a precious metal highly traded among investors. It has been historically used as a store of value and a medium of exchange. Although less popular than Gold, traders may turn to Silver to diversify their investment portfolio, for its intrinsic value or as a potential hedge during high-inflation periods. Investors can buy physical Silver, in coins or in bars, or trade it through vehicles such as Exchange Traded Funds, which track its price on international markets.
Silver prices can move due to a wide range of factors. Geopolitical instability or fears of a deep recession can make Silver price escalate due to its safe-haven status, although to a lesser extent than Gold’s. As a yieldless asset, Silver tends to rise with lower interest rates. Its moves also depend on how the US Dollar (USD) behaves as the asset is priced in dollars (XAG/USD). A strong Dollar tends to keep the price of Silver at bay, whereas a weaker Dollar is likely to propel prices up. Other factors such as investment demand, mining supply – Silver is much more abundant than Gold – and recycling rates can also affect prices.
Silver is widely used in industry, particularly in sectors such as electronics or solar energy, as it has one of the highest electric conductivity of all metals – more than Copper and Gold. A surge in demand can increase prices, while a decline tends to lower them. Dynamics in the US, Chinese and Indian economies can also contribute to price swings: for the US and particularly China, their big industrial sectors use Silver in various processes; in India, consumers’ demand for the precious metal for jewellery also plays a key role in setting prices.
Silver prices tend to follow Gold’s moves. When Gold prices rise, Silver typically follows suit, as their status as safe-haven assets is similar. The Gold/Silver ratio, which shows the number of ounces of Silver needed to equal the value of one ounce of Gold, may help to determine the relative valuation between both metals. Some investors may consider a high ratio as an indicator that Silver is undervalued, or Gold is overvalued. On the contrary, a low ratio might suggest that Gold is undervalued relative to Silver.
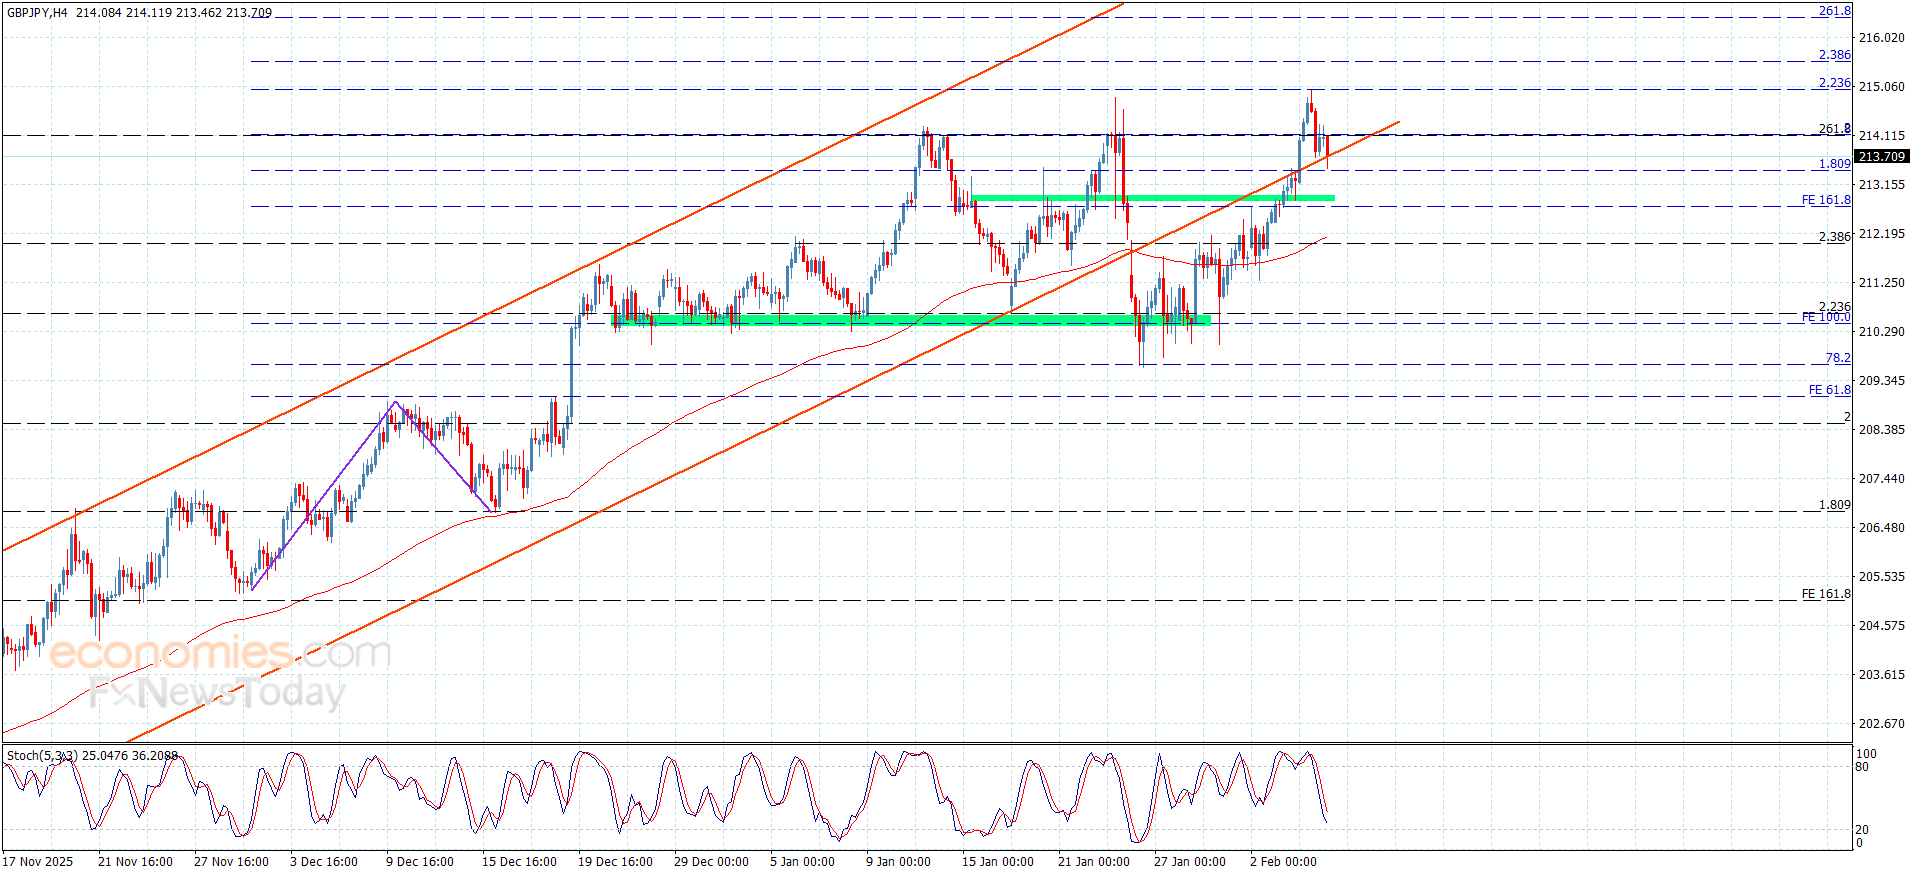
The GBPJPY pair ended its bullish rally by reaching 214.90, forming a strong barrier against the bullish attempts, which pushes it to activate the bearish corrective track, to reach 213.5 attempting to press on the bullish channel’s support that appears in the above image.
Note that stochastic decline below 50 level, and attempt to form extra barrier at 214.15 level, these factors makes us wait for breaking the current support, to reinforce the chances to begin gathering gains, to expect targeting 212.90 level initially, where breaking this barrier might extend the trading towards 212.45 and 212.00, while holding above 214.15 will confirm the continuation of the bullish scenario, waiting to reach 215.00.
The expected trading range for today is between 212.90 and 214.00
Trend forecast: Bearish
Coffee price succeeded in activating the previously suggested negative trend by reaching below 334.20 support, forming a strong decline, achieving the initial target by reaching 314.85 level.
Note that stochastic stability within the oversold level will increase the negative pressure in the current period, to form new bearish waves to reach 308.00, to press on 300.50 support to find an exit for resuming the negative trading in the upcoming period.
The expected trading range for today is between 300.50 and 325.00
Trend forecast: Bearish
The Euro has risen against the Japanese Yen during the trading session here on Wednesday as the interest rate differential continues to be a main driver of things. The ECB meets on Thursday, so be aware that volatility is almost certain to happen.
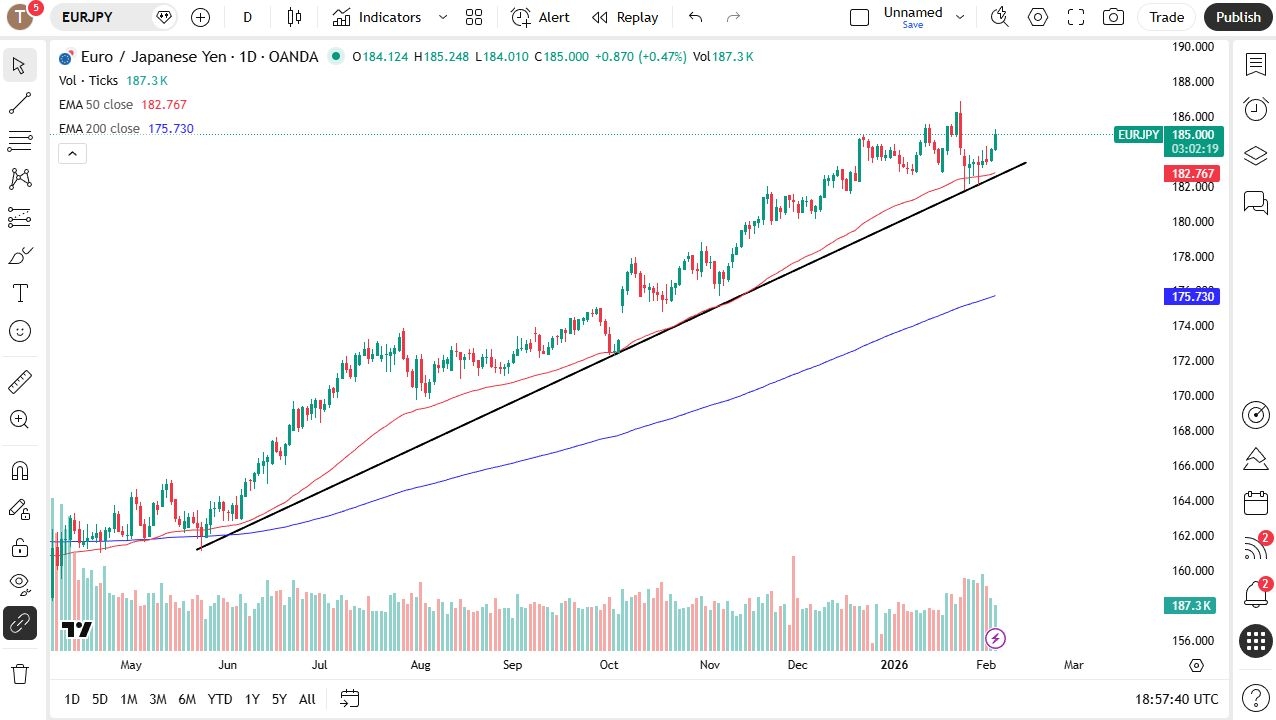
The Euro has risen against the Japanese Yen during the trading session here on Wednesday as we continue to just see a nice uptrend in a market that quite frankly has been a buy on the dip opportunity every time it falls. We are sitting above the 50-day EMA and of course the uptrend line.
We are hanging around the 185 Yen level and that of course is a large round psychologically significant figure that attracts a lot of attention. If we do pull back from here, I think that opens up the possibility of buyers getting involved on value.
Keep in mind one problem we have is that the Thursday session has the ECB interest rate decision and that will come into the picture and cause a little bit of noise from everything I can see. With this being the case though, I think unless the ECB sounds suddenly very dovish, which I don’t think they will, you have a scenario where the interest rate differential will continue to favor the upside as the Bank of Japan really can’t do anything.
I suspect at this point we will eventually go looking toward the 190 Yen level, but that might take some time to get to. If we were to break down below the uptrend line and ostensibly the 50-day EMA, then I look for support at the 182 Yen level, possibly even down to the 180 Yen level. I have no interest in shorting this pair. I do not pay the swap and of course the trend is very well established here.
Begin trading our daily forecasts and analysis. Here is a list of Forex brokers in Japan to work with.
Christopher Lewis has been trading Forex and has over 20 years experience in financial markets. Chris has been a regular contributor to Daily Forex since the early days of the site. He writes about Forex for several online publications, including FX Empire, Investing.com, and his own site, aptly named The Trader Guy. Chris favours technical analysis methods to identify his trades and likes to trade equity indices and commodities as well as Forex. He favours a longer-term trading style, and his trades often last for days or weeks.
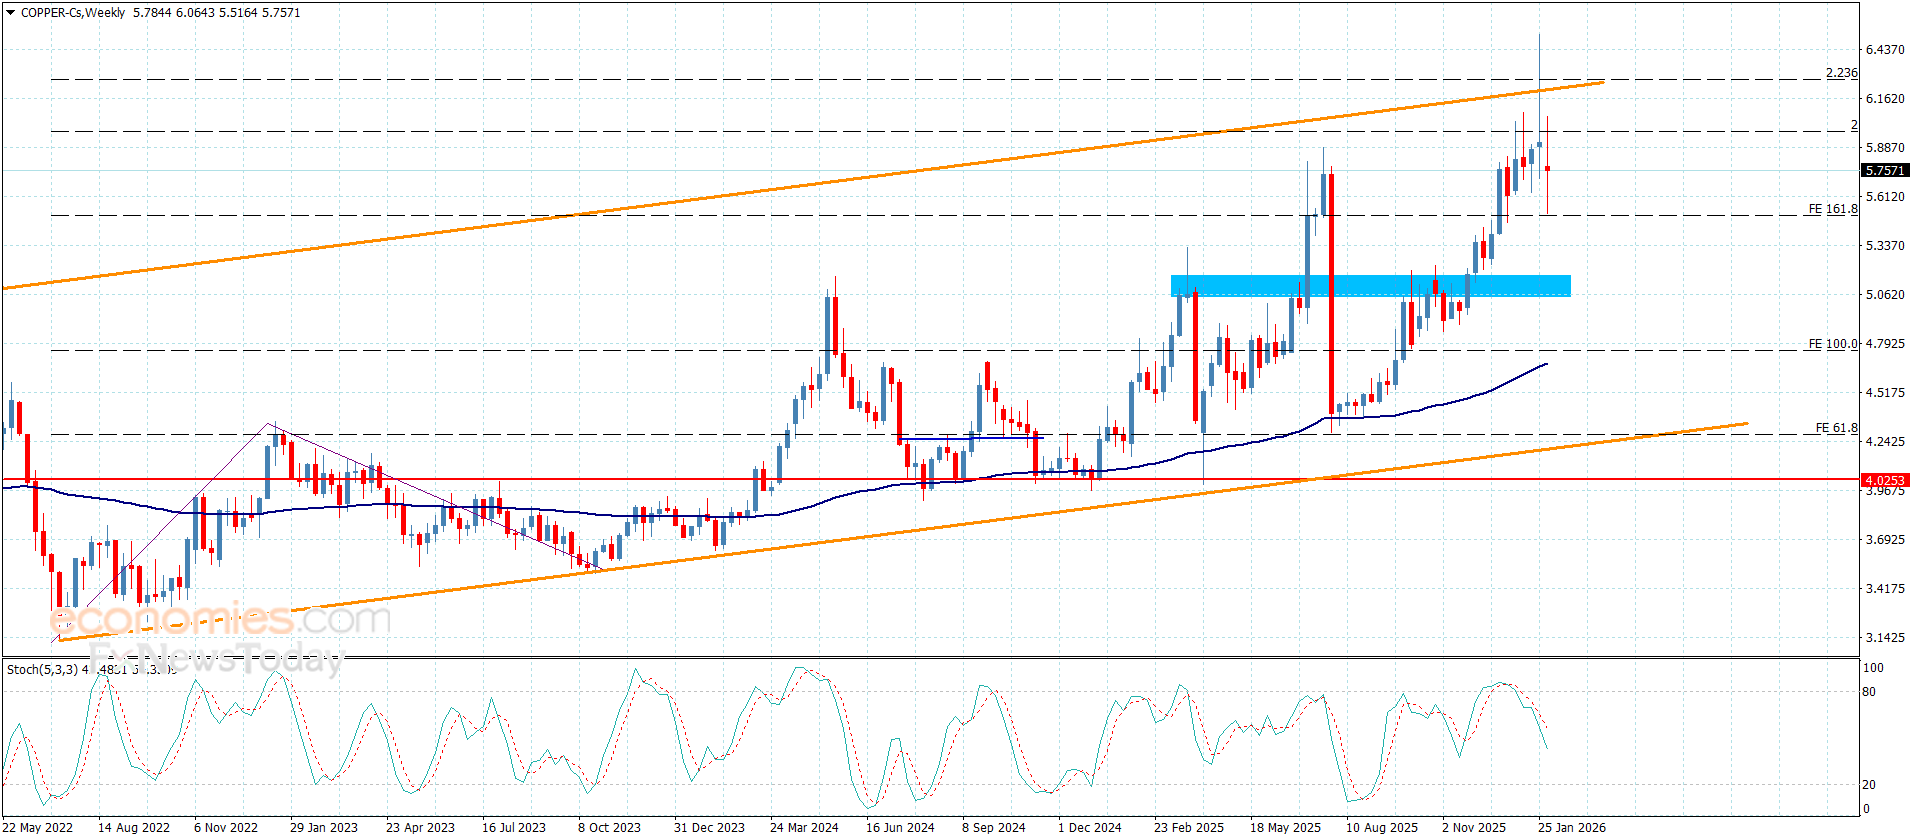
Copper price announced delaying the bullish trend by providing new negative closure below $5.9700 level, affected by stochastic negativity, forming some bearish corrective waves to settle near $5.7500.
The continuation of suffering negative pressures will increase the efficiency of the bearish corrective track in the near period, which makes us prefer targeting $5.6200 level, repeating the pressure on the extra support at $5.5100, forming confirmation key for the trend of the medium trading.
The expected trading range for today is between $5.6200 and $5.9200
Trend forecast: Bullish
The GBP/USD pair attracts follow-through sellers for the second straight day on Thursday and retreats further from its highest level since September 2021, around the 1.3870 region, touched last week. The downward trajectory is sponsored by a firmer US Dollar (USD) and drags spot prices to the 1.3600 neighborhood or a nearly two-week low during the early European session as traders await the Bank of England (BoE) policy update.
The UK central bank is widely expected to leave the benchmark interest rates unchanged at 3.75% amid a rise in inflation, which remained above the BoE’s 2% target in December. Traders, however, are still pricing in the possibility that the BoE will lower borrowing costs in 2026 amid signs of a weakening labor market. In fact, the UK Unemployment rate remained at a four-year high of 5.1% in the three months to November, and the number of employed people fell by 43,000 in December. Adding to this, slowing wage growth strengthens the case for further BoE easing. Hence, the focus will remain glued to the MPC vote split and the post-meeting press conference, where comments from BoE Governor Andrew Bailey will influence the British Pound (GBP) and provide some meaningful impetus to the GBP/USD pair.
Heading into the key central bank event risk, the GBP bulls opt to remain on the sidelines amid an extension of the recent USD recovery from a four-year low. US President Donald Trump’s nomination of Kevin Warsh as the next Federal Reserve (Fed) chair fueled speculations that the central bank will be less dovish than expected. Furthermore, heightened market volatility and Fed Governor Lisa Cook’s hawkish comments, saying that risks are skewed toward higher inflation, lift the safe-haven Greenback to a nearly two-week high, which continues to exert some downward pressure on the GBP/USD pair. Any meaningful USD upside, however, seems elusive on the back of expectations of two more interest rate cuts by the US central bank in 2026. The bets were reaffirmed by Wednesday’s dismal labor market report.
In fact, the Automatic Data Processing (ADP) Research Institute reported that private-sector employers added 22K new jobs in January compared to the previous month’s downwardly revised reading of 37K and 48K consensus estimates. Adding to this, Trump said that he would have passed on Kevin Warsh’s nomination if he had expressed a desire to hike rates and that there was not much doubt that the US central bank would lower interest rates. This, in turn, could cap the USD gains and act as a tailwind for the GBP/USD pair. Traders on Thursday will further take cues from the US economic docket – featuring JOLTS Job Openings and Weekly Initial Jobless Claims. Nevertheless, the mixed fundamental backdrop warrants some caution before placing aggressive bets and positioning for the next leg of a directional move.
The GBP/USD pair finds some support near the 1.3600 mark, representing the 50% Fibonacci retracement level of the upswing from the January swing low, which should now act as a key pivotal point for traders. Meanwhile, the recent breakdown below the 100-hour Simple Moving Average (SMA) favors bears.
The Moving Average Convergence Divergence (MACD) remains below the zero line with the MACD line under the Signal line and a contracting histogram, suggesting weak bearish momentum. The Relative Strength Index (RSI) sits near 32 (oversold threshold), hinting that downside pressure is stretched.
Meanwhile, the 61.8% Fibo. retracement at 1.3548 underpins the downside, and a break would warn of a deeper deterioration. Absent such a breach, stabilization above mid-range support could allow an oversold bounce, though the declining 100-period SMA would keep recovery attempts fragile.
(The technical analysis of this story was written with the help of an AI tool.)
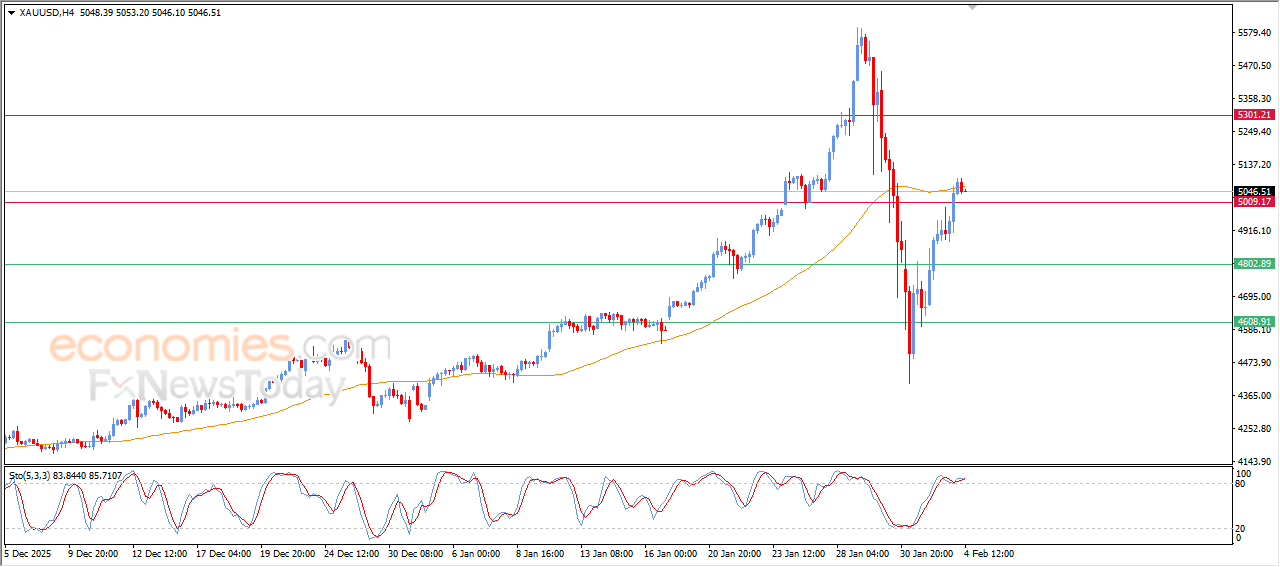
Gold is experiencing some volatility in Thursday’s Asian trading, moving back and forth in a roughly $200 range. Traders now look forward to the US JOLTS Job Openings data and geopolitical developments between the US and Iran for a clear directional impetus.
Gold settled flat near $4,950 on Wednesday after witnessing two-way business. Initially, the traditional safe haven rebounded firmly to test the $5,100 level on uncertainty over the US Federal Reserve’s (Fed) potential monetary policy outlook under Kevin Warsh. The Fed concerns undermined the US Dollar (USD) across the board.
Meanwhile, rekindled geopolitical tensions in the Middle East and between Russia and Ukraine also provided a much-needed relief to Gold buyers, alongside increased concerns over the economic data disruption caused by the US partial government shutdown that ended on Tuesday.
However, the tide turned against the USD in the American session on Wednesday, following the release of the US ISM Services PMI data, which showed signs of a pick-up in inflation. Further, the tech sell-off on Wall Street gathered steam and spooked markets, as investors ran to the world’s reserve currency, the Greenback, for some solace.
The sell-off in the Japanese Yen (JPY)due to increased fiscal and political concerns boosted the USD/JPY pair, in turn, lifting the USD.
This reversal in the USD, fuelled a sharp pullback in Gold, but dip buyers once again jumped in near the $4,950 psychological level.
In Thursday’s trading so far, Gold is back in the red, having faced rejection again above the $5,000 key resistance. The USD extends its upbeat momentum, clinching fresh two-week highs against its six major currency rivals, as market mood worsens amid a global tech sell-off.
A meltdown in global providers of data analytics, professional services and software followed Anthropic’s launch of plug-ins for its Claude Cowork agent on Friday, which raised concerns about AI-fuelled disruption to those industries, per Reuters.
Looking ahead, the delayed US JOLT Job Openings Survey could help Gold buyers cut their losses, especially if the data doubles down on two Fed rate expectations for this year.
However, if the JPY extends its downward spiral against the USD, Gold could see another bout of intense selling.
The 21-, 50-, 100- and 200-day Simple Moving Averages (SMA) all rise, with the 21-day above the longer ones, underscoring a firm bullish structure. Price holds above these gauges, keeping buyers in control. The 21-day SMA at $4,827.45 offers nearby support, while the 50-day sits at $4,532.68. The Relative Strength Index (14) stands at 52.58, neutral after easing from prior extremes, indicating momentum is consolidating.
The upward alignment of the SMAs supports a buy-on-dips stance while the price holds above the short-term average. A deeper pullback would bring the 100-day SMA at $4,271.21 into view, with the 200-day at $3,821.77 underpinning the broader trend. RSI holding above the 50 midline would keep the bullish bias intact, whereas a drop back below it could open room for a broader retracement.
(The technical analysis of this story was written with the help of an AI tool.)
JOLTS Job Openings is a survey done by the US Bureau of Labor Statistics to help measure job vacancies. It collects data from employers including retailers, manufacturers and different offices each month.
Important DisclaimersFXEmpire is owned and operated by Empire Media Network LTD., Company Registration Number 514641786, registered at 7 Jabotinsky Road, Ramat Gan 5252007, Israel. The content provided on this website includes general news and publications, our personal analysis and opinions, and materials provided by third parties. This content is intended for educational and research purposes only. It does not constitute, and should not be interpreted as, a recommendation or advice to take any action, including making any investment or purchasing any product. Before making any financial decision, you should conduct your own due diligence, exercise your own discretion, and consult with competent advisors. The content on this website is not personally directed to you, and we do not take into account your individual financial situation or needs. The information contained on this website is not necessarily provided in real time, nor is it guaranteed to be accurate. Prices displayed may be provided by market makers and not by exchanges. Any trading or other financial decision you make is entirely your own responsibility, and you must not rely solely on any information provided through the website. FXEmpire does not provide any warranty regarding the accuracy, completeness, or reliability of any information contained on the website and shall bear no responsibility for any trading losses you may incur as a result of using such information. The website may include advertisements and other promotional content. FXEmpire may receive compensation from third parties in connection with such content. FXEmpire does not endorse, recommend, or assume responsibility for the use of any third-party services or websites. Empire Media Network LTD., its employees, officers, subsidiaries, and affiliates shall not be liable for any loss or damage resulting from your use of the website or reliance on the information provided herein.Risk DisclaimersThis website contains information about cryptocurrencies, contracts for difference (CFDs), and other financial instruments, as well as about brokers, exchanges, and other entities trading in such instruments. Both cryptocurrencies and CFDs are complex instruments and involve a high risk of losing money. You should carefully consider whether you understand how these instruments work and whether you can afford to take the high risk of losing your money. FX Empire encourages you to conduct your own research before making any investment decision and to avoid investing in any financial instrument unless you fully understand how it works and the risks involved.
The EURJPY pair succeeded in surpassing the barrier at 184.00, to settle above it to ease the mission of resuming the bullish trend, to settle near the initial bullish target at 184.85 level.
The main stability within the bullish channel’s levels beside providing bullish momentum by the main indicators will increase the chances of recording extra gains, to wait for reaching 185.45 and surpassing it might push it to press on 186.20 barrier, to form the next main target in the current trading.
The expected trading range for today is between 184.30 and 185.45
Trend forecast: Bullish