The main category of All News Articles.
You can use the search box below to find what you need.
[wd_asp id=1]
The main category of All News Articles.
You can use the search box below to find what you need.
[wd_asp id=1]
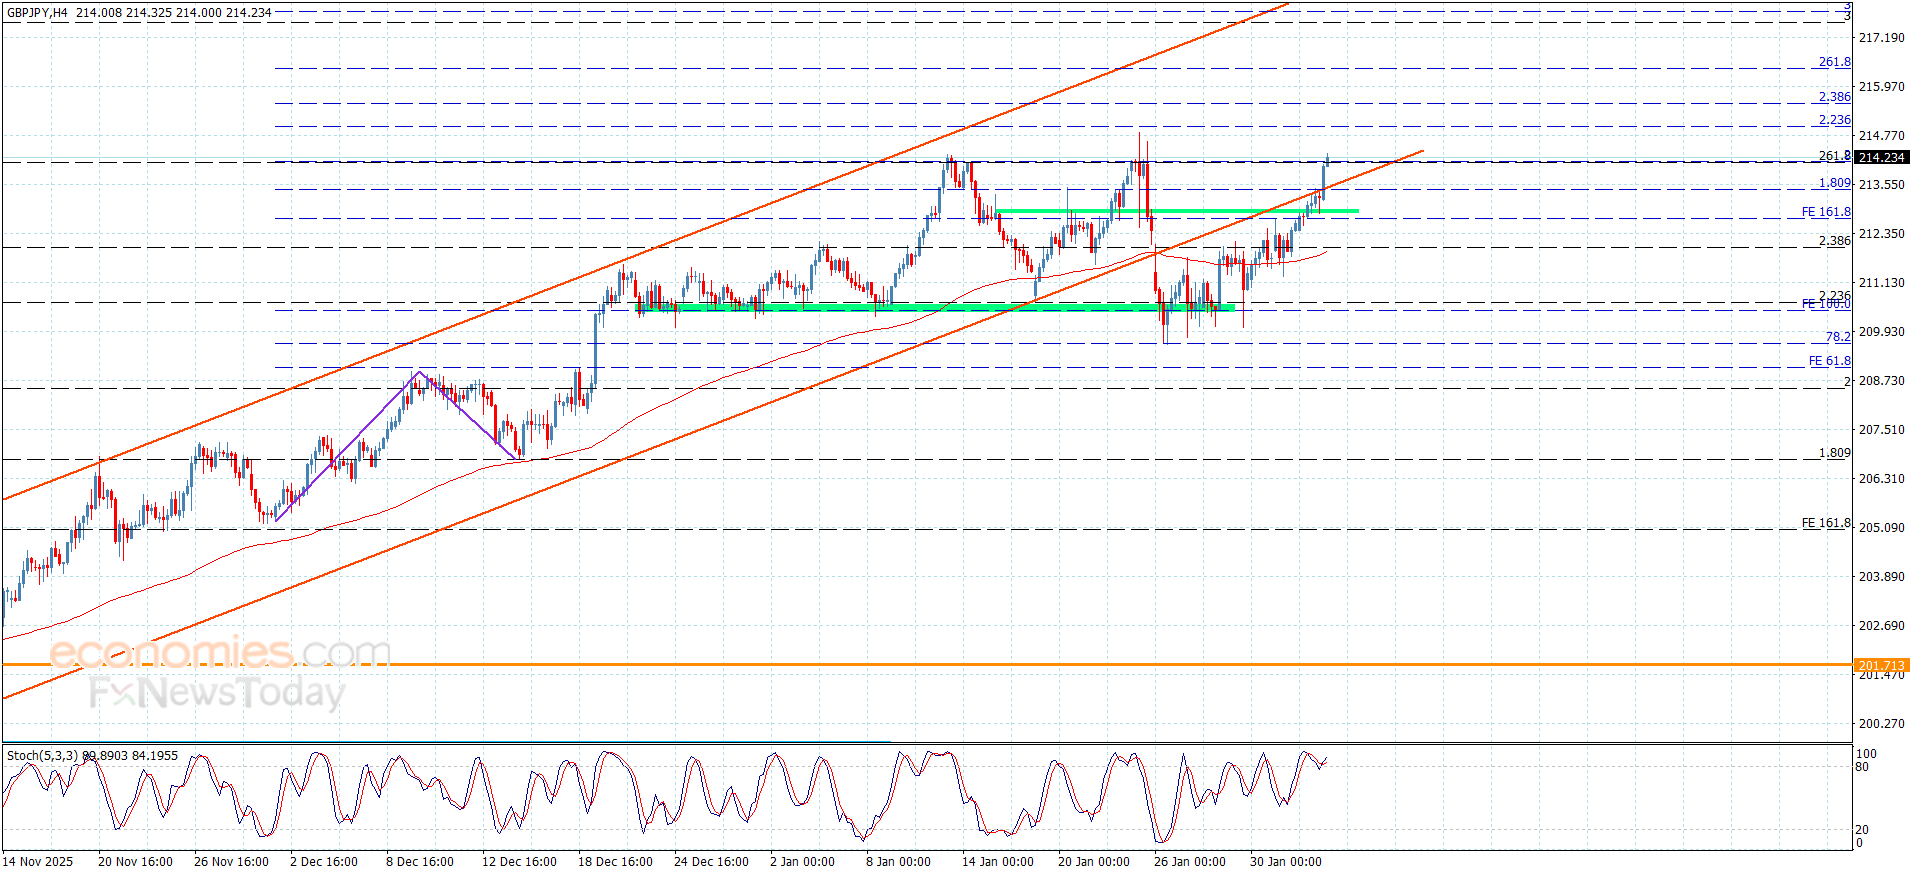
The GBPJPY pair benefited from providing bullish momentum by the main indicators, especially with stochastic reach towards 80 level, forming a strong bullish rally to surpass the barrier at 213.00, to settle above the bullish channel’s support at 213.55 level, to target some extra gains by reaching 214.30.
The stability above the bullish channel’s support will provide strong chance of recording extra gains; to expect to form initial target at 214.90 level and surpassing it might extend the trading in the near period towards 215.55 and 216.35.
The expected trading range for today is between 213.80 and 214.90
Trend forecast: Bullish
– Written by
Ben Hughes
STORY LINK GBP/USD Forecast: Pound Sterling Loses Momentum as Dollar Firms on US Data
The Pound to US Dollar exchange rate (GBP/USD) drifted lower on Wednesday, easing back as investors digested a fresh batch of US economic data that lent modest support to the Dollar.
At the time of writing, GBP/USD was trading close to $1.3663, down around 0.2% from the start of the European session.
The US Dollar found some footing after the latest ISM services PMI signalled continued resilience in the US economy. January’s index held steady at 53.8, outperforming expectations for a slight dip to 53.5 and reinforcing the view that the services sector remains a source of strength.
Although the data lacked the punch of recent manufacturing releases, it was sufficient to underpin the Dollar and offset weaker labour market signals from the ADP employment report.
With the official non-farm payrolls release postponed due to the partial government shutdown, markets paid closer attention to the ADP figures, which showed job creation slowed sharply last month. Employment growth eased from 37,000 to just 22,000, highlighting a cooling trend in hiring.
The Pound, meanwhile, struggled to gain traction following the release of the UK’s final services PMI for January.
The index was revised down to 54 from an initial estimate of 54.3. While still marking the fastest pace of expansion since August 2025, the downgrade disappointed hopes of a fresh multi-month high and limited Sterling demand.
Get better rates and lower fees on your next international money transfer.
Compare TorFX with top UK banks in seconds and see how much you could save.
The survey also flagged ongoing weakness in employment, with service-sector firms continuing to scale back hiring. An increasing focus on automation and efficiency is weighing on job creation, tempering the otherwise upbeat headline reading.
Looking ahead, near-term direction in the Pound to US Dollar exchange rate is likely to hinge on the Bank of England’s first policy decision of 2026.
While no change in interest rates is expected, traders will scrutinise the BoE’s guidance for clues on how policymakers assess the outlook for inflation and growth. Any shift towards a firmer or more cautious tone could help Sterling stabilise as markets reassess expectations for future rate cuts.
For the US Dollar, attention will turn to the University of Michigan’s latest consumer sentiment survey. A further dip in confidence could erode some of the Dollar’s recent support if household morale continues to weaken.

International Money Transfer? Ask our resident FX expert a money transfer question or try John’s new, free, no-obligation personal service! ,where he helps every step of the way,
ensuring you get the best exchange rates on your currency requirements.
TAGS: Pound Dollar Forecasts
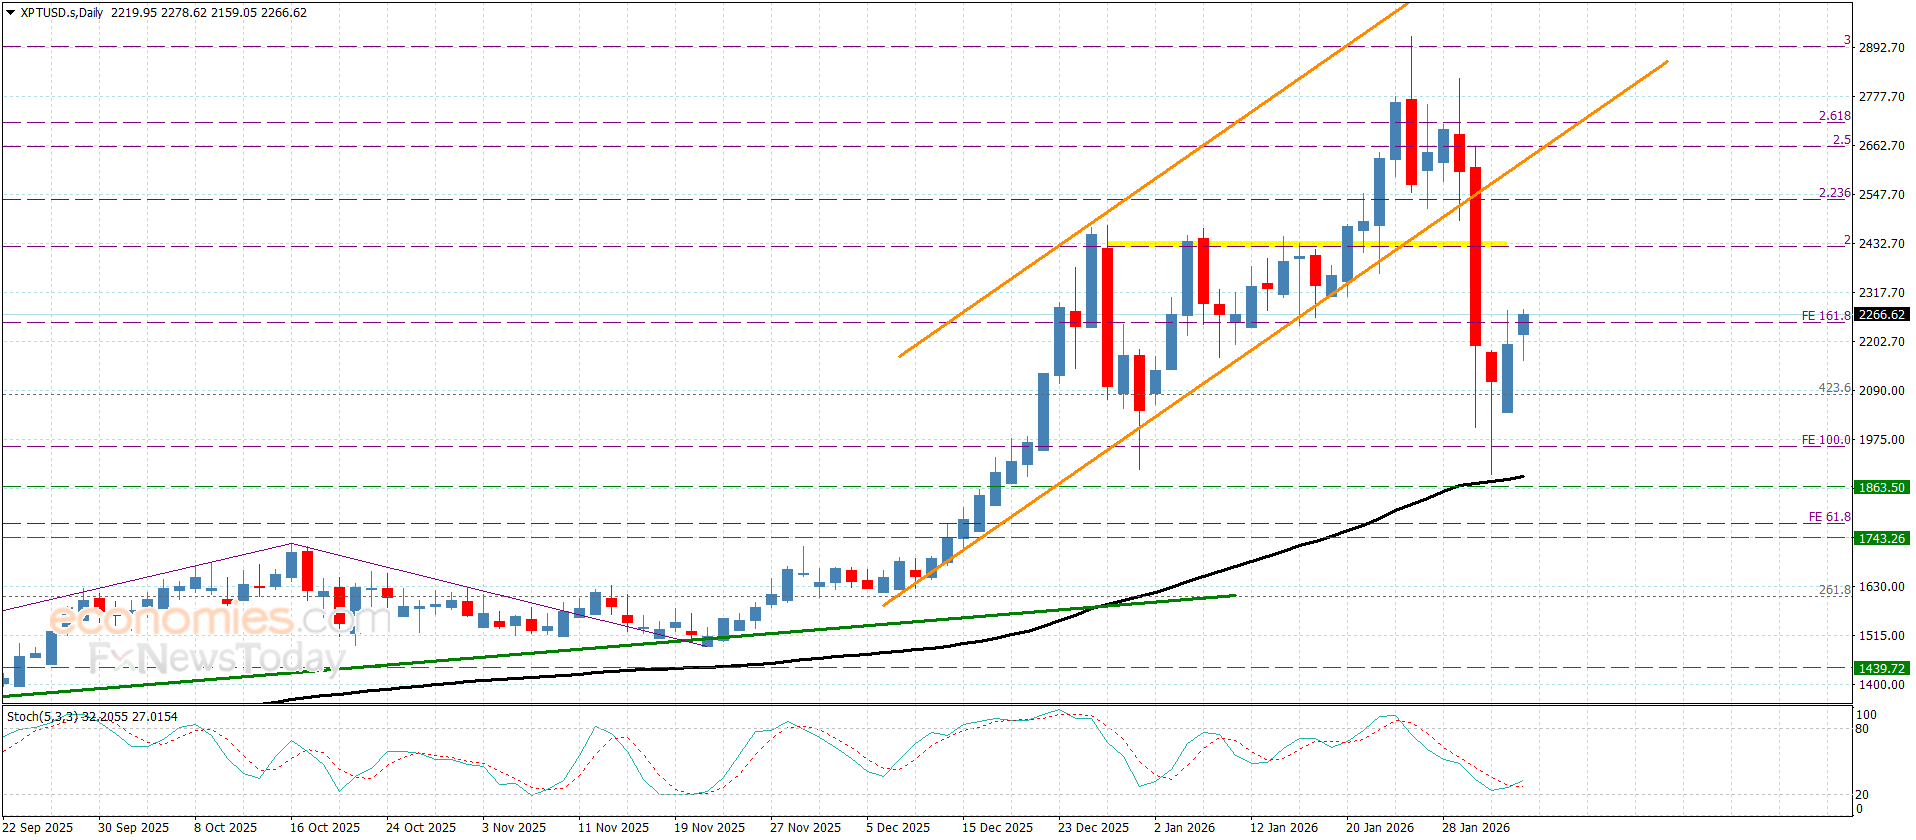
Platinum price benefited from positive stability above $1950.00 support, reinforcing the bullish scenario to rally $2275.00, achieving the initial suggested targets in the previous report.
No escape from forming new bullish waves, due to the bullish momentum by the main indicators, to expect its rally towards $2340.00, attempting to test $2425.00 resistance, forming a detecting key for the main targets in the upcoming period trading.
The expected trading range for today is between $2140.00 and $2400.00
Trend forecast: Bullish
I look at this market as one that could offer opportunities on dips, but it will also be very noisy and rocky to say the least.
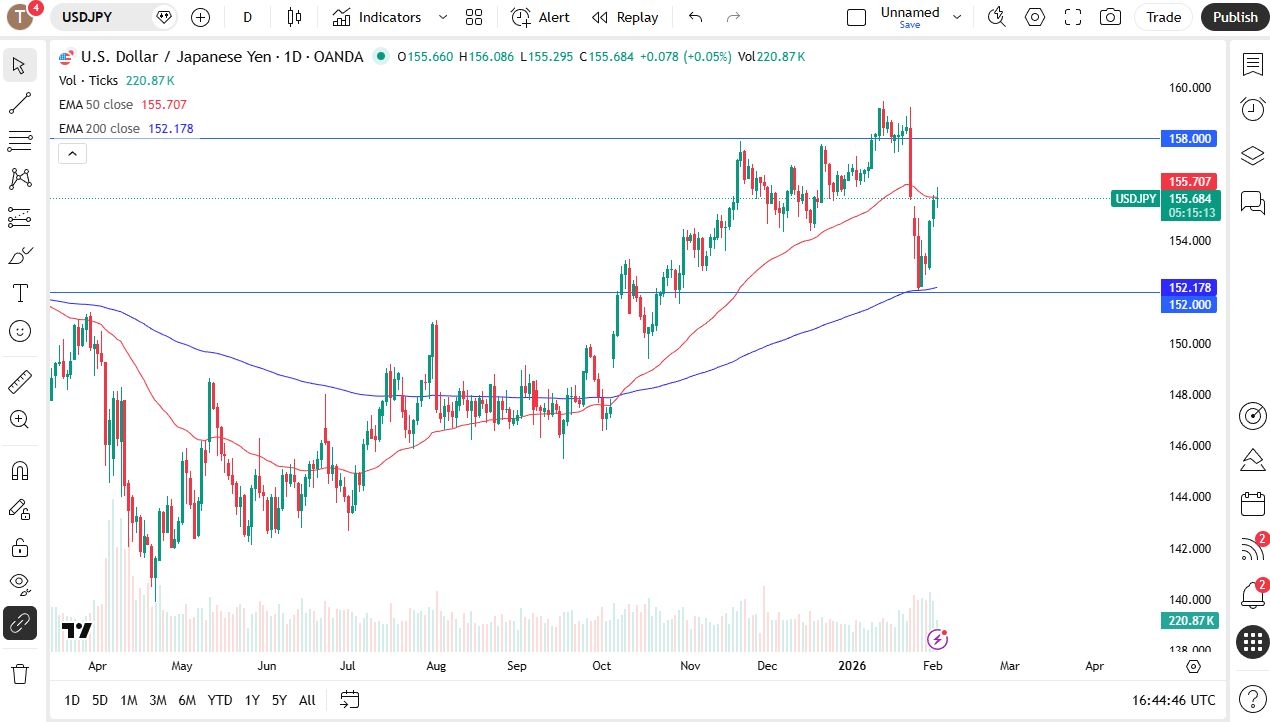
The US dollar has gone back and forth against the Japanese yen during trading here on Tuesday and it does suggest that perhaps we do not really know what to do next as we are hanging around the 50-day EMA which in and of itself will cause a certain amount of chaos.
But I think you also have to realize that this pair is struggling due to the fact that the US dollar itself is a little soft during the trading session. However, I look at this as a buy on the dip opportunity and you do get paid to hang on to the US dollar against the Japanese yen.
Furthermore, this is a great measuring stick as to how the Japanese yen may or may not behave. And I think at this point it is obvious that the Japanese yen is in significant trouble and with that being the case I do prefer to hold the dollar as it pays you at the end of every day.
But we are also a little stretched from a longer-term perspective. Maybe a little bit of choppiness here is on tap. I suspect you probably have an easier time with something like the British pound against the Japanese yen but I also recognize that they all tend to move in the same direction over the longer term.
The Bank of Japan finds itself in a situation where it has a lot of problems tightening monetary policy despite the fact that yet again people fell for that line. Now we have a situation where I think the 200-day EMA becomes increasingly important.
As long as we can stay above there, I am looking to buy dips, maybe collect profit on the way up and then buy the next dip. I do think the US dollar does eventually reach the 158-yen level again.
Want to trade our USD/JPY forex analysis and predictions? Here’s a list of forex brokers in Japan to check out.
Christopher Lewis has been trading Forex and has over 20 years experience in financial markets. Chris has been a regular contributor to Daily Forex since the early days of the site. He writes about Forex for several online publications, including FX Empire, Investing.com, and his own site, aptly named The Trader Guy. Chris favours technical analysis methods to identify his trades and likes to trade equity indices and commodities as well as Forex. He favours a longer-term trading style, and his trades often last for days or weeks.
Silver (XAG/USD) shows moderate gains on Tuesday, trading at $87.05 at the time of writing. The white metal found some footing after plummeting more than 30% in the previous two trading days, hitting one-month lows right below the $72.00 line.
Contrary to their usual behaviour, precious metals are recovering on Tuesday amid a brighter market sentiment. A trade deal between the US and India and news about upcoming nuclear talks with Iran have improved investors’ mood and are boosting demand for risky assets.
XAG/USD has trimmed some losses, but technical indicators are still at levels highlighting a bearish momentum. The Moving Average Convergence Divergence (MACD) remains below the Signal line and the zero mark, while the negative histogram contracts toward zero. The Relative Strength Index (RSI) edges higher, hinting at ∑ unwinding negative pressure, but remains below the key 50 level.
On the upside, the pair is likely to meet resistance at Monday’s highs, in the $88.00 area. A confirmation beyond here would shift the focus towards the $100.00 round level and the intra-day resistance in the $104.00 area.
Support levels are at the $71.37 monthly low and below here, the early December highs, and mid-December lows in the $60.00 area.
(The technical analysis of this story was written with the help of an AI tool.)
Silver is a precious metal highly traded among investors. It has been historically used as a store of value and a medium of exchange. Although less popular than Gold, traders may turn to Silver to diversify their investment portfolio, for its intrinsic value or as a potential hedge during high-inflation periods. Investors can buy physical Silver, in coins or in bars, or trade it through vehicles such as Exchange Traded Funds, which track its price on international markets.
Silver prices can move due to a wide range of factors. Geopolitical instability or fears of a deep recession can make Silver price escalate due to its safe-haven status, although to a lesser extent than Gold’s. As a yieldless asset, Silver tends to rise with lower interest rates. Its moves also depend on how the US Dollar (USD) behaves as the asset is priced in dollars (XAG/USD). A strong Dollar tends to keep the price of Silver at bay, whereas a weaker Dollar is likely to propel prices up. Other factors such as investment demand, mining supply – Silver is much more abundant than Gold – and recycling rates can also affect prices.
Silver is widely used in industry, particularly in sectors such as electronics or solar energy, as it has one of the highest electric conductivity of all metals – more than Copper and Gold. A surge in demand can increase prices, while a decline tends to lower them. Dynamics in the US, Chinese and Indian economies can also contribute to price swings: for the US and particularly China, their big industrial sectors use Silver in various processes; in India, consumers’ demand for the precious metal for jewellery also plays a key role in setting prices.
Silver prices tend to follow Gold’s moves. When Gold prices rise, Silver typically follows suit, as their status as safe-haven assets is similar. The Gold/Silver ratio, which shows the number of ounces of Silver needed to equal the value of one ounce of Gold, may help to determine the relative valuation between both metals. Some investors may consider a high ratio as an indicator that Silver is undervalued, or Gold is overvalued. On the contrary, a low ratio might suggest that Gold is undervalued relative to Silver.
Following Tuesday’s short-lasting recovery, EUR/USD moves sideways in a narrow channel above 1.1800 in the European morning on Wednesday. While investors await key data releases, the technical outlook points to a lack of seller interest.
The table below shows the percentage change of Euro (EUR) against listed major currencies this week. Euro was the strongest against the Japanese Yen.
| USD | EUR | GBP | JPY | CAD | AUD | NZD | CHF | |
|---|---|---|---|---|---|---|---|---|
| USD | 0.15% | -0.15% | 0.95% | 0.20% | -1.18% | -0.48% | 0.50% | |
| EUR | -0.15% | -0.35% | 0.83% | 0.04% | -1.34% | -0.63% | 0.35% | |
| GBP | 0.15% | 0.35% | 1.05% | 0.39% | -1.00% | -0.29% | 0.70% | |
| JPY | -0.95% | -0.83% | -1.05% | -0.74% | -2.13% | -1.37% | -0.71% | |
| CAD | -0.20% | -0.04% | -0.39% | 0.74% | -1.35% | -0.65% | 0.31% | |
| AUD | 1.18% | 1.34% | 1.00% | 2.13% | 1.35% | 0.73% | 1.69% | |
| NZD | 0.48% | 0.63% | 0.29% | 1.37% | 0.65% | -0.73% | 0.99% | |
| CHF | -0.50% | -0.35% | -0.70% | 0.71% | -0.31% | -1.69% | -0.99% |
The heat map shows percentage changes of major currencies against each other. The base currency is picked from the left column, while the quote currency is picked from the top row. For example, if you pick the Euro from the left column and move along the horizontal line to the US Dollar, the percentage change displayed in the box will represent EUR (base)/USD (quote).
The US Dollar (USD) remained under modest selling pressure on Tuesday and helped EUR/USD edge higher. After the US House passed a package to end the partial government shutdown later in the day, the USD kept its footing and limited the pair’s upside.
On Wednesday, the Eurostat will publish the preliminary Harmonized Index of Consumer Price (HICP), the European Central Bank’s (ECB) preferred gauge of inflation, data for January. Markets expect the annual HICP inflation to soften to 1.7% from 1.9% in December. A stronger-than-forecast print could support the Euro and help EUR/USD to build on Tuesday’s modest gains. On the other hand, soft reading could have the opposite impact on the pair’s action with the immediate reaction.
In the second half of the day, the US economic calendar will feature the Automatic Data Processing’s (ADP) Employment Change data and the Institue for Supply Management’s (ISM) Services Purchasing Managers’ Index (PMI) report for January.
Investors expect employment in the private sector to rise by 48K. A strong reading, above 60K, could boost the USD and weigh on EUR/USD. The ISM Services PMI is seen edging lower to 53.5 from 54.4, with the Employment Index of the survey improving to 52.3 from 52. In case both the headline PMI and the Employment Index come in better than forecast, investors could see that as a sign that could delay the next Federal Reserve rate cut, supporting the USD and dragging the pair lower.
In the 4-hour chart, EUR/USD trades at 1.1828. The 20-period Simple Moving Average (SMA) slopes lower and now sits beneath the rising 50-period SMA, flagging fading short-term momentum. The 50-, 100- and 200-period SMAs trend higher, keeping the broader bias positive as price holds below the short-term averages but above the longer ones.
The Relative Strength Index (14) prints at 45, neutral and recovering modestly, suggesting momentum stabilizes but remains below the midline. Measured from the 1.1590 low to the 1.2025 high, the 50% retracement at 1.1807 offers initial support, with the 61.8% retracement at 1.1756 below. On the upside, 1.1858 (Fibonacci 38.2% retracement) could act as the first resistance level before 1.1880 (50-period SMA) and 1.1920 (Fibonacci 23.6% retracement).
(The technical analysis of this story was written with the help of an AI tool.)
The Euro is the currency for the 20 European Union countries that belong to the Eurozone. It is the second most heavily traded currency in the world behind the US Dollar. In 2022, it accounted for 31% of all foreign exchange transactions, with an average daily turnover of over $2.2 trillion a day.
EUR/USD is the most heavily traded currency pair in the world, accounting for an estimated 30% off all transactions, followed by EUR/JPY (4%), EUR/GBP (3%) and EUR/AUD (2%).
The European Central Bank (ECB) in Frankfurt, Germany, is the reserve bank for the Eurozone. The ECB sets interest rates and manages monetary policy.
The ECB’s primary mandate is to maintain price stability, which means either controlling inflation or stimulating growth. Its primary tool is the raising or lowering of interest rates. Relatively high interest rates – or the expectation of higher rates – will usually benefit the Euro and vice versa.
The ECB Governing Council makes monetary policy decisions at meetings held eight times a year. Decisions are made by heads of the Eurozone national banks and six permanent members, including the President of the ECB, Christine Lagarde.
Eurozone inflation data, measured by the Harmonized Index of Consumer Prices (HICP), is an important econometric for the Euro. If inflation rises more than expected, especially if above the ECB’s 2% target, it obliges the ECB to raise interest rates to bring it back under control.
Relatively high interest rates compared to its counterparts will usually benefit the Euro, as it makes the region more attractive as a place for global investors to park their money.
Data releases gauge the health of the economy and can impact on the Euro. Indicators such as GDP, Manufacturing and Services PMIs, employment, and consumer sentiment surveys can all influence the direction of the single currency.
A strong economy is good for the Euro. Not only does it attract more foreign investment but it may encourage the ECB to put up interest rates, which will directly strengthen the Euro. Otherwise, if economic data is weak, the Euro is likely to fall.
Economic data for the four largest economies in the euro area (Germany, France, Italy and Spain) are especially significant, as they account for 75% of the Eurozone’s economy.
Another significant data release for the Euro is the Trade Balance. This indicator measures the difference between what a country earns from its exports and what it spends on imports over a given period.
If a country produces highly sought after exports then its currency will gain in value purely from the extra demand created from foreign buyers seeking to purchase these goods. Therefore, a positive net Trade Balance strengthens a currency and vice versa for a negative balance.
The GBPJPY pair benefited from providing bullish momentum by the main indicators, especially with stochastic reach towards 80 level, forming a strong bullish rally to surpass the barrier at 213.00, to settle above the bullish channel’s support at 213.55 level, to target some extra gains by reaching 214.30.
The stability above the bullish channel’s support will provide strong chance of recording extra gains; to expect to form initial target at 214.90 level and surpassing it might extend the trading in the near period towards 215.55 and 216.35.
The expected trading range for today is between 213.80 and 214.90
Trend forecast: Bullish
The GBPJPY pair benefited from providing bullish momentum by the main indicators, especially with stochastic reach towards 80 level, forming a strong bullish rally to surpass the barrier at 213.00, to settle above the bullish channel’s support at 213.55 level, to target some extra gains by reaching 214.30.
The stability above the bullish channel’s support will provide strong chance of recording extra gains; to expect to form initial target at 214.90 level and surpassing it might extend the trading in the near period towards 215.55 and 216.35.
The expected trading range for today is between 213.80 and 214.90
Trend forecast: Bullish
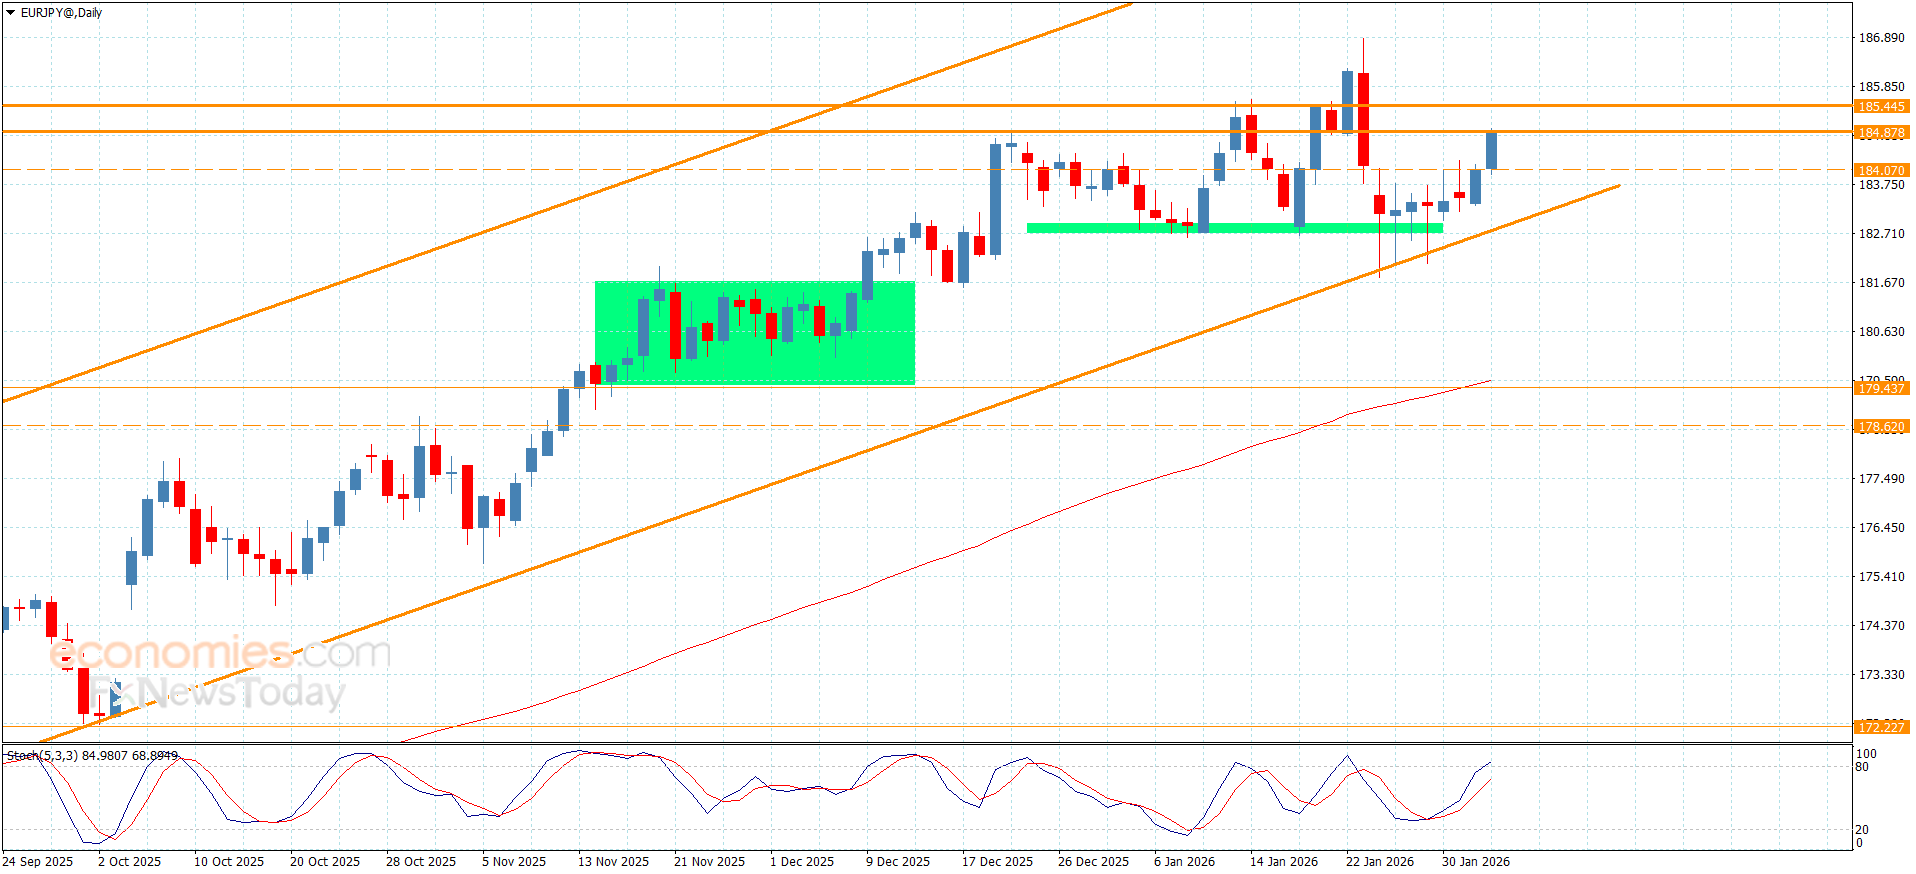
The EUR/JPY cross posts modest gains near 183.50 during the early European session on Tuesday. The Euro (EUR) edges higher against the Japanese Yen (JPY) as the European Central Bank (ECB) is expected to maintain its current policy through 2026, while the Bank of Japan (BoJ) faces reduced urgency for further rate hikes following a sharp drop in Tokyo CPI inflation in January.
Furthermore, Japanese Prime Minister Sanae Takaichi has called for a snap general election on February 8. Political uncertainty in Japan and expectations of Takaichi’s reflationary policies could weigh on the JPY and create a tailwind for the cross.
On the other hand, the upside for EUR/JPY might be limited amid potential intervention from Japanese authorities. Japan’s Finance Minister Satsuki Katayama stated on Tuesday that she will continue to closely coordinate with US authorities as needed, based on a joint Japan and US statement issued in September last year, and respond appropriately.
In the daily chart, EUR/JPY holds above the 100-day EMA, underscoring a still-positive medium-term bias. Price consolidates around the 20-day SMA at 184.00, and a close back above this pivot could restore topside momentum. RSI at 49.22 sits near neutral, confirming the recent loss of impulse.
Bollinger Bands are starting to narrow, with the pair holding below the middle band, pointing to reduced volatility and a mild downward skew. The upper band at 185.80 caps rallies, while the lower band at 182.20 supports. A topside break would open room for continuation, whereas a close beneath support would turn focus to the rising 100-day EMA at 180.08.
(The technical analysis of this story was written with the help of an AI tool.)
The Japanese Yen (JPY) is one of the world’s most traded currencies. Its value is broadly determined by the performance of the Japanese economy, but more specifically by the Bank of Japan’s policy, the differential between Japanese and US bond yields, or risk sentiment among traders, among other factors.
One of the Bank of Japan’s mandates is currency control, so its moves are key for the Yen. The BoJ has directly intervened in currency markets sometimes, generally to lower the value of the Yen, although it refrains from doing it often due to political concerns of its main trading partners. The BoJ ultra-loose monetary policy between 2013 and 2024 caused the Yen to depreciate against its main currency peers due to an increasing policy divergence between the Bank of Japan and other main central banks. More recently, the gradually unwinding of this ultra-loose policy has given some support to the Yen.
Over the last decade, the BoJ’s stance of sticking to ultra-loose monetary policy has led to a widening policy divergence with other central banks, particularly with the US Federal Reserve. This supported a widening of the differential between the 10-year US and Japanese bonds, which favored the US Dollar against the Japanese Yen. The BoJ decision in 2024 to gradually abandon the ultra-loose policy, coupled with interest-rate cuts in other major central banks, is narrowing this differential.
The Japanese Yen is often seen as a safe-haven investment. This means that in times of market stress, investors are more likely to put their money in the Japanese currency due to its supposed reliability and stability. Turbulent times are likely to strengthen the Yen’s value against other currencies seen as more risky to invest in.
BitcoinWorld
EUR/GBP Forecast: Bank of America’s Ominous Bearish Signal as Option Flow Shifts Dramatically
Quantitative analysts at Bank of America have issued a significant bearish signal for the EUR/GBP currency pair, marking a notable shift in institutional positioning and market sentiment for early 2025. This development emerges as option flow data reveals substantial changes in derivatives market activity, potentially foreshadowing directional moves in one of Europe’s most closely watched currency crosses.
Bank of America’s quantitative research team has identified multiple concerning signals within the EUR/GBP technical structure. The currency pair recently broke below its 200-day moving average, a critical long-term support level that had held firm throughout much of 2024. Furthermore, momentum indicators including the Relative Strength Index (RSI) and Moving Average Convergence Divergence (MACD) have entered bearish territory, confirming the weakening technical picture.
Historical data analysis reveals that similar technical breakdowns in the past have preceded sustained directional moves. The current price action suggests potential support levels at 0.8400 and 0.8320, with resistance now established at the previous support-turned-resistance level of 0.8520. Market participants should monitor these levels closely for confirmation of the bearish thesis.
Derivatives market activity provides compelling evidence supporting the bearish outlook. Recent option flow data shows a notable increase in put option volume for EUR/GBP, particularly in the 1-3 month expiration range. This indicates institutional investors are increasingly hedging against or positioning for euro weakness relative to the British pound.
The put-call ratio, a key sentiment indicator, has shifted decisively in favor of puts, reaching levels not seen since the third quarter of 2023. Additionally, volatility skew analysis reveals higher implied volatility for downside protection, suggesting options traders are pricing in greater risk of euro depreciation than appreciation in the coming months.
Bank of America’s quantitative models incorporate multiple data streams beyond traditional technical analysis. These models analyze:
Historical analysis shows that when these quantitative indicators align in their current configuration, the EUR/GBP has experienced directional moves averaging 3-5% over the subsequent three-month period. The current signal strength ranks in the 85th percentile of historical observations, suggesting above-average conviction in the bearish outlook.
Several fundamental factors contribute to the evolving EUR/GBP dynamic. The European Central Bank maintains a relatively dovish stance compared to the Bank of England, creating interest rate differentials that favor sterling. Additionally, economic growth projections for 2025 show the UK economy potentially outperforming the Eurozone, particularly in services and technology sectors.
Political developments also influence the currency pair. Upcoming European Parliament elections and ongoing trade negotiations create uncertainty for the euro, while UK economic policy appears increasingly stable following post-Brexit adjustments. These factors combine to create fundamental headwinds for EUR/GBP in the medium term.
| Currency Pair | Current Trend | Institutional Sentiment | Key Driver |
|---|---|---|---|
| EUR/GBP | Bearish | Increasingly Negative | Interest Rate Differentials |
| EUR/USD | Neutral to Bearish | Mixed | Fed vs ECB Policy |
| GBP/USD | Bullish | Positive | UK Economic Resilience |
This comparative analysis reveals that EUR/GBP represents one of the clearest directional plays among major currency pairs, according to institutional positioning data. The divergence between euro and pound sentiment has widened significantly in recent weeks, creating potential trading opportunities for informed market participants.
The bearish signal from Bank of America’s quantitative team carries significant implications for various market participants. Currency traders may consider adjusting their EUR/GBP exposure, while multinational corporations with euro-pound currency risk should review their hedging strategies. Portfolio managers with European equity exposure might evaluate currency-hedged positions to mitigate potential translation losses.
Historical volatility patterns suggest that currency pairs experiencing similar quantitative signals have shown increased volatility in the 30-60 days following the signal. Market participants should therefore prepare for potentially larger daily moves and consider appropriate position sizing and risk management strategies.
Bank of America’s quantitative analysis presents a compelling bearish case for EUR/GBP, supported by shifting option flow data, technical breakdowns, and fundamental divergences. The convergence of these factors suggests potential euro weakness against sterling in the coming months. While currency markets remain inherently unpredictable, the weight of quantitative evidence warrants careful consideration by all EUR/GBP market participants as they navigate the evolving 2025 currency landscape.
Q1: What specific option flow changes triggered Bank of America’s bearish signal?
The analysis identified increased put option volume, particularly in 1-3 month expiries, and a significant shift in the put-call ratio favoring downside protection. These changes suggest institutional investors are increasingly positioning for or hedging against euro weakness.
Q2: How reliable are quantitative signals for currency pair forecasting?
Quantitative models have demonstrated varying reliability depending on market conditions. Bank of America’s models show approximately 65-70% accuracy for directional signals over three-month horizons when multiple indicators converge, though past performance doesn’t guarantee future results.
Q3: What time horizon does this EUR/GBP forecast cover?
The analysis primarily focuses on the 1-3 month horizon, though some indicators suggest potential trends extending through the first half of 2025. Currency forecasts typically have decreasing accuracy beyond three months due to changing fundamentals.
Q4: How does this analysis compare to other major bank forecasts for EUR/GBP?
Several other institutions have expressed cautious or neutral views, making Bank of America’s bearish stance relatively distinctive. Divergence among analyst views often indicates genuine market uncertainty and potential trading opportunities.
Q5: What key support levels should traders monitor for EUR/GBP?
Technical analysis identifies 0.8400 and 0.8320 as critical support levels. A sustained break below these levels would confirm the bearish technical structure and potentially trigger further selling pressure.
This post EUR/GBP Forecast: Bank of America’s Ominous Bearish Signal as Option Flow Shifts Dramatically first appeared on BitcoinWorld.