The main category of All News Articles.
You can use the search box below to find what you need.
[wd_asp id=1]
The main category of All News Articles.
You can use the search box below to find what you need.
[wd_asp id=1]
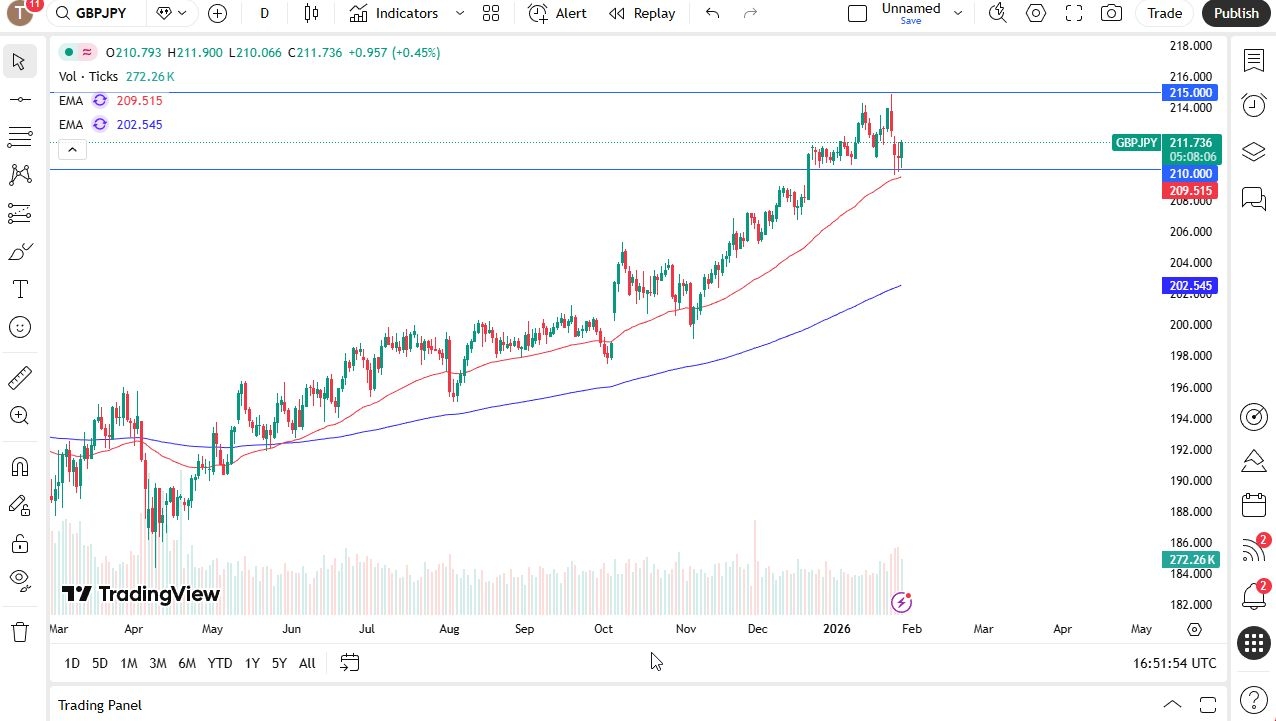
The British pound initially fell a bit during the trading session on Wednesday but continues to see the 210 yen level as an area of support. I like this pair a lot, and I do think that it is probably only a matter of time before we start buying again.
Short-term pullbacks offer enough value that I definitely like watching for a bounce that I can take advantage of the continued longer-term uptrend. The 215-yen level is an area I would be watching as well.
As a side note, the United States government has come out and explicitly denied any intervention in the Japanese yen, so we will see how that plays out. The US dollar against the Japanese yen has been hammered, but in that same time frame, we have only seen the British pound test the bottom of the recent consolidation.
I think this is a sign that this pair is going to remain rather resilient. The 50-day EMA sits just below the 210-yen level as well, so I think all of this comes together to offer value each and every time we drop.
If we can break above the 215-yen level, that really gets this pair going, but I think in the short term, this is a buy the dip, maybe sell the rip type of situation where we take advantage of a well-defined 500-point range. If we were to break down below the 50-day EMA, then we might have to reset closer to 208. This is a level that I would be very interested in as well.
Begin trading our daily forecasts and analysis. Here is a list of Forex brokers in Japan to work with.
Christopher Lewis has been trading Forex and has over 20 years experience in financial markets. Chris has been a regular contributor to Daily Forex since the early days of the site. He writes about Forex for several online publications, including FX Empire, Investing.com, and his own site, aptly named The Trader Guy. Chris favours technical analysis methods to identify his trades and likes to trade equity indices and commodities as well as Forex. He favours a longer-term trading style, and his trades often last for days or weeks.
Natural gas price continued providing weak sideways trading, affected by the contradiction between the main indicators besides forming a significant obstacle against the attempts to renew the bullish attack, fluctuating near $3.850.
There is a chance for forming new bearish waves, to press on the moving average 55 at $3.450, and surpassing it might extend the losses towards $3.050, facing the extension of historical support, while the price success in surpassing $4.000 level and holding above it will allow it to renew the bullish attempts, to expect targeting $4.220 and $4.450 level.
The expected trading range for today is between $3.450 and $4.050
Trend forecast: Bearish
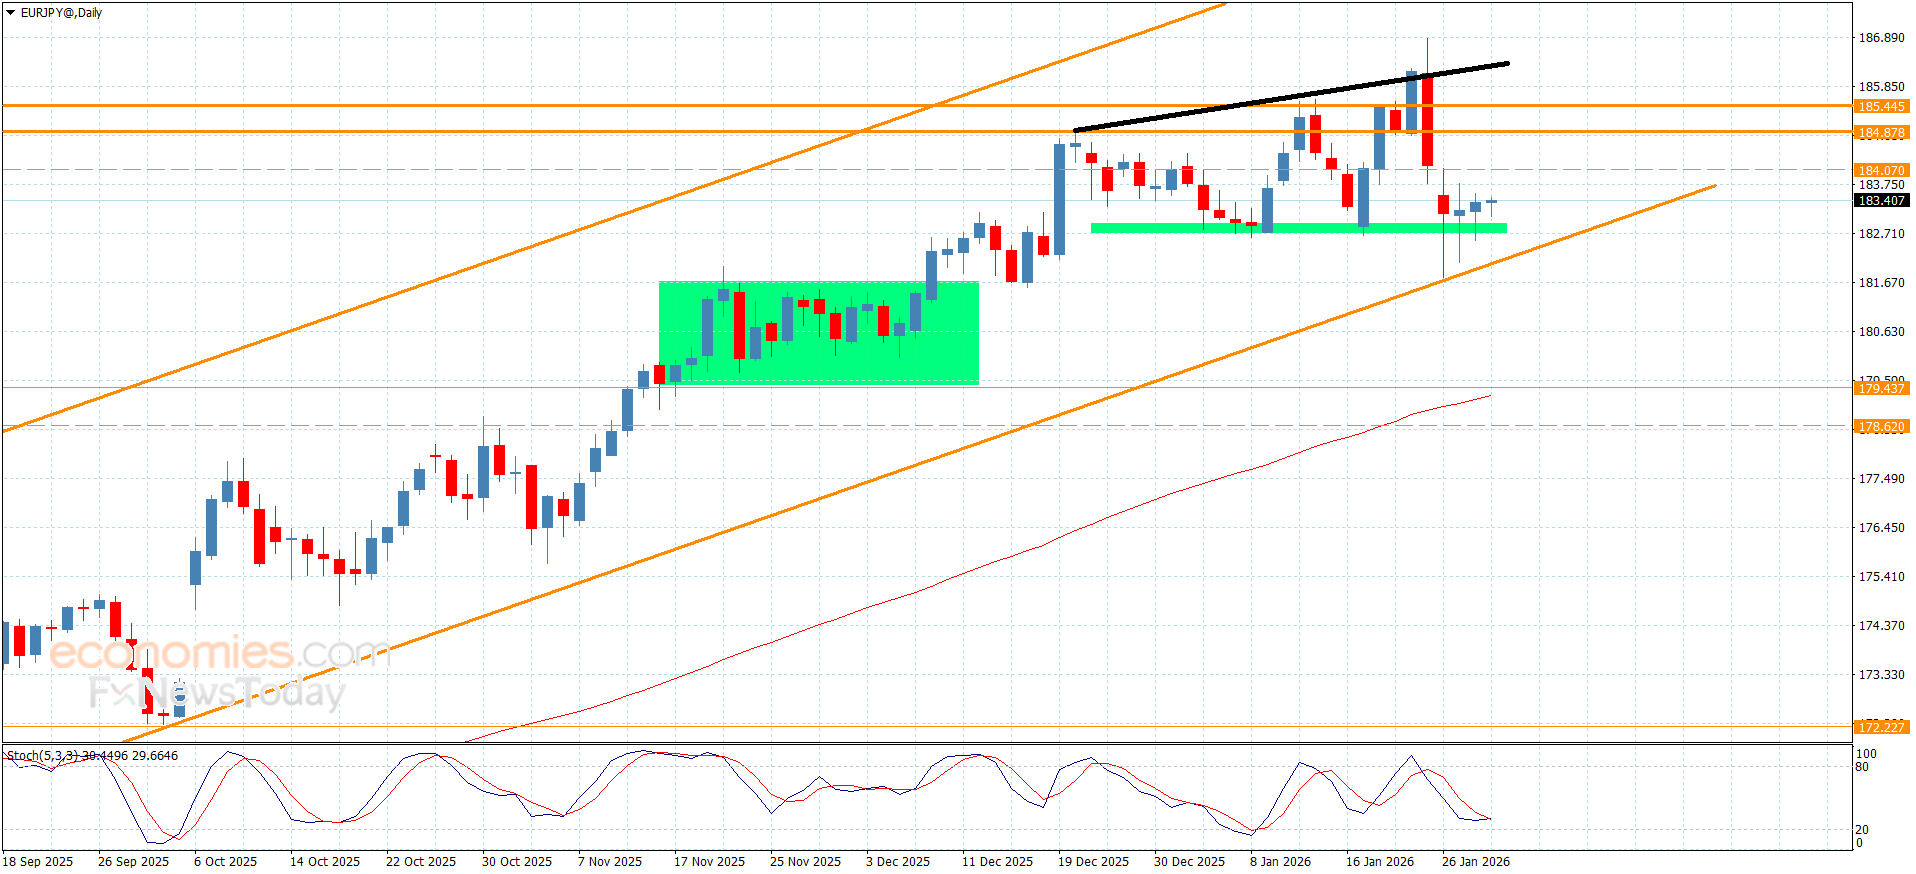
The EURJPY pair repeated providing sideways trading since yesterday, due to the contradiction between the main indicators, to keep its stability near 183.45, taking advantage of forming extra support at 182.70 level.
In general, the stability above the main bullish channel’s support at 182.15 makes us wait for gathering bullish momentum to allow it to surpass 184.00 barrier, to confirm its readiness to record extra gains that might begin at 184.55 and 184.85.
The expected trading range for today is between 182.80 and 184.00
Trend forecast: Bullish
Copper price repeatedly provided sideways trading in the last period, affected by the contradiction between the main indicators, which forces it to settle below $5.9700 barrier, which obstructs the chances of resuming the bullish trend.
All that confirms the price surrender to sideways trading, to keep waiting to achieve the required breach, to open the way for recording new gains by its rally towards $6.1200 reaching the next target at $6.2400.
The expected trading range for today is between $5.7500 and $6.1200
Trend forecast: Sideways until achieving the breach
– Written by
Ben Hughes
STORY LINK GBP/USD Forecast: Pound Sterling Dips as Trump Comments Slow Dollar Slide
The Pound to US Dollar exchange rate (GBP/USD) edged lower during Wednesday’s European session, easing after briefly touching its strongest levels in nearly four years.
At the time of writing, GBP/USD was trading close to $1.3786, down roughly 0.4% from the start of the day’s trade.
After tumbling to fresh multi-year lows late on Tuesday, the US Dollar (USD) found some footing on Wednesday, recovering a fraction of its recent losses.
The greenback has faced sustained selling pressure over the past ten days, shedding around 3% since mid-January. Confidence in the currency has been undermined by ongoing uncertainty surrounding US trade, foreign and economic policy.
Losses deepened overnight after President Donald Trump appeared to welcome the Dollar’s decline, describing the move as ‘great’ and suggesting the currency should be allowed to ‘find its own level’.
By Wednesday morning, however, some USD investors began to reassess positions as attention shifted to the Federal Reserve’s upcoming interest rate decision.
While no change in policy is expected from the Fed at its first meeting of the year, the prospect of firmer guidance was enough to lend the Dollar some modest support.
Get better rates and lower fees on your next international money transfer.
Compare TorFX with top UK banks in seconds and see how much you could save.
The Pound (GBP) struggled to hold its ground against most major counterparts on Wednesday.
With no significant UK economic releases on the calendar, Sterling found itself short of fresh drivers, leaving it vulnerable to shifts in broader market sentiment.
Adding to the pressure, expectations for Bank of England (BoE) interest rates were nudged slightly lower, despite a run of stronger-than-forecast UK data releases last week.
As the week progresses, the Pound to US Dollar exchange rate could regain upward momentum if political risks in Washington intensify.
Ongoing disputes between Senate Democrats and Republicans over Department of Homeland Security funding mean a partial government shutdown appears increasingly likely when current funding expires on Saturday. Such concerns are continuing to inflate the US Dollar’s risk premium.
Meanwhile, with the UK data calendar remaining thin, movements in Sterling are likely to stay closely tied to wider global market dynamics.

International Money Transfer? Ask our resident FX expert a money transfer question or try John’s new, free, no-obligation personal service! ,where he helps every step of the way,
ensuring you get the best exchange rates on your currency requirements.
TAGS: Pound Dollar Forecasts
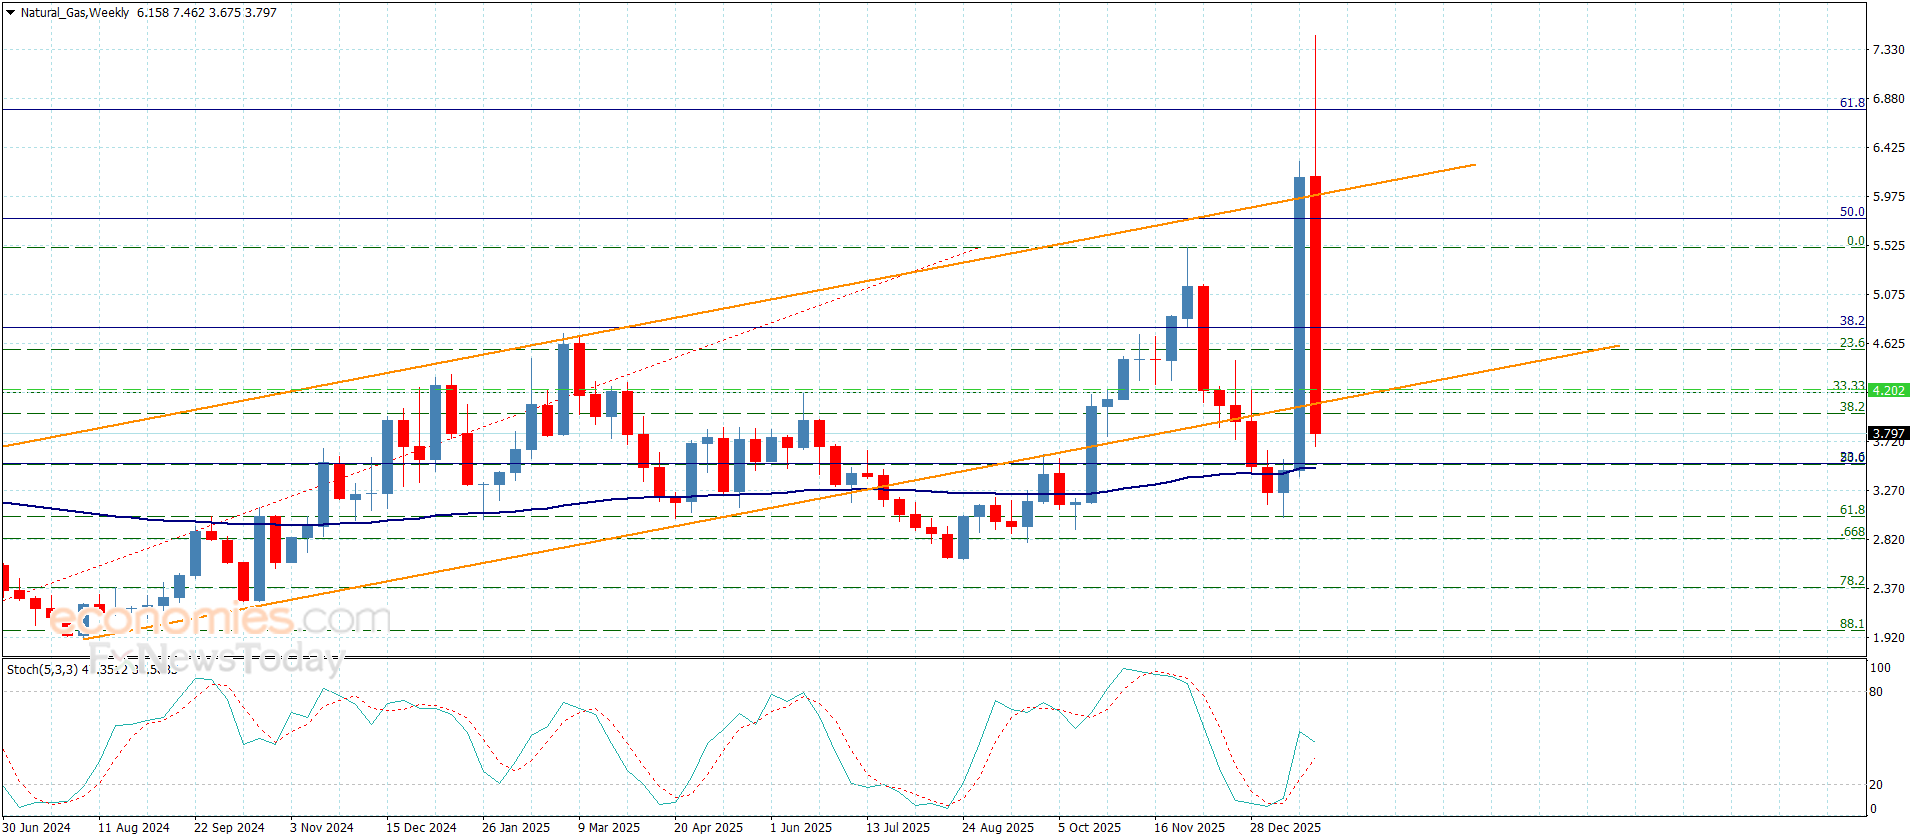
Natural gas price repeatedly provided negative close below the broken support at $4.100 level, forming a new resistance against the current trading, and stochastic attempt to provide negative momentum by reaching below 50 level will force the price to form new bearish waves, reaching $3.450 and surpassing it might force it to decline towards $3.220, to test high liquidity grab zones.
While the rally above $4.100 and providing bullish close will increase the chances of forming new bullish waves, to attempt to reach $3.370 initially, then waiting for targeting %38.2 Fibonacci correction level near $4.750.
The expected trading range for today is between $3.450 and $4.100
Trend forecast: Bearish
Important DisclaimersFXEmpire is owned and operated by Empire Media Network LTD., Company Registration Number 514641786, registered at 7 Jabotinsky Road, Ramat Gan 5252007, Israel. The content provided on this website includes general news and publications, our personal analysis and opinions, and materials provided by third parties. This content is intended for educational and research purposes only. It does not constitute, and should not be interpreted as, a recommendation or advice to take any action, including making any investment or purchasing any product. Before making any financial decision, you should conduct your own due diligence, exercise your own discretion, and consult with competent advisors. The content on this website is not personally directed to you, and we do not take into account your individual financial situation or needs. The information contained on this website is not necessarily provided in real time, nor is it guaranteed to be accurate. Prices displayed may be provided by market makers and not by exchanges. Any trading or other financial decision you make is entirely your own responsibility, and you must not rely solely on any information provided through the website. FXEmpire does not provide any warranty regarding the accuracy, completeness, or reliability of any information contained on the website and shall bear no responsibility for any trading losses you may incur as a result of using such information. The website may include advertisements and other promotional content. FXEmpire may receive compensation from third parties in connection with such content. FXEmpire does not endorse, recommend, or assume responsibility for the use of any third-party services or websites. Empire Media Network LTD., its employees, officers, subsidiaries, and affiliates shall not be liable for any loss or damage resulting from your use of the website or reliance on the information provided herein.Risk DisclaimersThis website contains information about cryptocurrencies, contracts for difference (CFDs), and other financial instruments, as well as about brokers, exchanges, and other entities trading in such instruments. Both cryptocurrencies and CFDs are complex instruments and involve a high risk of losing money. You should carefully consider whether you understand how these instruments work and whether you can afford to take the high risk of losing your money. FX Empire encourages you to conduct your own research before making any investment decision and to avoid investing in any financial instrument unless you fully understand how it works and the risks involved.
Silver price (XAG/USD) continues its winning streak for the fifth consecutive session, trading around $115.10 per troy ounce during the early European hours on Wednesday. Safe-haven silver rises toward its January 26 record high of $117.74 as investors shifted into defensive assets.
Precious metals, including Silver attract investors following President Donald Trump’s remarks that he is unconcerned about the USD’s recent slide, strengthened expectations that the administration is comfortable with a weaker greenback to boost export competitiveness.
Ongoing policy uncertainty in Washington, including tariff threats and challenges to the Federal Reserve’s (Fed) independence, along with the “Sell America” narrative, continues to dominate sentiment, further supporting gains in precious metals.
The Federal Reserve is expected to leave rates steady at 3.50%–3.75% after its two-day meeting on Wednesday, following three straight cuts in 2025. Attention will turn to the post-meeting press conference for signals on the policy path ahead.
Citi Commodities Research global head Maximillian J. Layton said that Silver is poised to extend its outperformance after breaking above $100.00 per troy ounce. Layton said bullish drivers, including elevated geopolitical risks and renewed concerns over Federal Reserve independence, are likely to persist in the near term. Citi has raised its three-month Silver price forecast to $150.00 from $100.00 previously, per Dow Jones Newswires.
In China, a pure-play Silver fund halted trading after a surge in demand drove its premium far above the value of its underlying assets. Silver has attracted strong retail interest as prices continue to rally, prompting manufacturers to shift production from jewelry toward one-kilogram Silver bars.
Silver is a precious metal highly traded among investors. It has been historically used as a store of value and a medium of exchange. Although less popular than Gold, traders may turn to Silver to diversify their investment portfolio, for its intrinsic value or as a potential hedge during high-inflation periods. Investors can buy physical Silver, in coins or in bars, or trade it through vehicles such as Exchange Traded Funds, which track its price on international markets.
Silver prices can move due to a wide range of factors. Geopolitical instability or fears of a deep recession can make Silver price escalate due to its safe-haven status, although to a lesser extent than Gold’s. As a yieldless asset, Silver tends to rise with lower interest rates. Its moves also depend on how the US Dollar (USD) behaves as the asset is priced in dollars (XAG/USD). A strong Dollar tends to keep the price of Silver at bay, whereas a weaker Dollar is likely to propel prices up. Other factors such as investment demand, mining supply – Silver is much more abundant than Gold – and recycling rates can also affect prices.
Silver is widely used in industry, particularly in sectors such as electronics or solar energy, as it has one of the highest electric conductivity of all metals – more than Copper and Gold. A surge in demand can increase prices, while a decline tends to lower them. Dynamics in the US, Chinese and Indian economies can also contribute to price swings: for the US and particularly China, their big industrial sectors use Silver in various processes; in India, consumers’ demand for the precious metal for jewellery also plays a key role in setting prices.
Silver prices tend to follow Gold’s moves. When Gold prices rise, Silver typically follows suit, as their status as safe-haven assets is similar. The Gold/Silver ratio, which shows the number of ounces of Silver needed to equal the value of one ounce of Gold, may help to determine the relative valuation between both metals. Some investors may consider a high ratio as an indicator that Silver is undervalued, or Gold is overvalued. On the contrary, a low ratio might suggest that Gold is undervalued relative to Silver.
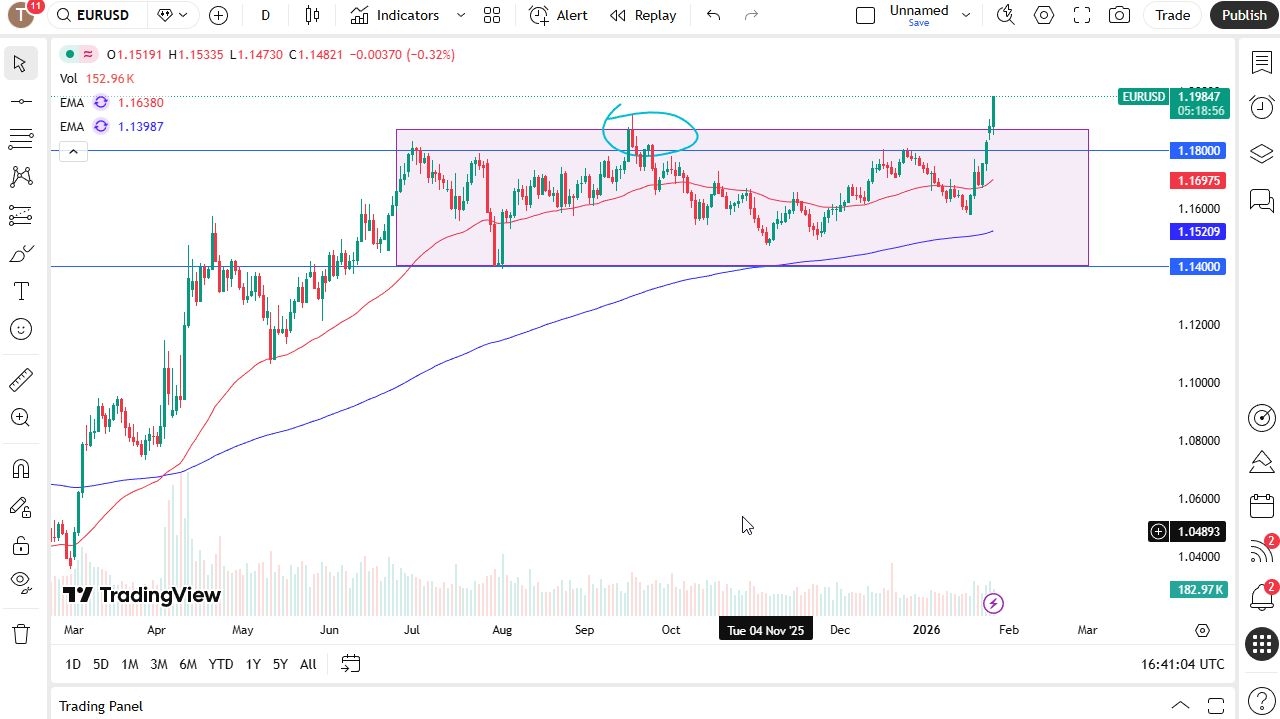
The Euro has finally made a decision to break out. However, the one problem is that it did it the day before a FOMC press conference. Still a bullish look though.
The Euro has actually done something for once. This is a pair that as an analyst it is very painful to cover at times because it has a history of doing a lot of nothing, jumping for a few weeks, and then doing more nothing. That being said, we have broken above an area on the EUR/USD currency pair that I have had circled since about September 17. This was when Jerome Powell’s press conference really rattled the market. Well, we are above there now, which is a very good sign for the Euro.
When you take the technical analysis from the consolidation area, it is 450 pips, give or take a few. That suggests that we could go to the 1.23 level. So I look at this and I realize that it is an area that has mattered more than once. This is an area that has been a significant top multiple times going back about a decade, and then you can see that there is action all the way back to 2015, and even 2012 and 2010. In other words, it is an area that the market likes.
I think that might be where we head because technical analysis suggests that, momentum suggests that, but I don’t think we have all clear quite yet. Quite frankly, we have a press conference after the FOMC decision on Wednesday and Jerome Powell could really throw a monkey wrench into this not even meaning to. If he starts talking about sticky inflation, that has people pushing back the time frame of Federal Reserve cuts even further.
So, we will have to see how that plays out. I think a pullback towards the 1.18 level or maybe 1.1850 offers a bit of an opportunity, but you have to see the bounce first. Again, it wouldn’t surprise me for this pair to go to 1.23. We have probably seen it 10 to 12 times in my career, so it is a familiar level.
Ready to trade our EUR/USD analysis and predictions? Here are the best European brokers to choose from.
Christopher Lewis has been trading Forex and has over 20 years experience in financial markets. Chris has been a regular contributor to Daily Forex since the early days of the site. He writes about Forex for several online publications, including FX Empire, Investing.com, and his own site, aptly named The Trader Guy. Chris favours technical analysis methods to identify his trades and likes to trade equity indices and commodities as well as Forex. He favours a longer-term trading style, and his trades often last for days or weeks.
Jan 28, 2026
IndexBox has just published a new report: United Kingdom – Coffee (Green) – Market Analysis, Forecast, Size, Trends and Insights.
The UK green coffee market saw a significant contraction in consumption and imports in 2024, with consumption falling to 120K tons and imports to 146K tons. However, exports surged by 34% to 26K tons. Brazil remains the dominant import source, while Germany, France, and Belgium are the top export destinations. The market value is forecast to grow at a CAGR of +1.6% to $588M by 2035, despite a modest volume CAGR of +0.2%. Import and export prices rose sharply in 2024, indicating changing market dynamics.
Key Findings
Driven by rising demand for green coffee in the UK, the market is expected to start an upward consumption trend over the next decade. The performance of the market is forecast to increase slightly, with an anticipated CAGR of +0.2% for the period from 2024 to 2035, which is projected to bring the market volume to 123K tons by the end of 2035.
In value terms, the market is forecast to increase with an anticipated CAGR of +1.6% for the period from 2024 to 2035, which is projected to bring the market value to $588M (in nominal wholesale prices) by the end of 2035.
In 2024, the amount of coffee (green) consumed in the UK fell rapidly to 120K tons, reducing by -15.1% compared with 2023. In general, consumption saw a slight setback. As a result, consumption reached the peak volume of 182K tons. From 2019 to 2024, the growth of the consumption failed to regain momentum.
The revenue of the green coffee market in the UK reduced to $496M in 2024, dropping by -7.2% against the previous year. This figure reflects the total revenues of producers and importers (excluding logistics costs, retail marketing costs, and retailers’ margins, which will be included in the final consumer price). Over the period under review, consumption, however, recorded a relatively flat trend pattern. As a result, consumption attained the peak level of $586M. From 2023 to 2024, the growth of the market remained at a somewhat lower figure.
In 2024, imports of coffee (green) into the UK fell to 146K tons, waning by -9.2% on 2023 figures. In general, imports, however, showed a relatively flat trend pattern. The most prominent rate of growth was recorded in 2018 with an increase of 66%. As a result, imports reached the peak of 193K tons. From 2019 to 2024, the growth of imports remained at a somewhat lower figure.
In value terms, green coffee imports rose slightly to $654M in 2024. Over the period under review, total imports indicated a perceptible increase from 2013 to 2024: its value increased at an average annual rate of +3.3% over the last eleven-year period. The trend pattern, however, indicated some noticeable fluctuations being recorded throughout the analyzed period. Based on 2024 figures, imports decreased by -8.4% against 2022 indices. The pace of growth appeared the most rapid in 2022 with an increase of 57%. As a result, imports reached the peak of $714M. From 2023 to 2024, the growth of imports remained at a somewhat lower figure.
In 2024, Brazil (65K tons) constituted the largest green coffee supplier to the UK, accounting for a 44% share of total imports. Moreover, green coffee imports from Brazil exceeded the figures recorded by the second-largest supplier, Vietnam (25K tons), threefold. The third position in this ranking was taken by Colombia (11K tons), with a 7.4% share.
From 2013 to 2024, the average annual growth rate of volume from Brazil stood at +6.9%. The remaining supplying countries recorded the following average annual rates of imports growth: Vietnam (-4.0% per year) and Colombia (-4.7% per year).
In value terms, Brazil ($258M) constituted the largest supplier of coffee (green) to the UK, comprising 39% of total imports. The second position in the ranking was held by Vietnam ($96M), with a 15% share of total imports. It was followed by Colombia, with a 9.2% share.
From 2013 to 2024, the average annual rate of growth in terms of value from Brazil stood at +8.7%. The remaining supplying countries recorded the following average annual rates of imports growth: Vietnam (+0.5% per year) and Colombia (-0.9% per year).
In 2024, the average green coffee import price amounted to $4,482 per ton, increasing by 14% against the previous year. In general, import price indicated a pronounced increase from 2013 to 2024: its price increased at an average annual rate of +3.2% over the last eleven-year period. The trend pattern, however, indicated some noticeable fluctuations being recorded throughout the analyzed period. Based on 2024 figures, green coffee import price increased by +69.5% against 2019 indices. The growth pace was the most rapid in 2017 an increase of 45% against the previous year. The import price peaked in 2024 and is likely to see steady growth in years to come.
Average prices varied somewhat amongst the major supplying countries. In 2024, amid the top importers, the countries with the highest prices were Ethiopia ($5,774 per ton) and Colombia ($5,584 per ton), while the price for Vietnam ($3,864 per ton) and Indonesia ($3,952 per ton) were amongst the lowest.
From 2013 to 2024, the most notable rate of growth in terms of prices was attained by Vietnam (+4.7%), while the prices for the other major suppliers experienced more modest paces of growth.
In 2024, approx. 26K tons of coffee (green) were exported from the UK; growing by 34% on the previous year. Overall, exports posted a resilient expansion. The most prominent rate of growth was recorded in 2022 with an increase of 101% against the previous year. The exports peaked in 2024 and are expected to retain growth in the near future.
In value terms, green coffee exports skyrocketed to $122M in 2024. Over the period under review, exports posted a buoyant increase. As a result, the exports reached the peak and are likely to continue growth in the immediate term.
Germany (6.5K tons), France (6K tons) and Belgium (3.2K tons) were the main destinations of green coffee exports from the UK, together comprising 60% of total exports.
From 2013 to 2024, the most notable rate of growth in terms of shipments, amongst the main countries of destination, was attained by Belgium (with a CAGR of +65.3%), while the other leaders experienced more modest paces of growth.
In value terms, Germany ($29M), France ($25M) and Belgium ($15M) constituted the largest markets for green coffee exported from the UK worldwide, with a combined 56% share of total exports.
Belgium, with a CAGR of +59.4%, saw the highest rates of growth with regard to the value of exports, among the main countries of destination over the period under review, while shipments for the other leaders experienced more modest paces of growth.
In 2024, the average green coffee export price amounted to $4,718 per ton, with an increase of 59% against the previous year. Over the period under review, the export price recorded a relatively flat trend pattern. The export price peaked at $5,684 per ton in 2014; however, from 2015 to 2024, the export prices failed to regain momentum.
There were significant differences in the average prices for the major external markets. In 2024, amid the top suppliers, the country with the highest price was Poland ($14,865 per ton), while the average price for exports to Italy ($3,837 per ton) was amongst the lowest.
From 2013 to 2024, the most notable rate of growth in terms of prices was recorded for supplies to Poland (+10.0%), while the prices for the other major destinations experienced more modest paces of growth.
This report provides a comprehensive view of the green coffee industry in the United Kingdom, tracking demand, supply, and trade flows across the national value chain. It explains how demand across key channels and end-use segments shapes consumption patterns, while also mapping the role of input availability, production efficiency, and regulatory standards on supply.
Beyond headline metrics, the study benchmarks prices, margins, and trade routes so you can see where value is created and how it moves between domestic suppliers and international partners. The analysis is designed to support strategic planning, market entry, portfolio prioritization, and risk management in the green coffee landscape in the United Kingdom.
The report combines market sizing with trade intelligence and price analytics for the United Kingdom. It covers both historical performance and the forward outlook to 2035, allowing you to compare cycles, structural shifts, and policy impacts.
This report provides a consistent view of market size, trade balance, prices, and per-capita indicators for the United Kingdom. The profile highlights demand structure and trade position, enabling benchmarking against regional and global peers.
The analysis is built on a multi-source framework that combines official statistics, trade records, company disclosures, and expert validation. Data are standardized, reconciled, and cross-checked to ensure consistency across time series.
All data are normalized to a common product definition and mapped to a consistent set of codes. This ensures that comparisons across time are aligned and actionable.
The forecast horizon extends to 2035 and is based on a structured model that links green coffee demand and supply to macroeconomic indicators, trade patterns, and sector-specific drivers. The model captures both cyclical and structural factors and reflects known policy and technology shifts in the United Kingdom.
Each projection is built from national historical patterns and the broader regional context, allowing the report to show where growth is concentrated and where risks are elevated.
Prices are analyzed in detail, including export and import unit values, regional spreads, and changes in trade costs. The report highlights how seasonality, freight rates, exchange rates, and supply disruptions influence pricing and margins.
Key producers, exporters, and distributors are profiled with a focus on their operational scale, geographic footprint, product mix, and market positioning. This helps identify competitive pressure points, partnership opportunities, and routes to differentiation.
This report is designed for manufacturers, distributors, importers, wholesalers, investors, and advisors who need a clear, data-driven picture of green coffee dynamics in the United Kingdom.
The market size aggregates consumption and trade data, presented in both value and volume terms.
The projections combine historical trends with macroeconomic indicators, trade dynamics, and sector-specific drivers.
Yes, it includes export and import unit values, regional spreads, and a pricing outlook to 2035.
The report benchmarks market size, trade balance, prices, and per-capita indicators for the United Kingdom.
Yes, it highlights demand hotspots, trade routes, pricing trends, and competitive context.


.webp "United Kingdom’s Green Coffee Market Forecast Shows Modest 1.6% CAGR Value Growth Amid Shifting Trade Patterns – News and Statistics")