The main category of All News Articles.
You can use the search box below to find what you need.
[wd_asp id=1]
The main category of All News Articles.
You can use the search box below to find what you need.
[wd_asp id=1]
Later on Monday, Japanese economic indicators are likely to fuel speculation about an April Bank of Japan rate hike. According to the preliminary report, the Leading Economic Index (LEI) increased from 109.8 in October to 110.5 in November, suggesting a pickup in economic momentum.
An upward revision to the preliminary number would raise expectations of an April BoJ rate hike, boosting buying interest in the yen. The stronger yen would push USD/JPY lower.
Traders should pay close attention to LEI trends. A higher reading suggests improving business investment, rising employment, and higher wages. Importantly, stronger wage growth would increase households’ purchasing power, fueling spending and demand-driven inflation.
An upward trend in consumption and inflation would align with the BoJ’s upward revisions to inflation in its quarterly outlook report, supporting a more hawkish BoJ rate path.
Rising bets on BoJ rate hikes and Fed rate cuts reaffirm the bearish medium- to longer-term price projections.
While the yen gets government support, US economic data will influence the appetite for the US Dollar. Durable goods orders, the Chicago Fed National Activity Index, and the Dallas Fed Manufacturing Index will be in focus. However, durable goods order trends are likely to garner more attention, given that the Index gives insight into business and consumer spending.
Economists expect durable goods orders to rise 0.5% month-on-month in November after sliding 2.2% in October. A higher-than-expected reading would indicate a pickup in manufacturing sector activity, bolstering the US economy. However, the numbers may have limited influence on Fed rate-cut bets, given that the manufacturing sector accounts for just 20% of US GDP.
Traders should closely monitor FOMC members’ speeches, which will likely have more influence on sentiment toward an H1 2026 Fed rate cut and USD/JPY trends.
For USD/JPY price trends, traders should consider technicals and closely follow central bank and political headlines.
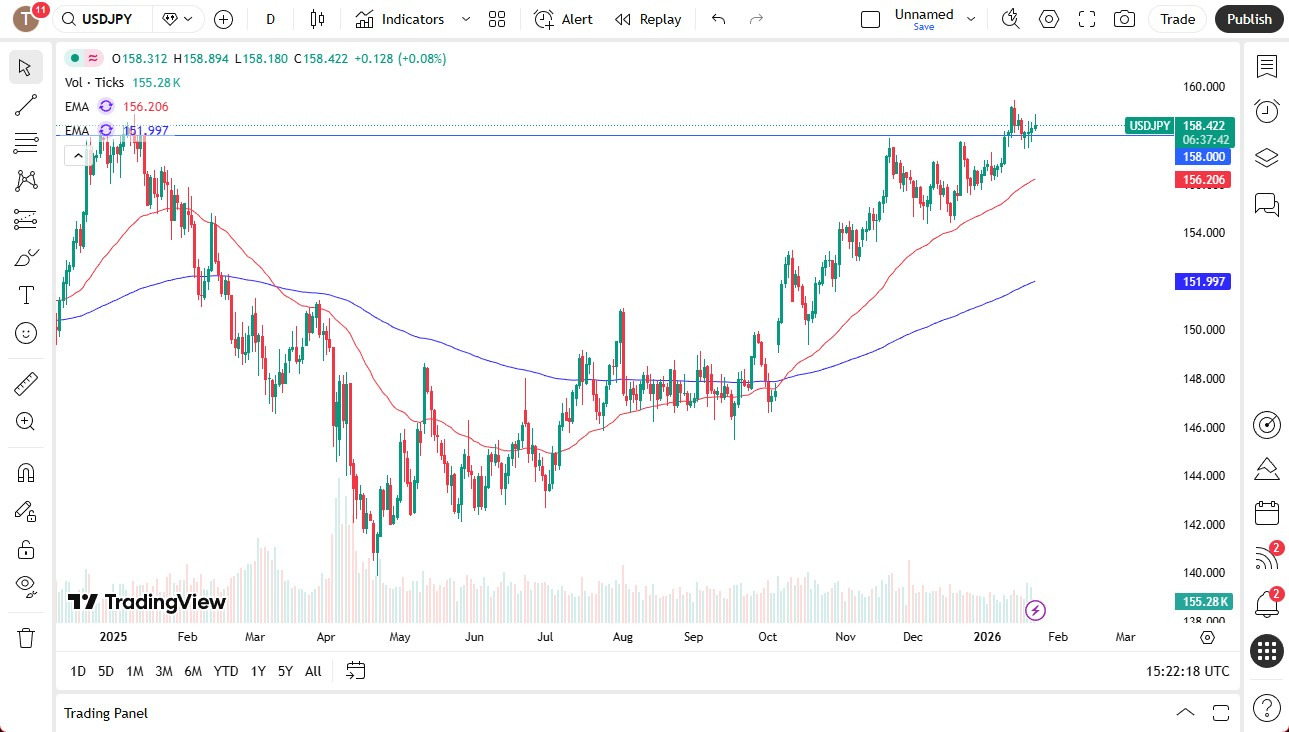
On the daily chart, USD/JPY trades below its 50-day Exponential Moving Average (EMA), but above the 200-day EMA. The EMAs signaled a near-term bearish trend reversal, aligning with the negative outlook for USD/JPY. Constructive yen fundamentals have aligned with the near-term technicals.
A sustained drop below the 155 support level would expose the 200-day EMA. If breached, 150 would be the next key support level.
Crucially, a sustained fall through the EMAs would reaffirm the bearish short- to medium-term price outlook.
I wrote on the 11th January that the best trades for the week would be:
Overall, these trades gave a gain of 1.36% (0.27% per asset).

A summary of last week’s most important data that caused any surprise or uncertainty in the market:
Last week’s data had very limited impact. It is likely that continuing geopolitical tensions between the USA and Iran, following the USA’s successful abduction of President Maduro of Venezuela, had more impact last week than any of the above items, excepting the Bank of Japan’s threat to intervene by buying Yen.
The USA has continued to send military assets towards Iran and build up what look like preparations for a war. The internet remains blocked in Iran, but limited information emerging from medical sources suggest that far more than the officially admitted 3,500 killings have taken place, and continue to take place, with some estimates placing the civilian death toll as high as 80,000. What does seem clear is that the regime is determined to survive and is willing to kill unarmed protestors in significant numbers to do so.
President Trump continues to hint at helping and protecting the protestors. Most neighboring countries are publicly opposed to any US military action in support of the protestors, and it remains unclear exactly what the US could do to improve the situation by military action. There is also concern that Iran could launch a pre-emptive strike, with reports that China has airlifted a significant amount of advanced military equipment to Iran in recent days.
In addition to Iran, we also saw President Trump continue to express a desire to acquire Greenland, severely straining ties between the USA and the EU. Although Trump ruled out using force, his behaviour towards the EU and by extension NATO is extremely disrespectful.
Strong geopolitical tension has helped the astonishing rise of Gold and especially Silver to continue over the past week, with Silver reaching a new record high above $103 and Gold ending the week very close to $5,000, also at a fresh all-time high price. These precious metals have seen incredible gains, with Silver doubling in price within just a few weeks. Platinum also rose strongly over the week to close at a new record high price.
These factors have also shaken the US Dollar, whose sharp drop last week seems to have nothing to do with the Fed at all, even though the Fed will be holding a policy meeting this week.
On a final note, President Trump over the weekend began to threaten Canada with a new 100% tariff over its potential trade deal with China. If implemented, this could cause turbulence for the greenback and serious turbulence for the Canadian Dollar as well.
The coming week’s most important data points, in order of likely importance, are:
Although there are not a lot of data items, the first few are highly important for the Forex market, so it could be an important week. Monday is a public holiday in Australia.
Currency Price Changes and Interest Rates
For the month of January 2026, I forecasted that the USD/JPY currency pair would rise in value.

January 2026 Monthly Forecast Performance to Date
Two weeks ago, I made no forecast, as there were no recent excessive moves in currency crosses. However, last week saw three crosses with excessive volatility, so I made the following weekly forecast this week:
The Australian and New Zealand Dollars were the strongest major currency last week, while the US Dollar was the weakest. Directional volatility rose significantly last week, with 67% of all major pairs and crosses changing in value by more than 1%. This is the most volatility we have seen in the Forex market since April 2025.
Next week’s volatility is likely to remain relatively high.
You can trade these forecasts in a real or demo Forex brokerage account.
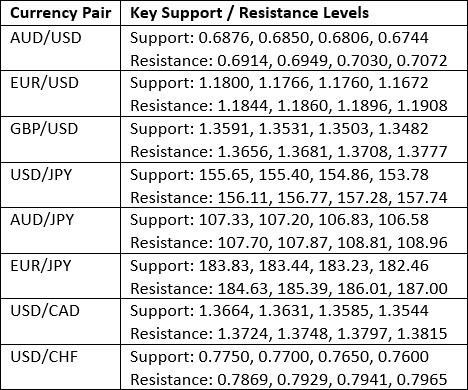
Key Support and Resistance Levels
Last week, the US Dollar Index printed an unusually large bearish candlestick which closed right on its low. This was the largest bearish candlestick since April 2025, and lowest weekly close since June 2025. These are very bearish signs. The price action suggests a long-term bearish trend with the price below its levels of both 13 and 26 weeks ago. However, it is worth noting that the lows made last autumn and in the summer remain intact below the current price.
The slightly stronger than expected US economic data released last week helped firm up the Dollar, as it has given a slightly hawkish tilt against rate cut expectations in 2026, although two rate cuts of 0.25% are still widely seen as likely to happen.
I take a weakly bullish bias on the US Dollar right now and am comfortable being long of the greenback.
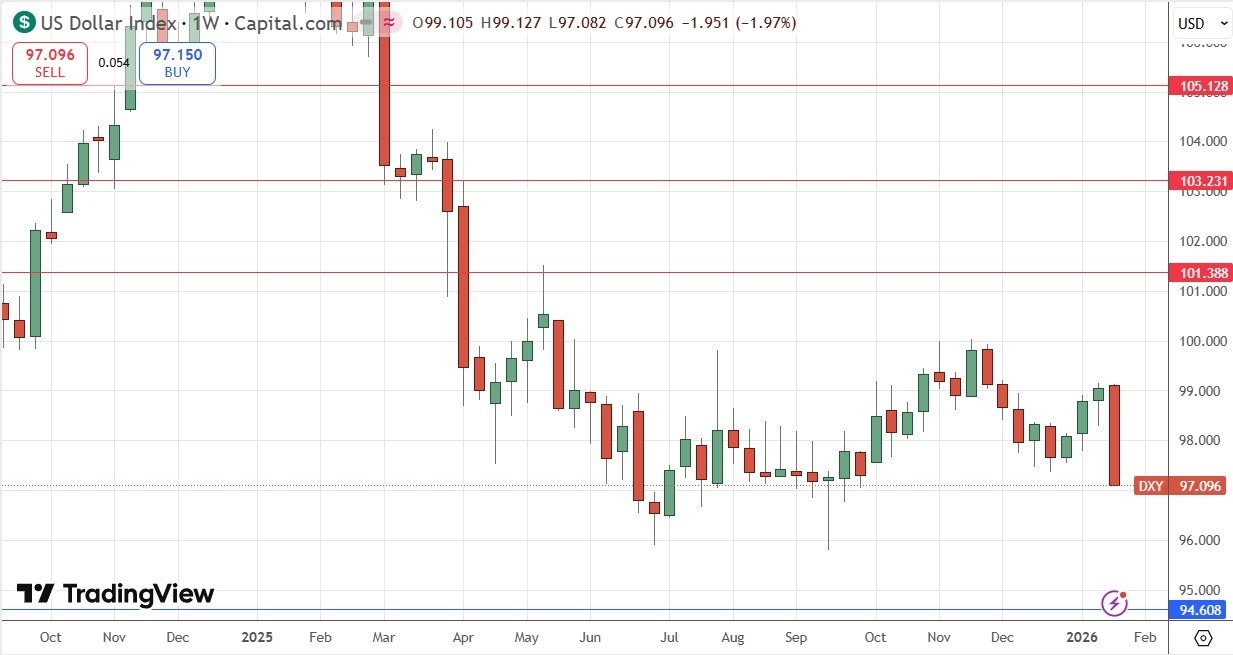
US Dollar Index Weekly Price Chart
The AUD/USD currency pair advanced very strongly last week, powering up with unusually high volatility to a new 15-month high.
The price closed very near its high, which is another bullish sign.
There is a long-term bullish trend here which has been in force for about 9 months.
There is also a fundamental reason for the Australian Dollar’s strength – it is practically the only major currency except the US Dollar where there is a credible belief that its central bank is going to raise interest rates soon.
This move high is probably a bit over-extended, but I think that after an orderly bearish pullback, we could see a good opportunity for a long swing trade on the bounce.
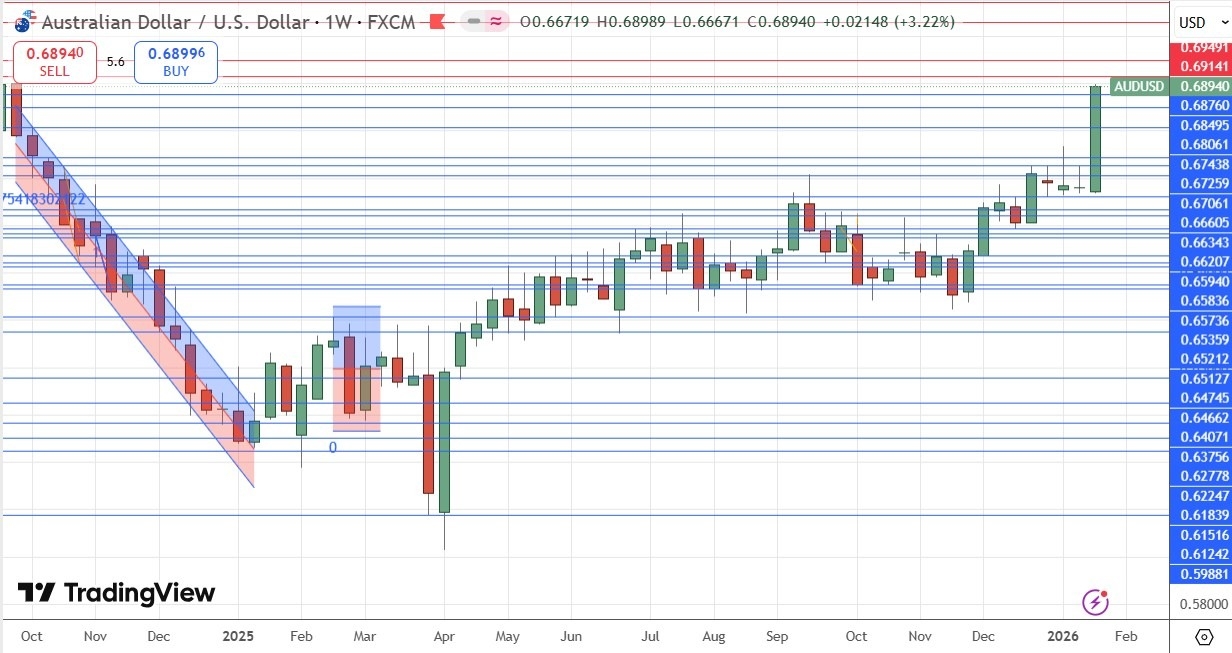
AUD/USD Weekly Price Chart
The EUR/USD currency pair has been range-bound, trading sideways on low volatility, for many months now. Last week, it suddenly jumped, as the US Dollar made its strongest fall in almost 9 months.
The price closed right on the high of the week’s range, which is a bullish sign.
Despite these bullish signs, a few months ago there was a strong inflection point which closed at $1.1866, and this has not yet been tested. I would like to see bulls overcome this price level before going long.
This currency pair has a good propensity to trend, but with deep and frequent retracements.
So, I think this pair is worth keeping an eye on with a potential long trade entry, but I am not ready to enter just yet.
I will take a long trade if we get a daily (New York) close above $1.1866.
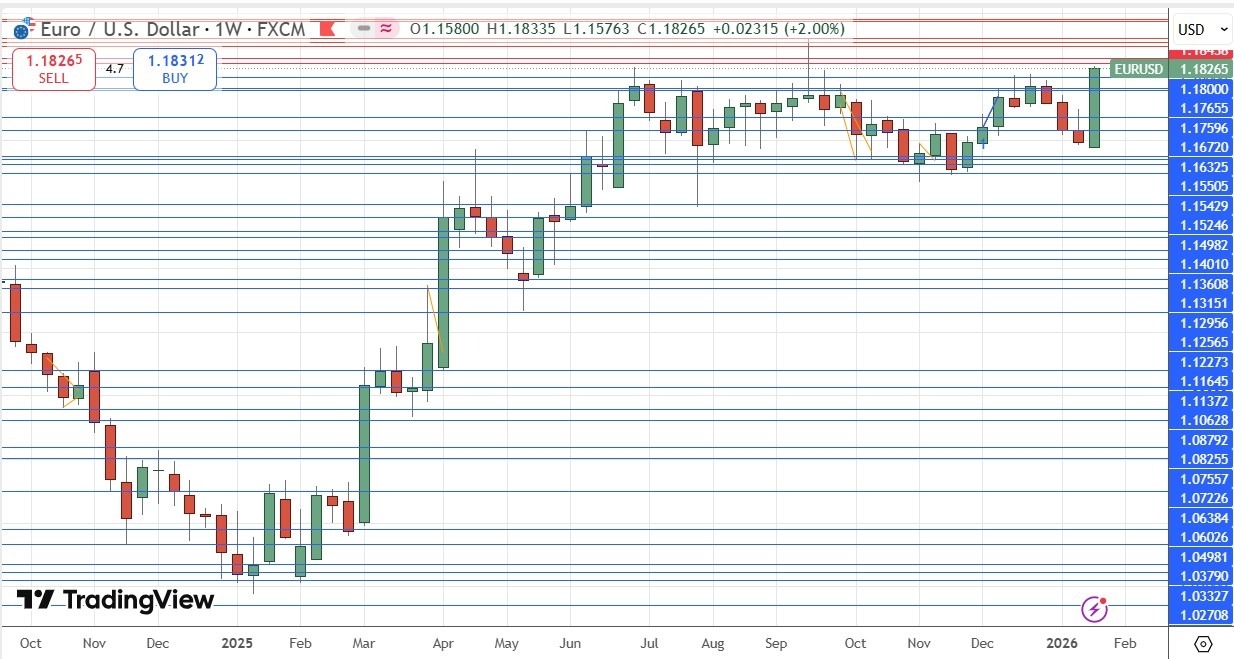
EUR/USD Daily Price Chart
Silver is still showing very high volatility, and it rose like crazy over the week, reaching and breaching the magic round number at $100. This is a very big deal. It closed right on its high, and its sister precious metal Gold also rose strongly. These are very bullish signs. Just look at the weekly price chart below!
I had thought that we would see major profit-taking at $100 but this does not seem to have happened at all.
If you are not long already, you might have missed the party, but there is no reason why this metal won’t go substantially higher, possibly even to $125.
I think it makes sense to think about getting long here, but with a smaller than usual position size.
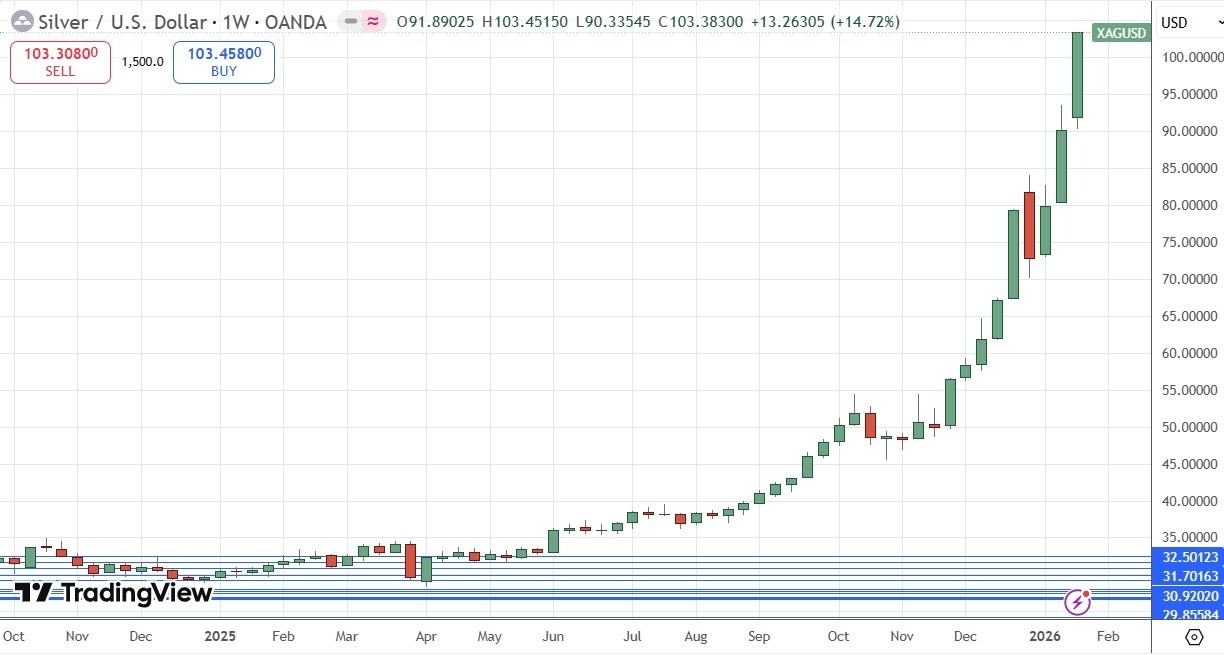
Silver Weekly Price Chart
Gold saw a strong rise last week, as did all other precious metals, notably Silver. Gold ended the week right on its high after making its strongest weekly gain in many months. Although these seem to be bullish factors, there might be some fear that this large candlestick could be a pre-exhaustion peak. My suspicion here is enhanced by the fact that the price stopped just short of the huge round number at $5,000.
Still, we are seeing record high prices in Gold, Silver, and Platinum, and extremely powerful bullish momentum, especially here in Silver.
I am prepared to enter another long trade if we do get a new record high daily (New York) closing price above $5,000.
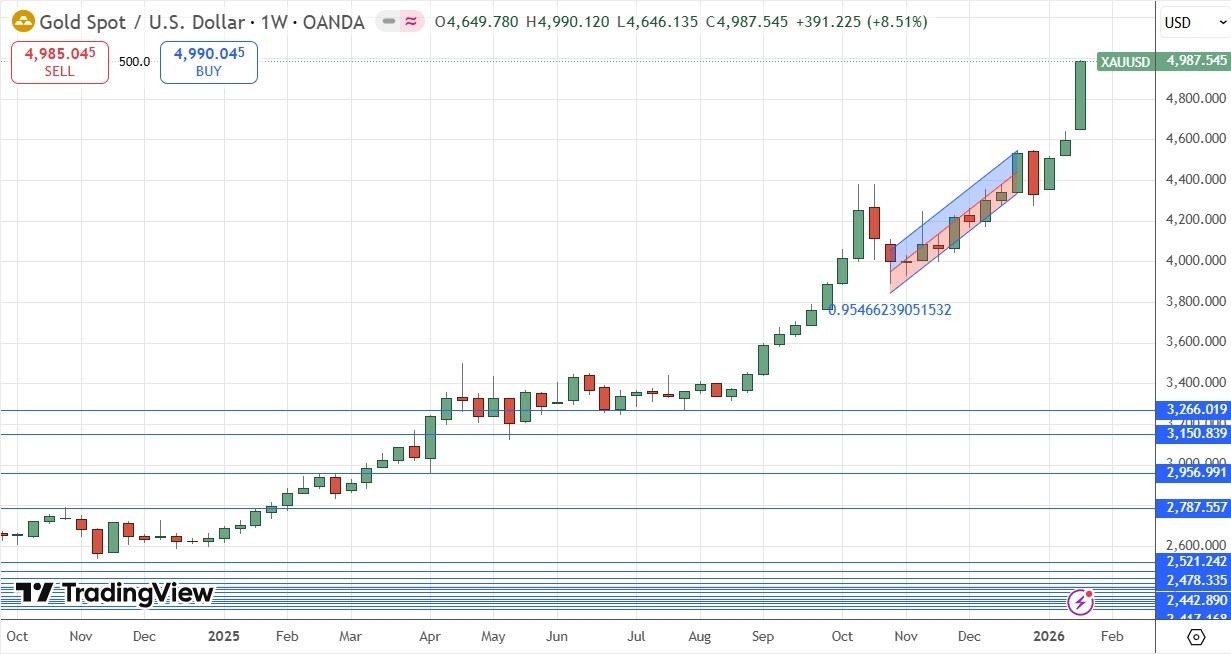
Gold Daily Price Chart
I see the best trades this week as:
Ready to trade our Forex weekly forecast? Check out our list of the top 10 Forex brokers in the world.
Silver (XAG/USD) hit a fresh all-time high at $99.39 earlier on Friday, before pulling back to levels around $98.25 at the time of writing. The precious metal has met resistance right ahead of the 100.00 psychological level, yet with downside attempts limited amid US Dollar’s (USD) weakness.
The US Dollar Index is on track for its worst weekly performance since June, as Trump’s obsession with Greenland boosted tensions with the US’s main trading partner, eroding the image of the US as a global leader as well as the status of the USD and a reserve currency.
XAG/USD maintains its bullish tone intact with technical indicators pointing higher. The Moving Average Convergence Divergence (MACD) line stands above zero and has extended higher, suggesting strengthening bullish momentum, while the Relative Strength Index (RSI) remains at levels consistent with a firm bullish trend.
The pair found sellers at the 127.2% Fiboinacci extension of the January 8-12 rally, at the 99.50 area, which, together with the mentioned $100.00 level, is likely challenge bulls. Further up, the target is the 161.8% extension of the same range, at 106.38.
On the downside, immediate support is seen at the previous record high of $95.90, ahead of the 100-period SMA, now art $92.60, and the January 21 low, at $90.40.
(The technical analysis of this story was written with the help of an AI tool.)
Silver is a precious metal highly traded among investors. It has been historically used as a store of value and a medium of exchange. Although less popular than Gold, traders may turn to Silver to diversify their investment portfolio, for its intrinsic value or as a potential hedge during high-inflation periods. Investors can buy physical Silver, in coins or in bars, or trade it through vehicles such as Exchange Traded Funds, which track its price on international markets.
Silver prices can move due to a wide range of factors. Geopolitical instability or fears of a deep recession can make Silver price escalate due to its safe-haven status, although to a lesser extent than Gold’s. As a yieldless asset, Silver tends to rise with lower interest rates. Its moves also depend on how the US Dollar (USD) behaves as the asset is priced in dollars (XAG/USD). A strong Dollar tends to keep the price of Silver at bay, whereas a weaker Dollar is likely to propel prices up. Other factors such as investment demand, mining supply – Silver is much more abundant than Gold – and recycling rates can also affect prices.
Silver is widely used in industry, particularly in sectors such as electronics or solar energy, as it has one of the highest electric conductivity of all metals – more than Copper and Gold. A surge in demand can increase prices, while a decline tends to lower them. Dynamics in the US, Chinese and Indian economies can also contribute to price swings: for the US and particularly China, their big industrial sectors use Silver in various processes; in India, consumers’ demand for the precious metal for jewellery also plays a key role in setting prices.
Silver prices tend to follow Gold’s moves. When Gold prices rise, Silver typically follows suit, as their status as safe-haven assets is similar. The Gold/Silver ratio, which shows the number of ounces of Silver needed to equal the value of one ounce of Gold, may help to determine the relative valuation between both metals. Some investors may consider a high ratio as an indicator that Silver is undervalued, or Gold is overvalued. On the contrary, a low ratio might suggest that Gold is undervalued relative to Silver.
GBPUSD ended last week with sterling fundamentals improving, but price action still leaned heavily on USD headline risk and US rate expectations.
In the UK, inflation re-accelerated as CPI rose 3.4% YoY in December (from 3.2%), which typically reduces the market’s confidence in rapid BoE easing and helped GBP on the day by lifting front-end UK yields. Activity and demand data also surprised positively: UK retail sales rose 0.4% MoM in December (versus expectations for a fall), adding to signs of a pickup and supporting sterling sentiment, even if the FX follow-through was at times modest.
–Are you interested in learning more about ETF brokers? Check our detailed guide-
The UK flash PMI set added to the constructive tone by signalling continued expansion in private-sector activity, reinforcing the idea that the UK economy is not rolling over into the BoE’s subsequent decisions.
On the US side, “good” data didn’t translate into a stronger dollar because geopolitics dominated. The US economy’s momentum was confirmed as Q3 2025 GDP was revised up to a 4.4% annualized pace, and business surveys stayed expansionary with the S&P Global flash PMIs showing manufacturing at 51.9 and composite at 52.8 in January.
At the same time, tensions between the US and Europe over Greenland added to volatility in the risk premium. Trump said he would impose 10% tariffs on eight European countries under pressure from Greenland. Later, he also said that a “framework” had been talked about after meeting with NATO Secretary General Mark Rutte. Denmark and Greenland both stated that their sovereignty is not negotiable. That mix made the markets jumpy and hurt steady demand for the USD.
In the next week, there won’t be any big UK releases, so the tape will lead. So, GBPUSD should mostly trade like a Fed-week USD cross, reacting to changes in US yield expectations and any new geopolitical or tariff news.
If the Fed is hawkish, the USD can be stronger than the improving data pulse of the GBP. Conversely, if the Fed stays balanced and yields fall, the GBP can hold up better than its peers, given last week’s hotter CPI and stronger activity signals.
–Are you interested in learning more about South African forex brokers? Check our detailed guide-
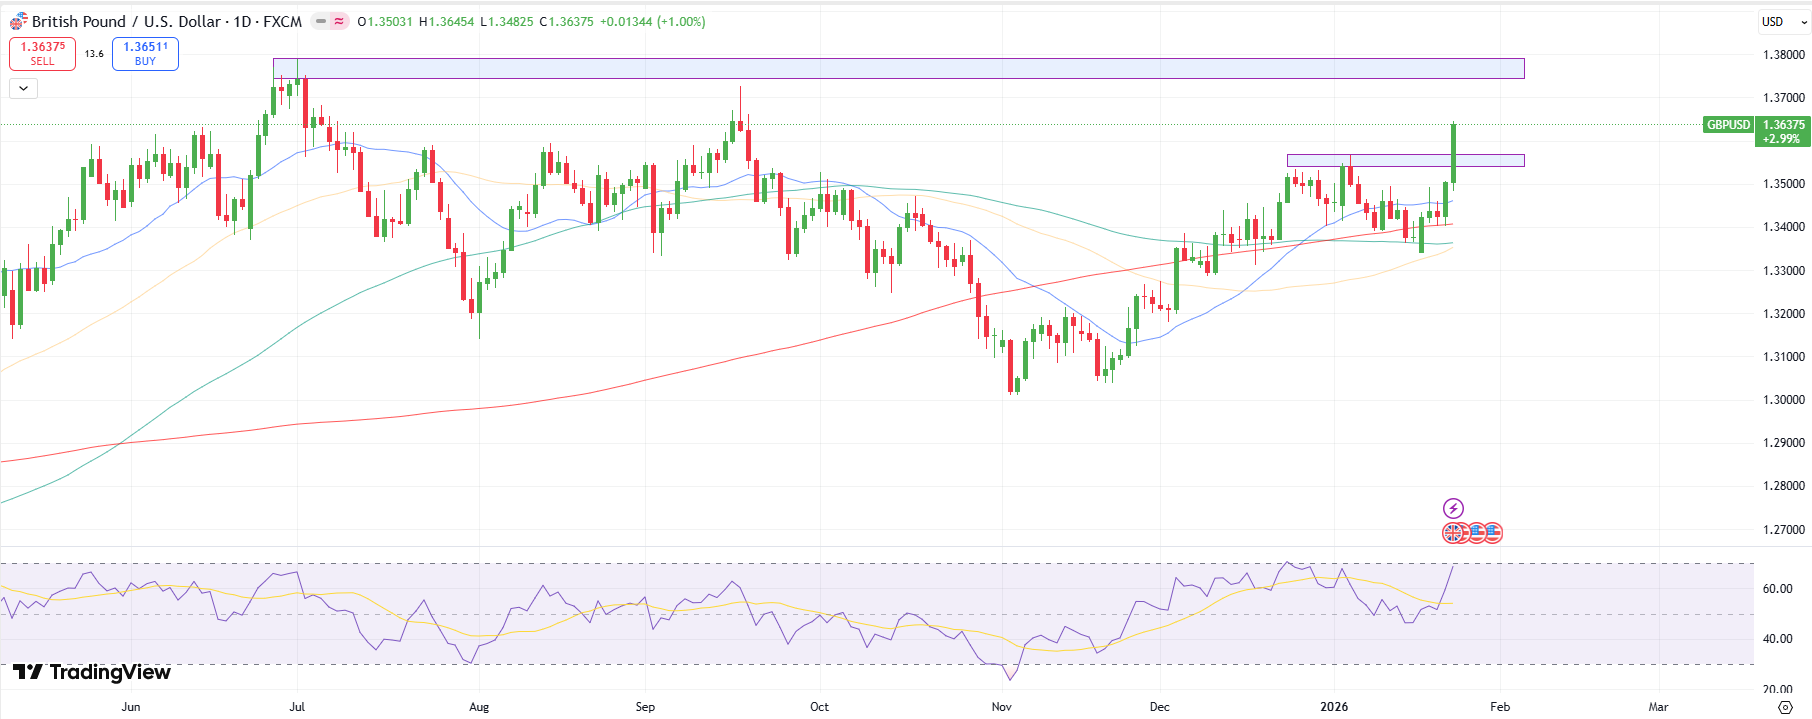
The GBPUSD daily chart shows a strong bullish candle piercing the 1.3565 resistance level, followed by the 1.3600 psychological mark. However, the RSI approaching the overbought region indicates a potential pullback to the 1.3565 area before an upside continuation.
The upside target for the pair lies at 1.3700, ahead of 1.3750. On the downside, if the price breaks and stays below the 1.3565 level could gather further selling pressure and drag towards 1.3500.
Looking to trade forex now? Invest at eToro!
68% of retail investor accounts lose money when trading CFDs with this provider. You should consider whether you can afford to take the high risk of losing your money.
The CHFJPY succeeded in resuming the bullish trend, taking advantage of its repeated stability within the bullish channel’s levels that appears in the above image, to surpass 198.80 then targeting new historical stations by reaching 200.90 directly.
The continuation of providing bullish momentum will provide a chance for resuming the bullish attack in the near period, to expect reaching 202.15 level to form initial extra target in the current trading, where surpassing it will push the price to reach the bullish channel’s resistance at 206.65.
The expected trading range for today is between 199.35 and 2202.15
Trend forecast: Bullish
The US dollar rallied against the Japanese yen on Thursday as we continue to see a lot of back-and-forth trading, but focus on the interest rate differential. We did give back some of the gains, and that makes a certain amount of sense as well, due to the fact that Friday is possibly going to be a volatile session as the Bank of Japan continues to see a lot of questions asked about its interest rate policy.
It will, in fact, give its latest update on its interest rate policy. The change is expected to be nothing, but the statement will be where people pay the most attention to. If they sound particularly dovish, that could send the US dollar much higher against the Japanese yen, and I think we would tag the 160 yen level.
A pullback at this point in time probably sees support near the 156.20 level, where the 50-day EMA is hanging around. I do expect a lot of volatility, and I do think dips will offer buying opportunities unless, of course, the Bank of Japan does something completely unexpected like hike aggressively.
I don’t think that’s going to be the case; quite frankly, they have too much debt to do that. Expect volatility, a lot of noisy behavior, and at this point, be cautious about selling into negativity.
I think that negativity, if you are patient enough, will offer a nice opportunity to continue to add to a position that, quite frankly, has paid you quite well since the middle of April. Of course, you get paid at the end of every day, right along with that.
Want to trade our USD/JPY forex analysis and predictions? Here’s a list of forex brokers in Japan to check out.
Christopher Lewis has been trading Forex and has over 20 years experience in financial markets. Chris has been a regular contributor to Daily Forex since the early days of the site. He writes about Forex for several online publications, including FX Empire, Investing.com, and his own site, aptly named The Trader Guy. Chris favours technical analysis methods to identify his trades and likes to trade equity indices and commodities as well as Forex. He favours a longer-term trading style, and his trades often last for days or weeks.
One key driver of the commodity’s price is likely to be a mid-year decision from the US administration on refined copper tariffs, writes Goldman Sachs Research analyst Eoin Dinsmore. Buyers have been stockpiling copper in the US in advance of the expected import tax, creating expectations of temporary scarcity outside of the US.
“We do not expect the price above $13,000 to be sustained,” Dinsmore writes.
Why have copper prices risen so fast?
Goldman Sachs Research cites three themes as contributing to the recent run-up in prices. For one, copper buyers significantly increased their requests in December to take metal from LME warehouses, confirming the tightness in markets outside the US. The second theme was the anticipation of strong artificial intelligence (AI)-related demand from the construction of data centers, which use copper in cooling and power distribution.
There was also a narrative in markets that US policymaking for the economy was meant to “run it hot,” as copper and riskier assets rallied in the new year. While Goldman Sachs Research expects growth in consumption of US semi-finished copper products, our analysts don’t anticipate this to have a material impact on global demand growth since the US only accounts for 7% of the market.
How copper could be impacted by tariff uncertainty
Goldman Sachs Research’s copper forecast is based on the expectation that the Trump administration will announce a 15% tariff on refined copper by mid-2026. But there’s uncertainty around that outcome as affordability remains a key focus in the lead up to US mid-term elections which could cause the tariff decision to be delayed.
For now, uncertainty surrounding the US refined copper tariff is supporting the LME copper price as US stockpiles of the metals continue to rise. Goldman Sachs Research expects this to result in a decline in stocks elsewhere in 2026, therefore keeping a floor under prices over the coming months. A definitive tariff decision in mid-2026 should signal the end of US stockpiling, allowing the price to move lower.
But if the tariff announcement itself is delayed until 2027, that could be bearish for copper prices as the probability of a tariff reduces and focus shifts back to the well-supplied global market. The recent Critical Minerals Section 232 decision suggests that the Trump Administration is no longer solely relying on tariffs to enhance US security of supply in metals.
In the short term, the speculative peak in copper prices could still be ahead. Speculative positioning in the futures market is already at a record high, but the level of long positions as a share of total open interest on the Chicago Mercantile Exchange is not as extreme as prior speculative peaks.
“We are very likely in the late stages of this rally, but US economic growth, AI spending, and US stockpiling will likely remain supportive in the coming months,” Dinsmore writes.
The global copper surplus
Once the tariff uncertainty has passed, investors are likely to focus once again on the market’s underlying fundamentals, including a large overhang of global supply. The global copper market recorded a 600 kilotonne (kt) surplus in 2025, the largest absolute surplus since 2009, and inventory outside of the US is now rising, despite continued US stockpiling.
High prices are likely to dampen demand growth and lift scrap supply this year, and this expectation leads our researchers to boost their global surplus forecast for 2026 to 300 kt from a previous outlook for 160 kt.
They note that China’s consumption of refined copper has weakened materially, and that the pullback in Chinese demand is more acute than in 2024, when a “China buyers strike” ended the rally that year. They also reduced their forecast for US stockpiling in 2026 from 750 kt to 600 kt due to less attractive import arbitrage opportunities.
On a fundamental basis, Goldman Sachs Research estimates that copper’s fair price is around $11,500 per tonne, close to their price forecast of $11,200 per tonne for the fourth quarter of 2026.
“We feel that the price has overshot its fair fundamental level,” Dinsmore concludes. A clear decision on US refined copper tariffs should serve as a “catalyst for a correction.”
– Written by
Ben Hughes
STORY LINK Pound Sterling to Dollar Forecast: GBP/USD Tests Upper Ranges
The Pound-to-Dollar exchange rate (GBP/USD) has pushed to 1.3535, as foreign exchange analysts at ING and MUFG argue that confidence in US policymaking has not fully recovered, keeping the risk of renewed “Sell America” flows alive despite calmer headlines.
The Pound to Dollar (GBP/USD) exchange rate has been held in relatively narrow ranges and trading around 1.3440 after again finding support near 1.34 with Pound support from a boost to risk appetite offset by a firmer dollar.
According to UoB; “we continue to expect range-trading today, most likely between 1.3400 and 1.3460.”
Given major global pressure points, it is dangerous to assume that narrow ranges will prevail.
According to ING; “Some downside risks for the dollar persist: more volatility in JGBs spilling into Treasuries, scrutiny on upcoming US tech earnings, reignition in geopolitical/tariff risk. But the macro picture should favour a bit more dollar strength in the coming days, in our view.”
Risk appetite secured an initial boost on Wednesday following President Trump’s comments that he would not use force to secure a deal on Greenland.
Get better rates and lower fees on your next international money transfer.
Compare TorFX with top UK banks in seconds and see how much you could save.
There was a further boost to confidence after the European close after Trump stated that a deal on Greenland had been reached with NATO Secretary-General Rutte and that the threatened tariffs on eight European countries from February 1st would not go ahead.
Markets were concerned that US threats would trigger selling in US bonds and equities which would hurt the dollar. With the immediate threat easing, there was a rebound in the dollar.
Commerzbank forex strategist Volkmar Baur commented; “From a European perspective, it is too early to rejoice.”
He added; “However, the most likely outcome is still that the next wave of excitement will pass us by after a brief period of volatility and that the market will refocus on central banks and interest rate differentials.”
ING considers that attention will turn towards the Federal Reserve policy decision next week.
According to the bank; “We discussed last week how Powell’s fierce response to the criminal investigation signalled upside risks to the dollar, as he and other members could have turned more hawkish in a meeting without any rate change to reinforce the independence message.”
The Supreme Court also held a hearing on the US Administration case to dismiss Fed Governor Cook. The initial signs are that the court is not mindful to back Trump due to the threat to Fed independence.

MUFG still sees dollar risks, but added; “The loss of confidence in US policymaking is likely to remain a headwind for the US dollar as we have seen at the start of this year. However, the risk of a sharper US dollar sell-off has diminished after President Trump’s quick climb down over Greenland, and early indications from the Supreme Court overnight that they are likely to rule against President Trump’s decision to fire Fed Governor Lisa Cook.”
International Money Transfer? Ask our resident FX expert a money transfer question or try John’s new, free, no-obligation personal service! ,where he helps every step of the way,
ensuring you get the best exchange rates on your currency requirements.
TAGS: Pound Dollar Forecasts
Natural gas price continued forming strong bullish waves since yesterday, to notice achieving the suggested targets by reaching $4.00 level, to reach the support of the broken bullish channel’s support, which represents a key resistance.
Noticing that stochastic begins to exit the oversold level, attempting to provide a new bullish momentum, to increase the chances of surpassing the current resistance, and its stability above this level will confirm its readiness to record new gains by its rally towards $4.185, while the failure to breach it will support the dominance of the sideways bias in the current trading, and there is a chance to retest $3.620 level before reaching extra bullish target.
The expected trading range for today is between $3.780 and $4.185
Trend forecast: Bullish
Important DisclaimersFXEmpire is owned and operated by Empire Media Network LTD., Company Registration Number 514641786, registered at 7 Jabotinsky Road, Ramat Gan 5252007, Israel. The content provided on this website includes general news and publications, our personal analysis and opinions, and materials provided by third parties. This content is intended for educational and research purposes only. It does not constitute, and should not be interpreted as, a recommendation or advice to take any action, including making any investment or purchasing any product. Before making any financial decision, you should conduct your own due diligence, exercise your own discretion, and consult with competent advisors. The content on this website is not personally directed to you, and we do not take into account your individual financial situation or needs. The information contained on this website is not necessarily provided in real time, nor is it guaranteed to be accurate. Prices displayed may be provided by market makers and not by exchanges. Any trading or other financial decision you make is entirely your own responsibility, and you must not rely solely on any information provided through the website. FXEmpire does not provide any warranty regarding the accuracy, completeness, or reliability of any information contained on the website and shall bear no responsibility for any trading losses you may incur as a result of using such information. The website may include advertisements and other promotional content. FXEmpire may receive compensation from third parties in connection with such content. FXEmpire does not endorse, recommend, or assume responsibility for the use of any third-party services or websites. Empire Media Network LTD., its employees, officers, subsidiaries, and affiliates shall not be liable for any loss or damage resulting from your use of the website or reliance on the information provided herein.Risk DisclaimersThis website contains information about cryptocurrencies, contracts for difference (CFDs), and other financial instruments, as well as about brokers, exchanges, and other entities trading in such instruments. Both cryptocurrencies and CFDs are complex instruments and involve a high risk of losing money. You should carefully consider whether you understand how these instruments work and whether you can afford to take the high risk of losing your money. FX Empire encourages you to conduct your own research before making any investment decision and to avoid investing in any financial instrument unless you fully understand how it works and the risks involved.