The main category of All News Articles.
You can use the search box below to find what you need.
[wd_asp id=1]
The main category of All News Articles.
You can use the search box below to find what you need.
[wd_asp id=1]
– Written by
David Woodsmith
STORY LINK GBP/USD Forecast: Pound Sterling Near Six-Month Best Exchange Rate
The Pound to US Dollar exchange rate (GBP/USD) opened the new week on strong footing, pushing to a fresh six-month high as broad-based selling pressure continued to undermine the US Dollar.
At the time of writing, GBP/USD was trading close to $1.3671, representing a gain of around 0.3% compared with Monday’s opening levels.
The US Dollar (USD) remained on the back foot at the start of the week, extending a sell-off that dragged the currency to multi-month lows in the previous session.
Fresh pressure on the Greenback followed renewed tariff threats from US President Donald Trump, who warned of imposing 100% tariffs on Canada should it strike a trade agreement with China. Trump argued such a deal would effectively turn Canada into a gateway for Chinese goods entering the US market.
These remarks have heightened investor unease around US trade and foreign policy, with markets increasingly unsettled by the unpredictability of the Trump administration.
Adding to the negative tone for the Dollar were renewed concerns over a potential US government shutdown, after Senate Democrats pledged to block funding for the Department of Homeland Security following the death of another US citizen at the hands of federal agents over the weekend.
Despite its strength against the US Dollar, the Pound (GBP) struggled to generate notable gains against other major currencies.
Get better rates and lower fees on your next international money transfer.
Compare TorFX with top UK banks in seconds and see how much you could save.
Sterling traded in a relatively narrow range amid a quiet UK economic calendar, following a week packed with high-profile data releases.
Investor caution was also fuelled by lingering domestic political uncertainty, with speculation over internal Labour Party tensions weighing on broader confidence in the UK outlook.
Looking ahead, attention is likely to centre on the anticipated announcement of Donald Trump’s nominee to succeed Jerome Powell as Chair of the Federal Reserve, a development that could drive significant volatility in GBP/USD.
Should the chosen candidate be viewed as supportive of more aggressive interest rate cuts, the US Dollar may face renewed selling pressure.
Conversely, a nomination perceived as safeguarding Federal Reserve independence could help the Greenback recover some of its recent losses.
In the meantime, with little in the way of major UK data releases scheduled, movement in the Pound is expected to remain closely tied to global risk appetite and broader market dynamics.

International Money Transfer? Ask our resident FX expert a money transfer question or try John’s new, free, no-obligation personal service! ,where he helps every step of the way,
ensuring you get the best exchange rates on your currency requirements.
TAGS: Pound Dollar Forecasts
Important DisclaimersFXEmpire is owned and operated by Empire Media Network LTD., Company Registration Number 514641786, registered at 7 Jabotinsky Road, Ramat Gan 5252007, Israel. The content provided on this website includes general news and publications, our personal analysis and opinions, and materials provided by third parties. This content is intended for educational and research purposes only. It does not constitute, and should not be interpreted as, a recommendation or advice to take any action, including making any investment or purchasing any product. Before making any financial decision, you should conduct your own due diligence, exercise your own discretion, and consult with competent advisors. The content on this website is not personally directed to you, and we do not take into account your individual financial situation or needs. The information contained on this website is not necessarily provided in real time, nor is it guaranteed to be accurate. Prices displayed may be provided by market makers and not by exchanges. Any trading or other financial decision you make is entirely your own responsibility, and you must not rely solely on any information provided through the website. FXEmpire does not provide any warranty regarding the accuracy, completeness, or reliability of any information contained on the website and shall bear no responsibility for any trading losses you may incur as a result of using such information. The website may include advertisements and other promotional content. FXEmpire may receive compensation from third parties in connection with such content. FXEmpire does not endorse, recommend, or assume responsibility for the use of any third-party services or websites. Empire Media Network LTD., its employees, officers, subsidiaries, and affiliates shall not be liable for any loss or damage resulting from your use of the website or reliance on the information provided herein.Risk DisclaimersThis website contains information about cryptocurrencies, contracts for difference (CFDs), and other financial instruments, as well as about brokers, exchanges, and other entities trading in such instruments. Both cryptocurrencies and CFDs are complex instruments and involve a high risk of losing money. You should carefully consider whether you understand how these instruments work and whether you can afford to take the high risk of losing your money. FX Empire encourages you to conduct your own research before making any investment decision and to avoid investing in any financial instrument unless you fully understand how it works and the risks involved.
Important DisclaimersFXEmpire is owned and operated by Empire Media Network LTD., Company Registration Number 514641786, registered at 7 Jabotinsky Road, Ramat Gan 5252007, Israel. The content provided on this website includes general news and publications, our personal analysis and opinions, and materials provided by third parties. This content is intended for educational and research purposes only. It does not constitute, and should not be interpreted as, a recommendation or advice to take any action, including making any investment or purchasing any product. Before making any financial decision, you should conduct your own due diligence, exercise your own discretion, and consult with competent advisors. The content on this website is not personally directed to you, and we do not take into account your individual financial situation or needs. The information contained on this website is not necessarily provided in real time, nor is it guaranteed to be accurate. Prices displayed may be provided by market makers and not by exchanges. Any trading or other financial decision you make is entirely your own responsibility, and you must not rely solely on any information provided through the website. FXEmpire does not provide any warranty regarding the accuracy, completeness, or reliability of any information contained on the website and shall bear no responsibility for any trading losses you may incur as a result of using such information. The website may include advertisements and other promotional content. FXEmpire may receive compensation from third parties in connection with such content. FXEmpire does not endorse, recommend, or assume responsibility for the use of any third-party services or websites. Empire Media Network LTD., its employees, officers, subsidiaries, and affiliates shall not be liable for any loss or damage resulting from your use of the website or reliance on the information provided herein.Risk DisclaimersThis website contains information about cryptocurrencies, contracts for difference (CFDs), and other financial instruments, as well as about brokers, exchanges, and other entities trading in such instruments. Both cryptocurrencies and CFDs are complex instruments and involve a high risk of losing money. You should carefully consider whether you understand how these instruments work and whether you can afford to take the high risk of losing your money. FX Empire encourages you to conduct your own research before making any investment decision and to avoid investing in any financial instrument unless you fully understand how it works and the risks involved.
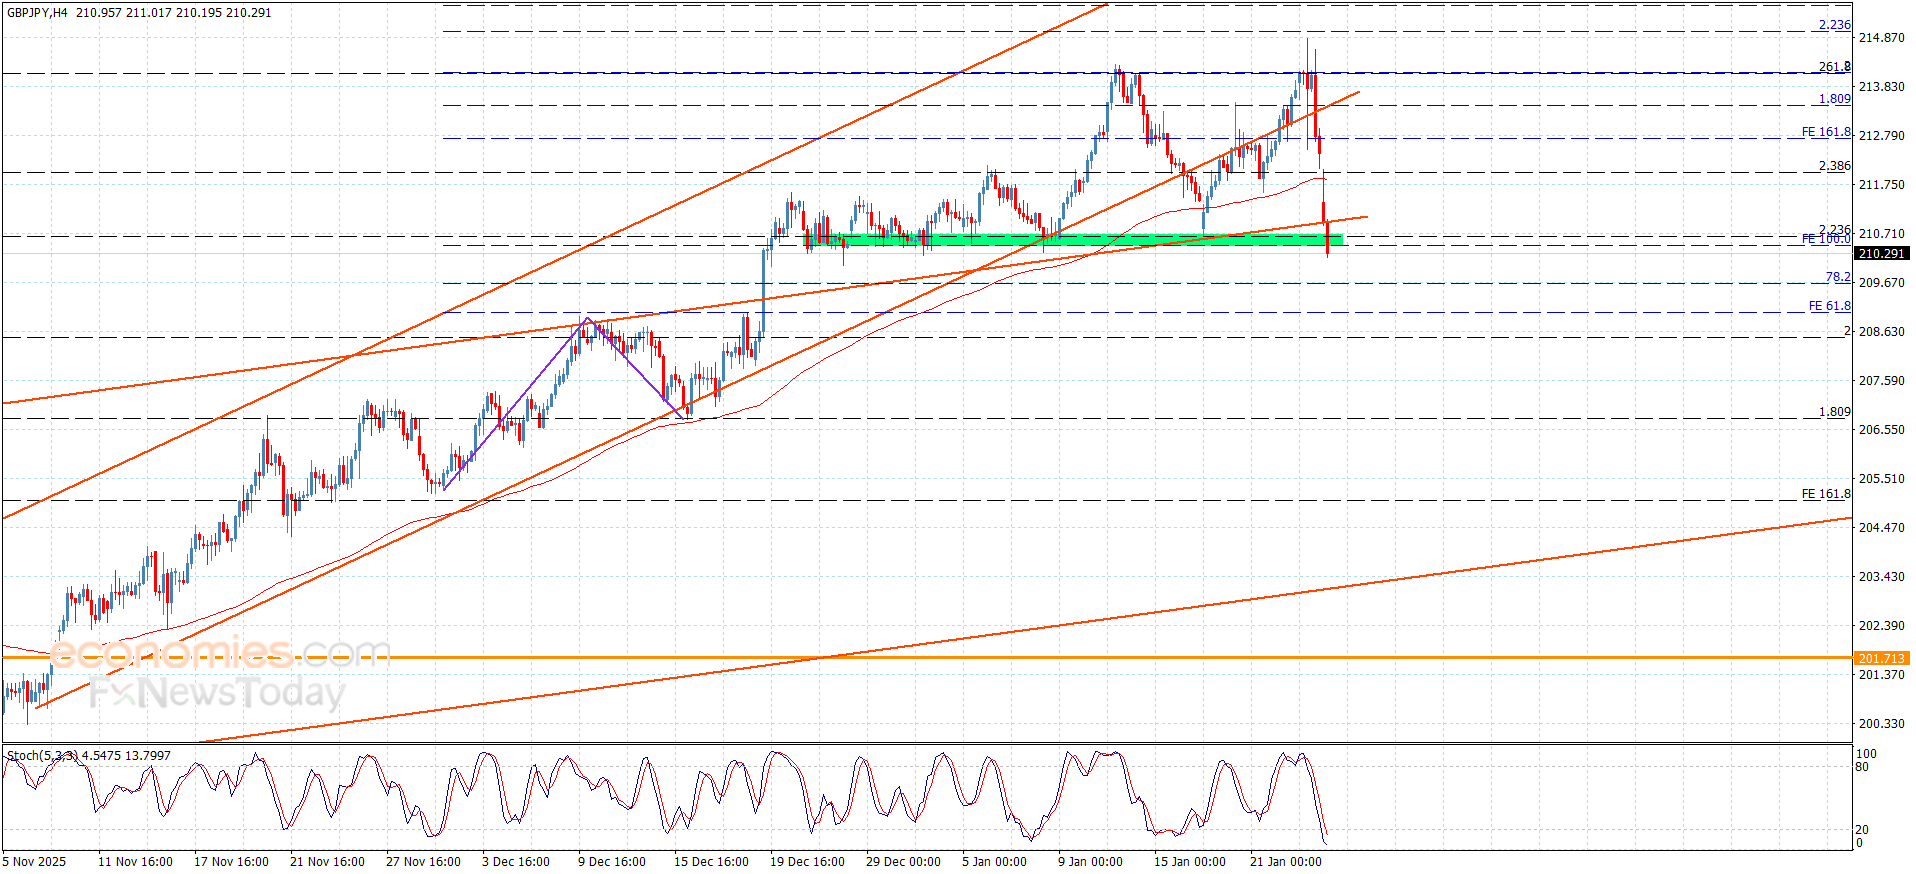
The GBPJPY pair approached from the main target at 215.00 level, forming strong barrier against the attempt of resuming the bullish attack, to force it form strong corrective decline, to resume forming bearish price gap this morning, to settle below the bullish channel’s support at 210.95 level.
The stability below the broken support and providing bearish momentum by the main indicators will confirm the dominance of the bearish bias, to expect suffering extra losses by reaching 209.65 followed by %200 Fibonacci extension level at 208.50.
The expected trading range for today is between 209.65 and 210.80
Trend forecast: Bearish by the stability of 211.00
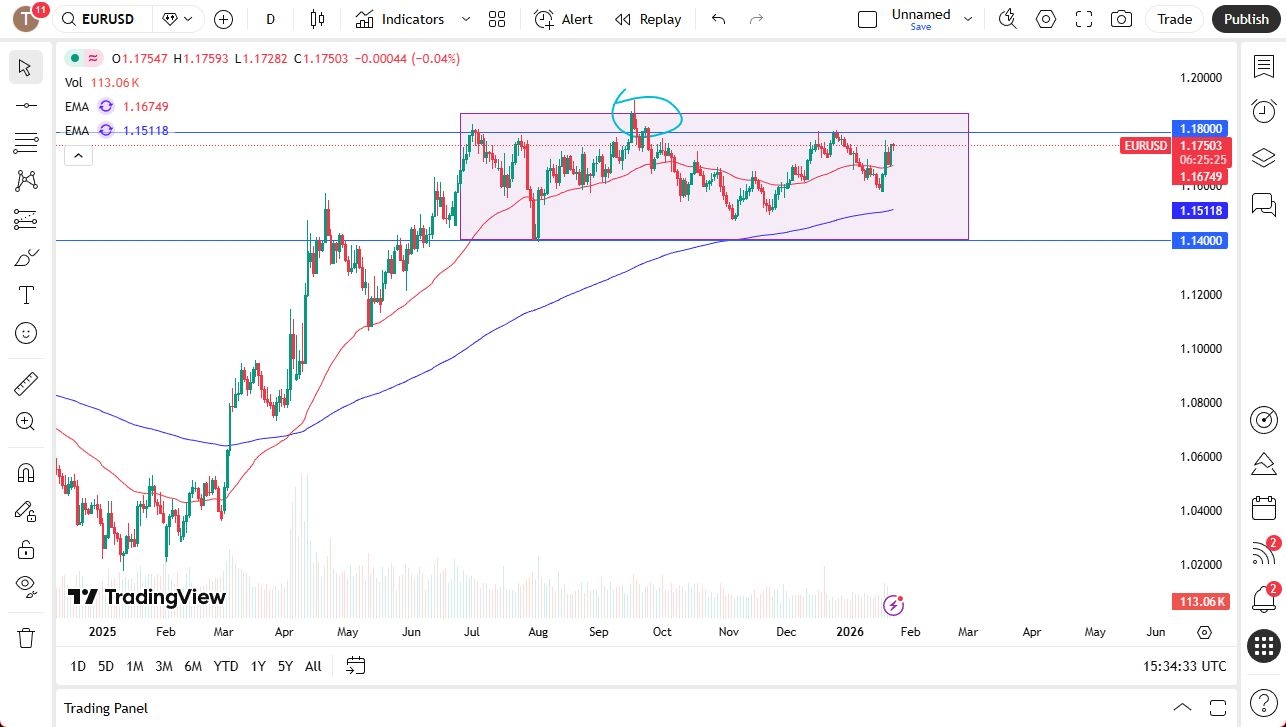
The Euro was grinding just a touch higher after initially falling on Friday due to the overall US dollar weakness rather than any intrinsic Euro strength. The primary driver at the moment is heightened political risk in the US, specifically the volatility surrounding the recent tariff threats around Greenland.
But this is just a momentary blip on the radar, and the question now is where these currencies deserve to be. On one hand, we have seen the dollar get punished, and money flew into places like gold and, by default, the Euro. That being said, there is immediate resistance just above the 1.18 level and then again at the 1.1850 level, and I think it’s going to be very difficult to break above there as it has shown multiple times in the past.
Because of this, I anticipate that this sets up for a shorting opportunity early in the week next week, as Friday has shown a real lack of momentum or, quite frankly, interest at this point in time. With that being the case, I think the overall range remains from 1.14 on the bottom to 1.1850 on the top.

The 50-day EMA has provided short-term support between those two levels over the last couple of days and currently sits at the 1.1675 level. Ultimately, I think this is a market that doesn’t really have anywhere to be anytime soon, although it’s clear that the bullish behavior is fairly resilient. But the question now is, as we rise towards the major resistance barrier, is there anything to make it break out? As things stand right now, it.
Ready to trade our EUR/USD analysis and predictions? Here are the best European brokers to choose from.
Christopher Lewis has been trading Forex and has over 20 years experience in financial markets. Chris has been a regular contributor to Daily Forex since the early days of the site. He writes about Forex for several online publications, including FX Empire, Investing.com, and his own site, aptly named The Trader Guy. Chris favours technical analysis methods to identify his trades and likes to trade equity indices and commodities as well as Forex. He favours a longer-term trading style, and his trades often last for days or weeks.
Silver (XAG/USD) prolongs its recent well-established uptrend and continues scaling new all-time peaks for the third straight day, rising to the 109.45 region on Monday. The white metal sticks to bullish bias through the early European session and currently trades around mid-$108.00s, up nearly 6% for the day.
Last week’s breakout through the $96.00 horizontal barrier and a subsequent move beyond the $100 psychological mark were seen as key triggers for the XAG/USD bulls. Moreover, the ascending channel from $70.60 supports the uptrend, and the upper boundary at $107.13 has been breached, signaling an extension of the advance.
The Moving Average Convergence Divergence (MACD) line extends above the Signal line and holds in positive territory, and the widening histogram suggests strengthening bullish momentum. Sustained action above the former channel cap would keep buyers in control, suggesting that the path of least resistance for the XAG/USD is to the upside.
The Relative Strength Index at 83.57 is overbought and still rising, which warns of stretched conditions even as the broader tone stays firm. If momentum cools, pullbacks could find support toward the ascending channel floor near $95.26, while a series of higher lows would preserve the bullish structure and keep the focus on the upside.
(The technical analysis of this story was written with the help of an AI tool.)
Silver is a precious metal highly traded among investors. It has been historically used as a store of value and a medium of exchange. Although less popular than Gold, traders may turn to Silver to diversify their investment portfolio, for its intrinsic value or as a potential hedge during high-inflation periods. Investors can buy physical Silver, in coins or in bars, or trade it through vehicles such as Exchange Traded Funds, which track its price on international markets.
Silver prices can move due to a wide range of factors. Geopolitical instability or fears of a deep recession can make Silver price escalate due to its safe-haven status, although to a lesser extent than Gold’s. As a yieldless asset, Silver tends to rise with lower interest rates. Its moves also depend on how the US Dollar (USD) behaves as the asset is priced in dollars (XAG/USD). A strong Dollar tends to keep the price of Silver at bay, whereas a weaker Dollar is likely to propel prices up. Other factors such as investment demand, mining supply – Silver is much more abundant than Gold – and recycling rates can also affect prices.
Silver is widely used in industry, particularly in sectors such as electronics or solar energy, as it has one of the highest electric conductivity of all metals – more than Copper and Gold. A surge in demand can increase prices, while a decline tends to lower them. Dynamics in the US, Chinese and Indian economies can also contribute to price swings: for the US and particularly China, their big industrial sectors use Silver in various processes; in India, consumers’ demand for the precious metal for jewellery also plays a key role in setting prices.
Silver prices tend to follow Gold’s moves. When Gold prices rise, Silver typically follows suit, as their status as safe-haven assets is similar. The Gold/Silver ratio, which shows the number of ounces of Silver needed to equal the value of one ounce of Gold, may help to determine the relative valuation between both metals. Some investors may consider a high ratio as an indicator that Silver is undervalued, or Gold is overvalued. On the contrary, a low ratio might suggest that Gold is undervalued relative to Silver.
The GBPJPY pair approached from the main target at 215.00 level, forming strong barrier against the attempt of resuming the bullish attack, to force it form strong corrective decline, to resume forming bearish price gap this morning, to settle below the bullish channel’s support at 210.95 level.
The stability below the broken support and providing bearish momentum by the main indicators will confirm the dominance of the bearish bias, to expect suffering extra losses by reaching 209.65 followed by %200 Fibonacci extension level at 208.50.
The expected trading range for today is between 209.65 and 210.80
Trend forecast: Bearish by the stability of 211.00
Gold price (XAU/USD) rises to a fresh record high near $5,045 during the early Asian session on Monday. The precious metal extends its upside amid geopolitical risks and concerns over the US Federal Reserve (Fed).
The first three-way peace talks between Russia, Ukraine, and the US have concluded in Abu Dhabi with no apparent breakthrough, as fighting continues, according to the BBC. Ukrainian President Volodymyr Zelensky proposed a second meeting as early as next week, while a US official said that a fresh round will begin on February 1.
The ongoing conflict between Russia and Ukraine, along with military intervention in Venezuela and threats to annex Greenland, has boosted traditional safe-haven assets such as Gold.
Traders await US President Donald Trump’s pick for the next Fed Chair after Trump said he has finished interviewing candidates. A more dovish chair would increase bets on further interest-rate cuts this year, which could underpin the Gold price. Lower interest rates could reduce the opportunity cost of holding Gold, supporting the non-yielding precious metal.
Gold has played a key role in human’s history as it has been widely used as a store of value and medium of exchange. Currently, apart from its shine and usage for jewelry, the precious metal is widely seen as a safe-haven asset, meaning that it is considered a good investment during turbulent times. Gold is also widely seen as a hedge against inflation and against depreciating currencies as it doesn’t rely on any specific issuer or government.
Central banks are the biggest Gold holders. In their aim to support their currencies in turbulent times, central banks tend to diversify their reserves and buy Gold to improve the perceived strength of the economy and the currency. High Gold reserves can be a source of trust for a country’s solvency. Central banks added 1,136 tonnes of Gold worth around $70 billion to their reserves in 2022, according to data from the World Gold Council. This is the highest yearly purchase since records began. Central banks from emerging economies such as China, India and Turkey are quickly increasing their Gold reserves.
Gold has an inverse correlation with the US Dollar and US Treasuries, which are both major reserve and safe-haven assets. When the Dollar depreciates, Gold tends to rise, enabling investors and central banks to diversify their assets in turbulent times. Gold is also inversely correlated with risk assets. A rally in the stock market tends to weaken Gold price, while sell-offs in riskier markets tend to favor the precious metal.
The price can move due to a wide range of factors. Geopolitical instability or fears of a deep recession can quickly make Gold price escalate due to its safe-haven status. As a yield-less asset, Gold tends to rise with lower interest rates, while higher cost of money usually weighs down on the yellow metal. Still, most moves depend on how the US Dollar (USD) behaves as the asset is priced in dollars (XAU/USD). A strong Dollar tends to keep the price of Gold controlled, whereas a weaker Dollar is likely to push Gold prices up.
The GBPJPY pair approached from the main target at 215.00 level, forming strong barrier against the attempt of resuming the bullish attack, to force it form strong corrective decline, to resume forming bearish price gap this morning, to settle below the bullish channel’s support at 210.95 level.
The stability below the broken support and providing bearish momentum by the main indicators will confirm the dominance of the bearish bias, to expect suffering extra losses by reaching 209.65 followed by %200 Fibonacci extension level at 208.50.
The expected trading range for today is between 209.65 and 210.80
Trend forecast: Bearish by the stability of 211.00
The GBPJPY pair benefited from its stability within the bullish channel’s levels, forming strong bullish rally, achieving the waited target at 214.10, approaching the last peak at 214.30.
Despite the continuation of providing bullish momentum by the main indicators, waiting for surpassing the current peak and providing positive close is important to confirm moving to a new bullish station, to target 215.00 and 215.55.
The expected trading range for today is between 213.45 and 215.00
Trend forecast: Bullish