The main category of All News Articles.
You can use the search box below to find what you need.
[wd_asp id=1]
The main category of All News Articles.
You can use the search box below to find what you need.
[wd_asp id=1]
Cardano price is stabilizing near a key multi-year support zone, with the market watching closely to see whether this area sparks a base formation or leads to the next major directional move.
Cardano price is attempting to recover after an extended corrective phase that has dragged price back towards levels last seen during prior accumulation cycles. Following weeks of steady downside pressure, ADA is now trading near $0.41, an area that several analysts view as structurally important rather than a breakdown zone.
Brave New Coin data shows ADA trading just above the $0.41 handle, with intraday volatility easing after a sharp late-session rebound. While momentum remains muted, the ability to hold this region has shifted attention towards whether Cardano is beginning to form a base or merely pausing before its next directional move.
Cardano price is trading around $0.41, up 0.17% in the last 24 hours. Source: Brave New Coin
A widely followed chart from Ssebi highlights that Cardano price is currently sitting directly on a multi-year ascending trendline that has defined its broader market structure since early cycle lows. This diagonal support has historically acted as a pivot point between prolonged drawdowns and sustained recovery phases.

Cardano price is testing a multi-year ascending trendline, a level that has historically marked the transition between prolonged corrections and sustained recovery phases. Source: Ssebi via X
According to Ssebi, ADA “is holding the multi-year trendline so far,” emphasizing that a strong reaction from this level is required to trigger a meaningful reversal narrative. The chart shows price compressing along this long-term support rather than breaking cleanly below it.
From a structural perspective, this places ADA in a high-importance decision zone, where sustained holding increases the probability of a broader trend shift, while failure would expose deeper historical liquidity pockets.
Adding a shorter-term perspective, Ali Martinez pointed out that the TD Sequential indicator recently flashed a buy signal on Cardano, suggesting downside momentum may be nearing exhaustion.
Martinez’s chart outlines $0.37 as the critical level that must continue to hold. As long as ADA Cardano price remains above this support, his model opens a projected recovery path towards the $0.54 region, which aligns with prior reaction highs and mid-range resistance from earlier this year.
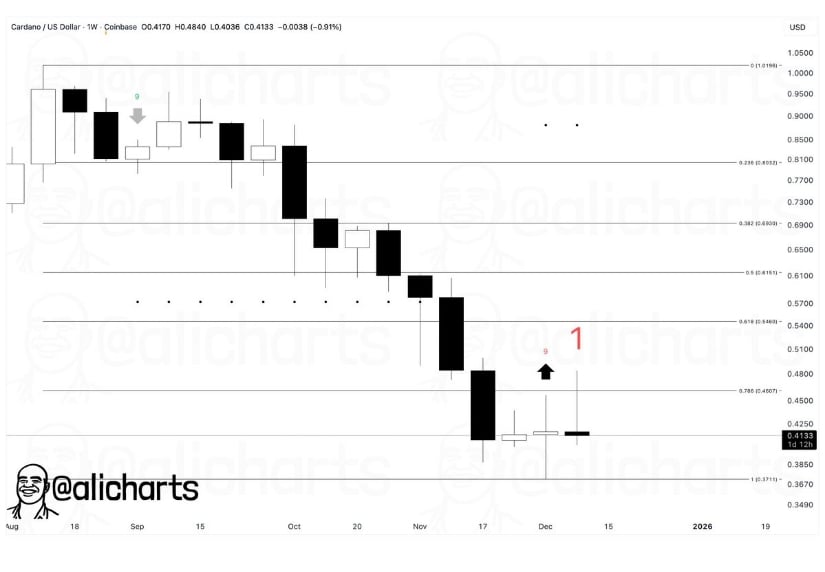
A TD Sequential buy signal has appeared on Cardano, with $0.37 highlighted as the key support that could pave the way for a recovery towards the $0.54 resistance zone. Source: Ali Martinez via X
While TD signals are not guarantees, they often appear near local inflection points, particularly when price is already pressing into historically defended zones. In this context, the signal strengthens the argument that ADA’s current position is more consistent with late-stage selling pressure rather than the start of a fresh breakdown.
From a structure-based outlook, Nehal shared a daily chart showing Cardano price trading inside a well-defined falling channel that has governed price action for several months. The chart focuses on the potential for a channel breakout, which historically increases the probability of a multi-week recovery move.
Nehal’s projected path suggests that if ADA can reclaim the upper boundary of the channel, price could gradually rotate back towards the $0.60–$0.68 zone, where prior volume clusters and resistance shelves reside. This scenario depends on ADA maintaining current support and building higher lows rather than expanding volatility to the downside.
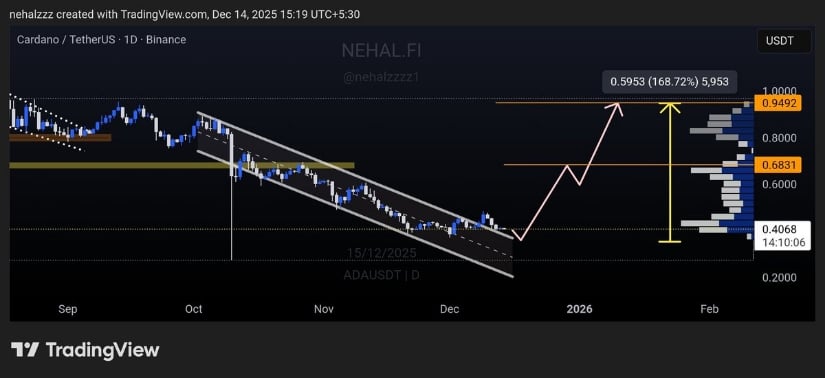
ADA remains confined within a falling channel, with a potential breakout above the upper trendline opening a measured recovery path towards the $0.60–$0.68 resistance zone. Source: Nehal via X
Broader market context is also beginning to favor selective altcoin setups. A recent snapshot shared by Coin Bureau showed Cardano price among assets posting notable volume expansion, even as price action across majors remained mixed.
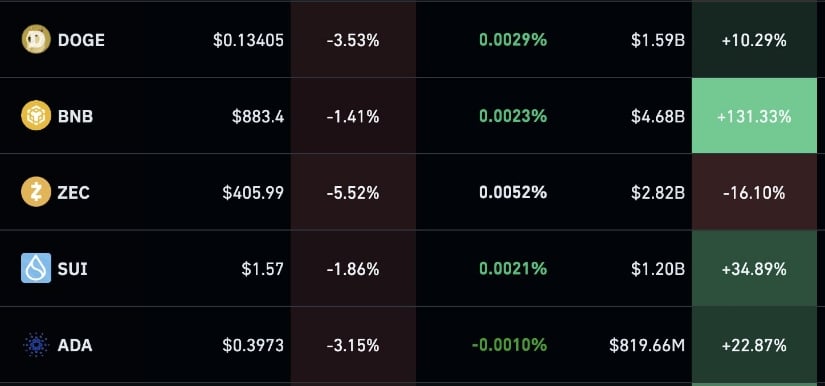
ADA is seeing rising volume during consolidation, a sign of renewed trader interest that often precedes directional expansion when supported by strong historical levels. Source: Coin Bureau via X
While this does not imply an immediate breakout, increasing participation during consolidation phases often precedes directional expansion, particularly when paired with strong historical support levels. For ADA, this reinforces the view that sellers may be losing control, even if buyers have not yet asserted dominance.
From a price prediction standpoint, Cardano price remains range-bound but structurally interesting. As long as $0.37–$0.40 continues to hold, the probability of a recovery towards $0.50–$0.54 remains intact, supported by TD signals, long-term trendline defense, and improving structural alignment across multiple models.
A confirmed break above $0.45 would strengthen the bullish case, opening the door towards higher resistance zones highlighted by Nehal’s channel projections. On the flip side, a decisive loss of the multi-year trendline would invalidate this recovery narrative and shift focus towards deeper levels.
For now, Cardano price prediction models point towards stabilization first, expansion second, with the current zone shaping up as one of the most important areas ADA has traded in over recent months.
Gold (XAU/USD) attracts buyers for the fifth straight day and climbs to the $4,330 region during the Asian session on Monday. The commodity remains well within striking distance of its highest level since October 21, touched on Friday, and seems poised to appreciate further amid a supportive fundamental backdrop. Traders, however, might opt to wait for this week’s important US macro releases, which would shape expectations about the Federal Reserve’s (Fed) rate-cut path and drive demand for the non-yielding yellow metal.
The delayed US Nonfarm Payrolls (NFP) report for October and Retail Sales are scheduled for release on Tuesday, along with the provisional manufacturing and services PMIs. This will be followed by the US consumer inflation figures on Thursday. Apart from this, speeches from influential FOMC members will determine the near-term trajectory for the US Dollar (USD). Investors this week will further take cues from the Bank of England (BoE) rate decision and the European Central Bank (ECB) meeting on Thursday, and the Bank of Japan (BoJ) policy update on Friday. This should provide a fresh directional impetus to the Gold price.
In the meantime, dovish US Federal Reserve (Fed) expectations fail to assist the USD to register any meaningful recovery from a two-month low, touched last Thursday, and continue to underpin the yellow metal. In a widely expected move, the US central bank lowered borrowing costs by 25 basis points (bps) at the end of a two-day policy meeting last Wednesday and projected one more rate cut in 2026. Investors, however, remain hopeful about two more rate cuts next year in the wake of Fed Chair Jerome Powell’s remarks, saying that the central bank does not want its policy to push down on job creation amid downside risks to the labor market.
Meanwhile, US President Donald Trump said last Friday that he was leaning toward choosing either former Fed Governor Kevin Warsh or National Economic Council Director Kevin Hassett to lead the US central bank next year. Market participants seem convinced that the new Trump-aligned Fed chair will be an uber-dovish and slash interest rates regardless of the economic fundamentals. This has been another factor behind the recent USD decline and suggests that the path of least resistance for the Gold price remains to the upside. Moreover, the emergence of dip-buying at the start of a new week and acceptance above the $4,300 mark validate the positive outlook.
Last week’s breakout through the $4,245-4,255 supply zone was seen as a key trigger for the XAU/USD bulls. Moreover, short-term moving averages slope higher, keeping the intraday bias pointing north. The broader setup remains supportive as dips attract demand around dynamic supports. The Moving Average Convergence Divergence (MACD) histogram stays positive but has been contracting from recent peaks, suggesting fading bullish momentum; the MACD line holds above the Signal line and above the zero line. RSI (14) prints 68 (near overbought), easing from earlier extremes and hinting that upside could be capped until momentum resets.
If buyers reassert control and the MACD histogram re-expands, the advance could extend towards retesting the all-time peak, while a further contraction accompanied by an RSI roll-over from the high-60s would favor consolidation. A sustained hold above rising short-term moving averages would preserve the bullish tone, whereas a close beneath these dynamic supports would open the door to a deeper pullback. Overall, momentum remains positive but stretched, which could translate into choppy trade before a decisive break emerges.
(The technical analysis of this story was written with the help of an AI tool)
XRP price prediction has hit a critical point where technical warning signals are battling with increased institutional demand.
While new spot XRP ETFs are continuing to attract capital, the price structure shows growing downside pressure.
As a result, XRP price prediction is now conditional on whether historical risk patterns override long-term accumulation trends.
XRP price prediction turned cautious on the three-day EMA ribbon structure. A chart by Steph is Crypto highlighted a repeating historical pattern linked to this indicator.
Every time the EMA ribbon flipped bearish and price was below it, extended drawdowns followed it.
These moves were short-lived corrections. Instead, they turned into multi-month downtrends of 27-66% losses.
Notably, bigger declines occurred when the EMA ribbon was bearish for longer periods of time. Past examples in 2014, 2017, 2019 and 2022 show no exceptions to this pattern.
Each cycle was the same: breakdown, consolidation and delayed recovery. This consistency gives weight to the current warning signal.
At this time, XRP keeps trading below the EMA ribbon. This positioning has downside risk active in the near-term. Until price recovers the ribbon, XRP price prediction remains structurally fragile.
Despite technical pressure, XRP price prediction gets better when institutional activity is taken into consideration.
Spot XRP ETFs have offered a regulated way forward for big money to gain exposure. This shift has changed the way that XRP is perceived within traditional finance.
ETF inflows are hitting the $1 billion mark in a short time. This pace is faster than early adoption rates observed in several of the big crypto ETFs.
As a result, XRP is beginning to be regarded as a legitimate market asset more and more. Daily ETF purchases continuously pull XRP out of the exchange circulation.
This process tightens available supply over time. Notably, a lower supply base often compounds the effect of price reaction when demand picks up.
Regulatory clarity reinforced this trend further. Clear legal outcomes demystified for institutional investors. As a result, XRP now fits more easily into conventional portfolio strategies.
There’s the added benefit of Ripple’s growing involvement in cross-border payments lending fundamental support to it.
There is real-world utility, that means there is demand beyond speculative trading. Together, these factors make the XRP price prediction outlook much better for the long-term.
XRP price prediction is still cautious when analyzing short-term trends. As per the data on CoinStats, XRP has declined by about 1.35% in the last session. Price is now closer to support than resistance on intraday charts.

In the hourly time frame, the buyers have really struggled to gain back momentum. If this weakness continues, there is likely to be a breakdown toward the $1.98 level.
That area is the closest short-term support objective. The daily chart shows much more importance on the $2.00 level.
This is the psychological and structural threshold area. A strong loss could hasten downside pressure.
Therefore, this support is vital for the following weeks. Failure to hold it could run the current decline into the month-end. Near-term XRP price prediction remains defensive.
Gold price (XAU/USD) climbs to seven-week highs above $4,325 during the Asian trading hours on Monday. The precious metal extends its upside amid the prospect of interest rate cuts by the US Federal Reserve (Fed) next year. Lower interest rates could reduce the opportunity cost of holding Gold, supporting the non-yielding precious metal. Additionally, uncertainty and the risk-off sentiment could boost the safe-haven flows, benefiting the yellow metal price.
Nonetheless, hawkish remarks from Fed officials last week could lift the US Dollar (USD) and weigh on the USD-denominated commodity price. Traders will take more cues from the speeches by Fed Governor Stephen Miran and New York Fed President John Williams later on Monday.
The US employment report for October and November will take center stage on Tuesday, including Nonfarm Payrolls (NFP), Average Hourly Earnings and Unemployment Rate. These reports could provide more clarity on the labor market’s health and likely influence expectations for the Fed’s January meeting.
Gold price trades in positive territory on the day. According to the four-hour timeframe, the positive outlook of the precious metal remains in play as the price holds above the key 100-day Exponential Moving Average. The Bollinger Band widens, suggesting a strong bullish trend. Furthermore, the upward momentum is reinforced by the 14-day Relative Strength Index (RSI), which stands above the midline near 68.75. This displays the bullish momentum for the yellow metal.
On the bright side, the first upside barrier to watch is in the $4,345-$4,355 zone, representing the upper boundary of the Bollinger Band and the high of December 12. Sustained upside momentum could take XAU/USD back up to an all-time high of $4,381. Further north, the next resistance level is located at the $4,400 psychological mark.
On the downside, the initial support level for the yellow metal is seen at the low of December 12 at $4,257. More bearish candlesticks reflect a continuation of downside pressure, possibly dragging the price down to the next bearish target at $4,200, the 100-day EMA. The next contention level emerges at $4,166, the lower limit of the Bollinger Band.
In the world of financial jargon the two widely used terms “risk-on” and “risk off” refer to the level of risk that investors are willing to stomach during the period referenced. In a “risk-on” market, investors are optimistic about the future and more willing to buy risky assets. In a “risk-off” market investors start to ‘play it safe’ because they are worried about the future, and therefore buy less risky assets that are more certain of bringing a return, even if it is relatively modest.
Typically, during periods of “risk-on”, stock markets will rise, most commodities – except Gold – will also gain in value, since they benefit from a positive growth outlook. The currencies of nations that are heavy commodity exporters strengthen because of increased demand, and Cryptocurrencies rise. In a “risk-off” market, Bonds go up – especially major government Bonds – Gold shines, and safe-haven currencies such as the Japanese Yen, Swiss Franc and US Dollar all benefit.
The Australian Dollar (AUD), the Canadian Dollar (CAD), the New Zealand Dollar (NZD) and minor FX like the Ruble (RUB) and the South African Rand (ZAR), all tend to rise in markets that are “risk-on”. This is because the economies of these currencies are heavily reliant on commodity exports for growth, and commodities tend to rise in price during risk-on periods. This is because investors foresee greater demand for raw materials in the future due to heightened economic activity.
The major currencies that tend to rise during periods of “risk-off” are the US Dollar (USD), the Japanese Yen (JPY) and the Swiss Franc (CHF). The US Dollar, because it is the world’s reserve currency, and because in times of crisis investors buy US government debt, which is seen as safe because the largest economy in the world is unlikely to default. The Yen, from increased demand for Japanese government bonds, because a high proportion are held by domestic investors who are unlikely to dump them – even in a crisis. The Swiss Franc, because strict Swiss banking laws offer investors enhanced capital protection.
Solana (SOLUSD) has seen a notable drop in its price recently, trading at $130.62, down 4.27% within the last day. This decline comes despite Solana’s impressive three-year growth of over 907%. So, what does this mean for the SOLUSD price prediction heading towards December and beyond?
As of now, Solana is priced at $130.62 after a decrease of $5.82 from its previous close of $136.44. The cryptocurrency’s price has fluctuated between a day low of $130.2 and a high of $133.69. With a current market cap of $61.28 billion and a trading volume of 36.36 million, SOLUSD is experiencing a relative volume slightly above average. Although its short-term performance shows challenges, it’s important to note that Solana’s price remains significantly above its year low of $95.16.
Technical indicators reveal a bearish sentiment for SOLUSD. The Relative Strength Index (RSI) stands at 39.82, signaling that Solana is nearing oversold conditions. The MACD shows a histogram reading of 1.85, indicating some bullish momentum may develop. However, the ADX at 39.69 suggests a strong downward trend is still in effect. With the Awesome Oscillator at -13.01 and Bollinger Bands’ lower limit at $127.23, a breach below $130 might lead to further declines.
Forecasts, provided by platforms like Meyka AI, suggest a more tempered short-term outlook for Solana with a monthly target of $120.54. However, the quarterly prediction stands more optimistic at $187.23. Over the next year, SOLUSD might stabilize near $181.1. As forecasted for the longer term, within five years, Solana could aim for $294.54, driven by advances in its ecosystem and broader market recovery. It’s crucial to remember that “forecasts can change due to macroeconomic shifts, regulations, or unexpected events affecting the crypto market.”
Although recent news regarding Solana emphasizes its role in ongoing debates about crypto exchanges, it hasn’t deeply affected the market price yet. However, broader market sentiments and technological advancements within the Solana ecosystem will play pivotal roles in upcoming price movements.
While Solana faces immediate downward pressures, the long-term outlook remains positive, supported by its solid market position and forecasts suggesting future growth. Investors should closely monitor market conditions and technological developments as they unfold.
Solana is currently trading at $130.62, with recent fluctuations noted due to market conditions and sentiments at play around exchanges and regulations.
Monthly forecasts suggest a potential dip to $120.54, with longer-term targets like $187.23 quarterly, and $294.54 in five years, driven by market recovery expectations.
The trading volume stands at 36.36 million, slightly above its average, indicating solid interest despite recent price declines. This reflects steady investor attention.
Recent decreases in Solana’s price are linked to broader market trends and technical signals pointing towards a short-term bearish outlook, alongside slight shifts in investor sentiment.
Key indicators include RSI at 39.82 and MACD with a histogram of 1.85, signaling potential bullish development. However, strong trends indicated by ADX and other oscillators suggest caution.
Disclaimer:
Cryptocurrency markets are highly volatile. This content is for informational purposes only.
The Forecast Prediction Model is provided for informational purposes only and should not be considered financial advice.
Meyka AI PTY LTD provides market data and sentiment analysis, not financial advice.
Always do your own research and consider consulting a licensed financial advisor before making investment decisions.
On Tuesday, December 16, preliminary private sector PMI data will be in focus. The S&P Global Services PMI will be the focal point, given that services account for around 70% of the GDP. Economists forecast the S&P Global Services PMI to drop from 53.2 in November to 51.6 in December.
While slower services sector activity may signal a loss of economic momentum, holding above the 50 neutral level will be key. Furthermore, traders should focus on the employment and prices sub-components. A tighter labor market, higher wage growth (input prices), and hotter inflation (output prices) would signal a more hawkish BoJ rate path.
On Wednesday, December 17, Japanese trade data will provide insights into the effect of US tariffs on demand. Economists predict exports to rise 4.8% year-on-year (YoY) in November, up from 3.6% in October. Imports are expected to rise 2.5% YoY in November, up from 0.7% in October.
A sharp pickup in external demand and robust imports would support Governor Ueda’s view that US tariff risks have diminished. Given Japan’s trade-to-GDP ratio is roughly 45%, improving trade terms would boost the economy and demand for the yen.
For context, external demand fell 0.2% quarter-on-quarter in Q3, contributing to a 0.6% economic contraction. However, the US reduced tariffs on Japanese goods from 25% to 15% in Q3, boosting external demand early in Q4.
On Friday, December 19, national inflation figures will draw interest ahead of the BoJ’s monetary policy decision. Economists forecast the so-called core-core annual inflation rate to remain at 3.1% in November. Steady or rising core-core inflation would boost expectations of a more hawkish BoJ monetary policy outlook.
Jessie A Ellis
Dec 14, 2025 10:13
MATIC price prediction shows potential recovery to $0.45 within 4-6 weeks, but immediate downside risk to $0.35 support level as technical indicators signal mixed sentiment.
Polygon’s MATIC token sits at a critical juncture as December 2025 winds down, trading at $0.38 amid conflicting technical signals and varied analyst forecasts. This comprehensive MATIC price prediction examines both immediate risks and medium-term recovery potential as the token attempts to establish a base above key support levels.
• MATIC short-term target (1 week): $0.35-$0.40 range (-8% to +5%)
• Polygon medium-term forecast (1 month): $0.42-$0.50 range (+11% to +32%)
• Key level to break for bullish continuation: $0.42 resistance
• Critical support if bearish: $0.35, then $0.33
The analytical community presents a stark divide in their Polygon forecast, reflecting the token’s position at a technical crossroads. WEEX Crypto News maintains the most conservative MATIC price prediction, targeting just $0.095450 by December 15th—a bearish outlook driven by the recent 31.96% monthly decline and a Fear & Greed Index reading of 26, indicating extreme fear in the market.
Contrasting this pessimistic view, MEXC News projects a more optimistic Polygon forecast, setting a MATIC price target between $0.45-$0.50 within 4-6 weeks. This prediction hinges on MATIC’s ability to reclaim the crucial $0.42 resistance level while maintaining support above $0.35. Meanwhile, Phemex News takes the most bullish long-term stance, projecting MATIC could reach $1 by late 2025, citing Ethereum’s expansion and increased layer-2 adoption as key drivers.
The consensus reveals a market in transition, with short-term bearishness giving way to cautious optimism for medium-term recovery, provided key technical levels hold.
Current Polygon technical analysis reveals a token caught between competing forces. With MATIC trading at $0.38, the price sits precariously below all major moving averages except the 7-day SMA at $0.37. The 20-day SMA at $0.43 represents the first major hurdle, while the 50-day SMA at $0.45 aligns perfectly with analyst price targets for medium-term recovery.
The RSI reading of 38.00 provides a neutral signal, neither oversold nor overbought, suggesting room for movement in either direction. However, the MACD histogram at -0.0045 indicates persistent bearish momentum, though the narrow gap between MACD (-0.0246) and its signal line (-0.0202) suggests this downward pressure may be waning.
Bollinger Bands paint an interesting picture with MATIC’s position at 0.2879, indicating the token trades closer to the lower band ($0.31) than the upper band ($0.56). This positioning often signals oversold conditions and potential for mean reversion toward the middle band at $0.43, supporting the medium-term MATIC price prediction of $0.42-$0.45.
Volume analysis shows relatively subdued trading at $1,074,371 on Binance, suggesting accumulation rather than distribution at current levels.
The optimistic Polygon forecast centers on a successful break above $0.42 resistance, which would trigger a measured move toward the $0.45-$0.50 range. This MATIC price target aligns with the 50-day moving average and represents a logical profit-taking zone for short-term traders.
For this bullish scenario to materialize, MATIC needs sustained volume above 1.5 million daily and an RSI push above 50. A break of $0.50 would open the door to testing the Bollinger Band upper limit at $0.56, representing a 47% gain from current levels.
The long-term bull case supporting the $1 MATIC price target requires broader cryptocurrency market recovery, successful Polygon network upgrades, and increased adoption of layer-2 solutions throughout 2025.
The bearish scenario for this MATIC price prediction involves a breakdown below the critical $0.35 support level. Such a move would likely target the strong support at $0.33, representing a 13% decline from current levels. A failure to hold $0.33 could see MATIC testing the pessimistic analyst target near $0.095, though this extreme scenario would require significant market-wide capitulation.
Risk factors include continued Bitcoin weakness, regulatory uncertainty around layer-2 solutions, and failure to maintain network growth metrics. The 52-week low at $0.37 serves as a psychological floor that bears would need to breach convincingly.
For those considering whether to buy or sell MATIC, the current setup offers a risk-defined opportunity. Conservative buyers should wait for a successful retest of $0.35 support with volume confirmation before entering, targeting the $0.42-$0.45 range for initial profits.
Aggressive traders might consider scaling into positions between $0.37-$0.40, with tight stop-losses below $0.35. The risk-reward ratio favors buyers at current levels, with potential 18-32% upside to the $0.45-$0.50 targets versus 8-13% downside to major support.
Position sizing should remain conservative given the mixed technical picture, with allocation not exceeding 2-3% of portfolio value until bullish momentum confirms above $0.42.
This comprehensive Polygon forecast suggests a period of consolidation followed by potential recovery in early 2025. The most probable MATIC price prediction sees the token finding support near current levels before advancing toward $0.45 within 4-6 weeks, representing a medium confidence forecast.
Key indicators to monitor include RSI movement above 50 for bullish confirmation, MACD histogram turning positive, and most importantly, volume expansion above 1.5 million on any break of $0.42 resistance. Failure to hold $0.35 support would invalidate the bullish thesis and open downside toward $0.33.
The timeline for this prediction spans the next 4-6 weeks, with January 2025 representing a critical period for MATIC’s intermediate-term direction. Investors should remain flexible and ready to adjust positions as technical indicators evolve.
Image source: Shutterstock
Near-term charts showed a more mixed picture. A separate 4-hour TradingView visual showed DOGE near $0.137, with choppy swings and lighter volume into mid-December. Price moved toward $0.15 and then area, according to the same snapshot.
Reports also noted intermittent volume spikes instead of steady inflows. The pattern matched a sideways range below local resistance. Another chart shared by analyst Ali Martinez described a triangle formation and marked $0.14 as key resistance. The analyst stated that a break above that area could open a path toward $0.21, based on the pattern.
Trader Tardigrade also shared a and set a $0.6 target. While spot price stayed under pressure, some data points suggested growing derivatives activity.
CoinGlass figures showed Dogecoin futures open interest rising nearly 7% to around $1.5 billion. Traders often watch open interest for clues about positioning, though it does not confirm direction on its own.
Other metrics showed weaker participation in the spot market. The same coverage cited a 24-hour volume drop of more than 41% to about $696 million, even as prices recovered about 3.5% to near $0.14. It also reported a 30-day decline near 19% and a recent trading range between $0.1657 and $0.1324. The Relative Strength Index sat near 42, which typically signals neutral momentum.
Also Read:
Green tea, packed with antioxidants, may do more than refresh your afternoon — it could actually protect your brain. New research suggests it helps reduce white matter lesions, a key sign of aging in the brain. Here’s how this humble beverage might play a role in preventing cognitive decline.
As people age, their brains naturally undergo structural changes. One of the most telling signs is the formation of white matter lesions, which are often linked to dementia and other forms of cognitive decline. While diet plays a major role in brain health, scientists are now focusing on specific drinks — and green tea is at the top of that list. A recent Japanese study published in Nature found a promising connection between regular green tea consumption and fewer white matter lesions in older adults.
Green tea’s secret lies in its catechins — antioxidant compounds with powerful anti-inflammatory effects. These molecules protect both blood vessels and nerve cells, helping to reduce damage caused by oxidative stress. In the Japanese study, participants who drank at least three cups a day showed significantly fewer white matter lesions than those who drank less.
Researchers believe this effect may stem from green tea’s ability to lower blood pressure and improve circulation. By easing high blood pressure, it helps ensure a steady flow of oxygen and nutrients to the brain, reducing the risk of tiny but damaging micro-lesions.
White matter lesions are often considered early warning signs of dementia. Reducing them could be key to maintaining mental sharpness with age. While the findings are still preliminary, they suggest that something as simple as drinking green tea could support long-term brain health.
That said, the benefits appear strongest in people without major risk factors — like chronic depression or certain genetic predispositions. It’s another reminder that true brain protection comes from a holistic approach: balanced nutrition, regular exercise, and consistent medical care.
In the end, green tea may turn out to be more than a soothing ritual — it could be a genuine ally in protecting cognitive function. Still, researchers caution that further studies are needed to confirm the results and shape future health recommendations.

Stéphanie Le Guillou
Health journalist
With a PhD in Pharmacy and Cancer Biology, this expert has worked in hospitals, the pharmaceutical industry, and a healthcare communication agency.
Today, she pursues her passion for writing, creating medical content for the general public. She regularly contributes to Futura’s Health section, striving to make medical information more accessible.