The main category of All News Articles.
You can use the search box below to find what you need.
[wd_asp id=1]
The main category of All News Articles.
You can use the search box below to find what you need.
[wd_asp id=1]
Jakarta, Pintu News – Over the past year, Dogecoin has grown from a meme coin to an increasingly recognized reserve asset. However, going into 2026, a number of indicators suggest that the DOGE price has the potential to continue to weaken and possibly hit a new low.
What are these signals, and what can investors anticipate for DOGE’s movement in 2026?
On January 2, 2026, Dogecoin saw a 7.10% gain over a 24-hour period, with the price rising to $0.1267, or approximately IDR 2,128. During that time, DOGE traded within a range of IDR 1,978 to IDR 2,132.
At the time of writing, Dogecoin holds a market capitalization of around IDR 354.82 trillion, with a 24-hour trading volume of approximately IDR 29.88 trillion.
Read also: 3 Meme Coins to Watch Out for in January 2026, What Happens?
Towards the end of 2025, the price of Dogecoin (DOGE) fell below $0.12, closing the year down more than 70% from its highest peak. Weak buying pressure hampered any potential immediate price recovery. In the early trading days of 2026, the DOGE price remained below $0.12.
The spot Dogecoin ETF launched in the United States at the end of November 2025 appears to be struggling to attract investor interest.
Based on data from SoSoValue, since trading began on November 24, most days have seen zero net inflows into the DOGE ETF. The current total net assets recorded are only around $5.07 million-the lowest of all US-listed crypto ETFs.
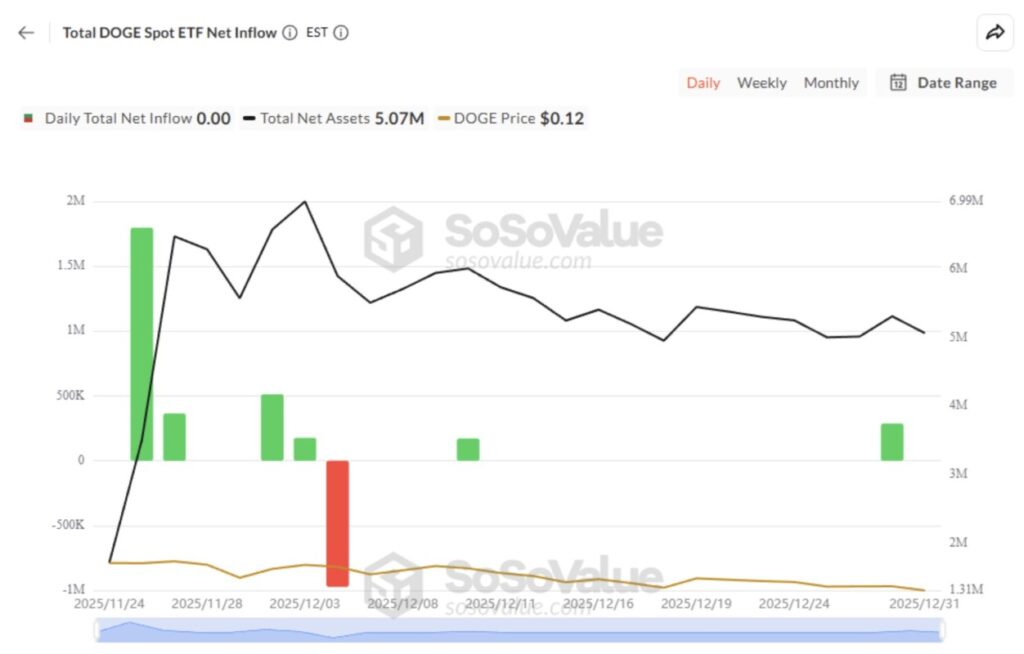
This trend reflects the lack of interest from both institutional and retail investors in DOGE. This situation is in stark contrast to the much stronger performance of XRP and SOL ETFs.
With no new fund flows from ETFs, DOGE lost its upward impetus. Continued selling pressure continues to weigh on the price. If this condition persists until 2026, DOGE will likely find it difficult to recover in the near future.
“Weak demand for ETFs as well as declining open interest in futures contracts further reinforces the ongoing selling trend,” said investor Marzell.
The second factor signaling selling pressure is the rising Dogecoin balance on the Binance wallet (address DE5…ToX), which is one of the largest holders of DOGE. This wallet balance rose again in the second half of 2025, indicating potential selling pressure in the near future.
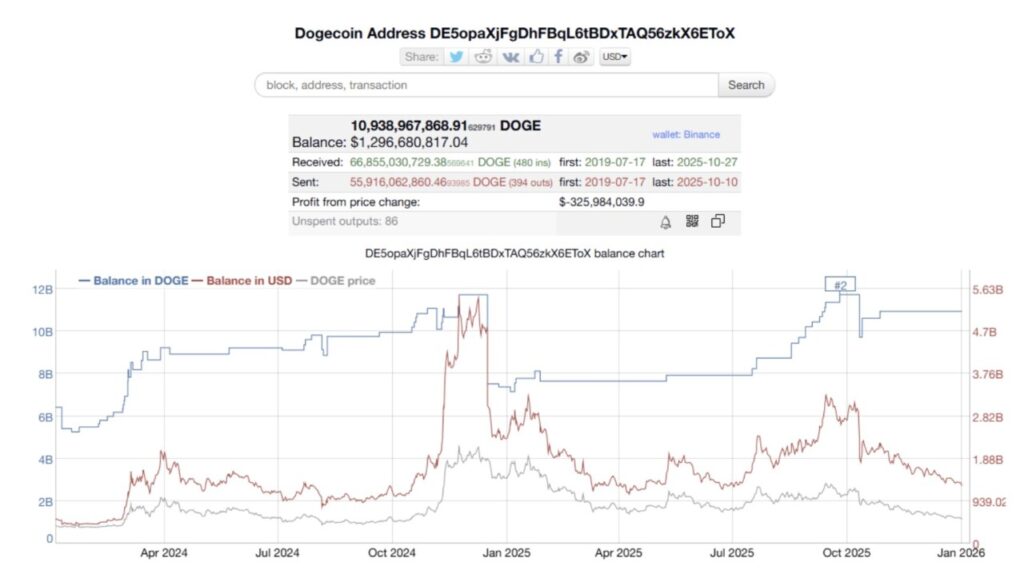
According to data from Bitinfocharts, the amount of DOGE stored in the wallet rose from 7.9 billion to 10.9 billion throughout 2025. Based on historical trends, when the balance exceeds 11 billion DOGE, the price tends to peak.
In strong market conditions, increasing balances on exchanges can support the redistribution of assets to new investors. However, amid low demand, high DOGE reserves on exchanges like Binance create persistent supply-side selling risk.
Read also: Ethereum Struggles to Break $3,000 — Could a 20% Rally Be Ahead?
A third factor adding to the pressure on Dogecoin is the declining interest from retail investors. According to Google Trends data, search interest in Dogecoin is at a five-year low-a trend that is also reflected in many other altcoins.
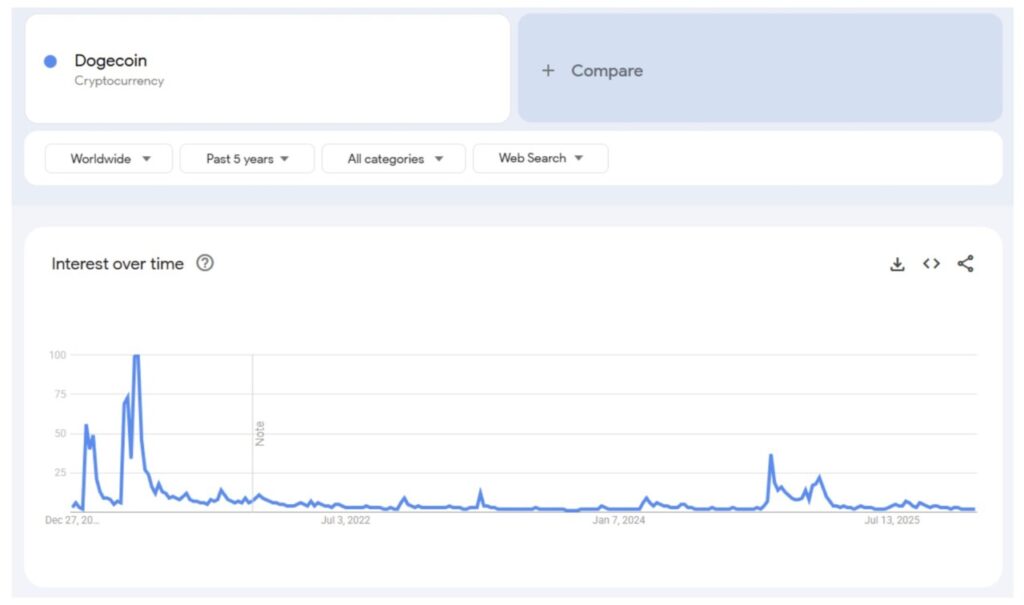
DOGE has been known as a popular coin among retail investors. However, declining interest means fewer new participations. As a result, liquidity has decreased and prices have become more prone to sharp fluctuations.
Some companies such as CleanCore Solutions and BitOrigin are known to hold DOGE as a backup asset. However, current market conditions are putting their positions under pressure.
BitOrigin is known to buy DOGE at a price range of $0.22. Meanwhile, CleanCore Solutions reported on October 6, 2025 that it owned more than 710 million DOGE, with unrealized gains worth more than $20 million at the time. But since October, the price of DOGE has fallen by more than 50%. CleanCore Solutions’ own shares plummeted 90%, suggesting that the strategy of holding DOGE as a backup asset has not convinced investors.
“CleanCore Solutions (ZONE) shares are now down 95% in the last three months. This tarnishes the Dogecoin name,” said investor KrissPax.
Although negative signals continue to emerge, a report from BeInCrypto states that long-term holders are actually starting to show signs of accumulation. For this group, the current price drop is considered a buying opportunity, not a sign of giving up.
That’s the latest information about crypto. Follow us on Google News to get the latest crypto news about crypto projects and blockchain technology. Also, learn crypto from scratch with complete discussion through Pintu Academy and stay up-to-date with the latest crypto market such as bitcoin price today, xrp coin price today, dogecoin and other crypto asset prices through Pintu Market.
Enjoy an easy and secure crypto trading experience by downloading Pintu crypto app via Google Play Store or App Store now. Also, get a web trading experience with various advanced trading tools such as pro charting, various types of order types, and portfolio tracker only at Pintu Pro.
*Disclaimer
This content aims to enrich readers’ information. Pintu collects this information from various relevant sources and is not influenced by outside parties. Note that an asset’s past performance does not determine its projected future performance. Crypto trading activities have high risk and volatility, always do your own research and use cold cash before investing. All activities of buying and selling bitcoin and other crypto asset investments are the responsibility of the reader.
Reference:
Silver price (XAG/USD) rises to near $74.10 per troy ounce during the early European hours on Friday. The price of the grey metal surged 148% in 2025, breaking key levels amid its designation as a critical US mineral, tight supply, low stockpiles, and rising industrial and investment demand.
The non-interest-bearing Silver attracts buyers due to dovish sentiment surrounding the Fed policy outlook. Lower interest rates could reduce the opportunity cost of holding Silver. Traders expect the Federal Reserve (Fed) to deliver two more rate cuts in 2026.
Additionally, Silver prices find support as a softer US Dollar (USD) makes the dollar-denominated metal cheaper for foreign buyers. Markets are bracing for US President Donald Trump to nominate a new Fed chair to replace Jerome Powell when his term ends in May, a move that could tilt monetary policy toward lower interest rates.
The safe-haven metals, including Silver receive support amid heightened geopolitical tensions, fueled by recent exchanges of accusations between Russia and Ukraine over civilian attacks on New Year’s Day and persistent US–Venezuela friction.
Silver gains ground amid a surge in speculative demand in China, driving Shanghai Futures Exchange premiums to record highs. These elevated premiums reflect strong local demand and have tightened global supply chains, echoing earlier inventory squeezes in London and New York vaults.
Silver is a precious metal highly traded among investors. It has been historically used as a store of value and a medium of exchange. Although less popular than Gold, traders may turn to Silver to diversify their investment portfolio, for its intrinsic value or as a potential hedge during high-inflation periods. Investors can buy physical Silver, in coins or in bars, or trade it through vehicles such as Exchange Traded Funds, which track its price on international markets.
Silver prices can move due to a wide range of factors. Geopolitical instability or fears of a deep recession can make Silver price escalate due to its safe-haven status, although to a lesser extent than Gold’s. As a yieldless asset, Silver tends to rise with lower interest rates. Its moves also depend on how the US Dollar (USD) behaves as the asset is priced in dollars (XAG/USD). A strong Dollar tends to keep the price of Silver at bay, whereas a weaker Dollar is likely to propel prices up. Other factors such as investment demand, mining supply – Silver is much more abundant than Gold – and recycling rates can also affect prices.
Silver is widely used in industry, particularly in sectors such as electronics or solar energy, as it has one of the highest electric conductivity of all metals – more than Copper and Gold. A surge in demand can increase prices, while a decline tends to lower them. Dynamics in the US, Chinese and Indian economies can also contribute to price swings: for the US and particularly China, their big industrial sectors use Silver in various processes; in India, consumers’ demand for the precious metal for jewellery also plays a key role in setting prices.
Silver prices tend to follow Gold’s moves. When Gold prices rise, Silver typically follows suit, as their status as safe-haven assets is similar. The Gold/Silver ratio, which shows the number of ounces of Silver needed to equal the value of one ounce of Gold, may help to determine the relative valuation between both metals. Some investors may consider a high ratio as an indicator that Silver is undervalued, or Gold is overvalued. On the contrary, a low ratio might suggest that Gold is undervalued relative to Silver.
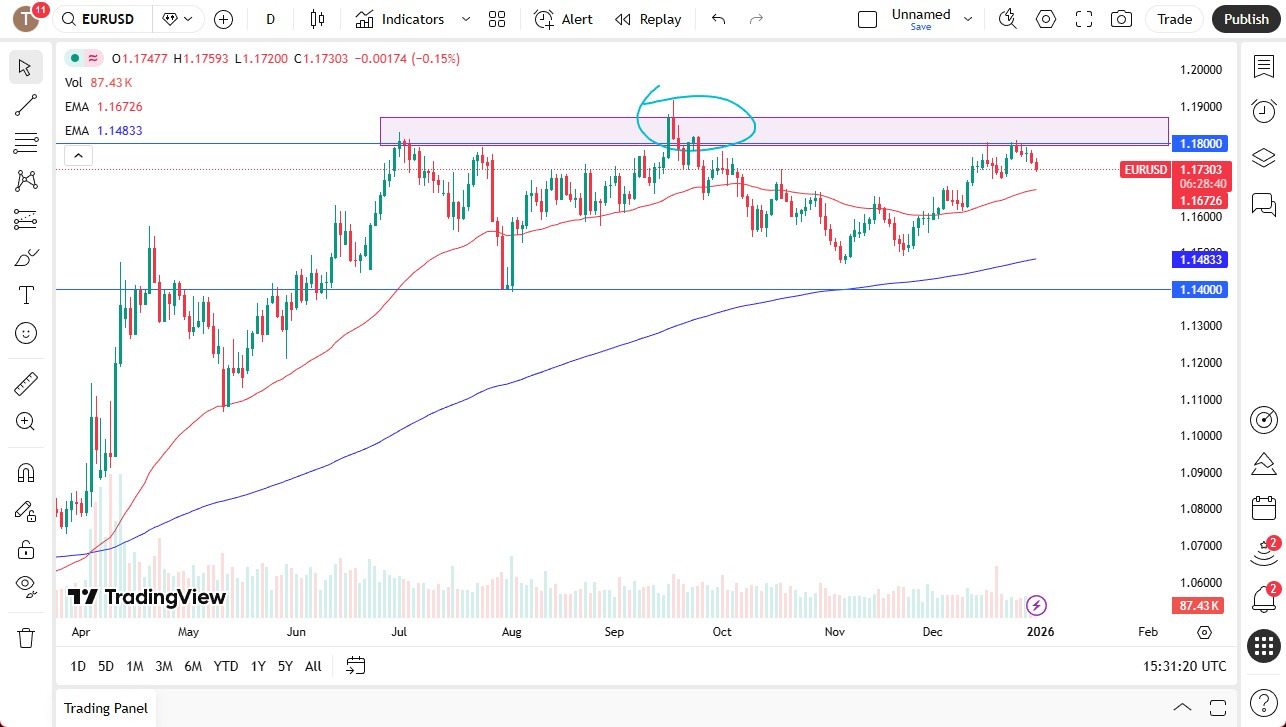
If we could break above the 1.1875 level, then it would be a very bullish sign for the Euro. While I’m not necessarily super bullish on the Euro itself, I can make an argument about how that would happen. Currently, traders around the world are anticipating that the Federal Reserve is going to continue to cut this year, and if that’s going to be the case, they will likely try to punish the US dollar.

That being said, it should also be thought that if we do in fact see aggressive cuts, that’s not a good look for the world economy. After all, loose money does help, but if it’s a bit of a panic, that will have people quite concerned and often will have them running to the US dollar for safety. Ultimately, I think we are still range-bound and I don’t really see anything pushing the Euro higher significantly at the moment, but I can also say that I don’t see anything pushing it a lot lower at the moment either.
The 50-day EMA currently sits at the 1.1672 level and is rising, and I think that makes a nice target for any pullback. Anything below there opens up 1.16, possibly even 1.15, but I think ultimately, we’ve got a scenario where you’re probably looking at choppy and back-and-forth range-bound trading on not only short-term charts but long-term charts. In other words, if you wait long enough, the market will move in your direction. It looks like a market that has nowhere to be.
Ready to trade our daily Forex analysis? We’ve made this forex brokers list for you to check out.
Christopher Lewis has been trading Forex and has over 20 years experience in financial markets. Chris has been a regular contributor to Daily Forex since the early days of the site. He writes about Forex for several online publications, including FX Empire, Investing.com, and his own site, aptly named The Trader Guy. Chris favours technical analysis methods to identify his trades and likes to trade equity indices and commodities as well as Forex. He favours a longer-term trading style, and his trades often last for days or weeks.
Yiruixing Packaging, a Chinese custom packaging manufacturing services provider, has expanded its capabilities to offer more flexible and scalable packaging solutions for businesses in the protein, supplement, and nutrition sectors.
By enhancing its original equipment manufacturing (OEM) and original design manufacturing (ODM) services, the company is aiming to meet the growing demand for custom packaging.
The move aims to handle high-volume production while maintaining market-standard compliance and quality.
The expansion comes in response to the increasing need for packaging solutions that cater to bulk buyers and manufacturers in the nutritional product market.
Yiruixing said that it is now better equipped to support businesses requiring durable, consistent packaging that can meet the demands of large-scale production.
This allows the company to offer custom solutions for packaging protein powders, dietary supplements, and other nutritional products, providing businesses with the flexibility to scale their operations effectively.
The company’s expanded offerings include a range of materials and packaging types, from rigid boxes to flexible pouches and resealable bags.
These packaging solutions are designed to meet the specific needs of each product, ensuring that the integrity of protein and supplement products is preserved throughout the production and distribution processes.
The company’s new approach allows for tailored packaging that accommodates factors such as filling methods, storage conditions, and destination requirements.
By offering options for custom structural designs, material selection, and branding, Yiruixing indicated that it is able to deliver packaging solutions that cater to the diverse needs of its clients.
This includes a commitment to regulatory compliance, ensuring that packaging meets global labelling standards and facilitates smooth distribution across international markets.
Yiruixing said that it has also increased inspection and testing processes at each stage of production.


Cardano (ADA) has started 2026 on a positive note, rising nearly 8% today, moving above the $0.36 level and ranking among the day’s top altcoin gainers. This rise comes after a rough December, when ADA fell nearly 20%, leaving many investors cautious.
So, what’s driving Cardano’s price higher today?
One of the clearest signals behind ADA’s rise comes from CryptoQuant data. Recent on-chain numbers show an increase in activity from large holders, often called whales. Both spot and futures data point to bigger orders entering the market.
When whales begin to buy again, it often signals growing confidence. According to CryptoQuant, market conditions are easing, and buy-side pressure is slowly increasing. This supports the idea that the current move is more than just a random bounce.
Beyond trading data, Cardano’s network is showing real signs of use. Transaction activity and wallet interactions have increased over recent days. This means users are actively using the blockchain, not just holding ADA.
Another positive signal comes from Cardano’s DeFi ecosystem. According to DefiLlama, Cardano’s TVL increased by 4% in the last 24 hours, reaching about $178.9 million. This means more users are putting their funds into Cardano-based DeFi platforms.
When more money flows into DeFi, it usually shows growing trust in the network, which can also increase demand for the ADA token.
For several months, ADA has been moving inside a falling wedge pattern. This happens when the price keeps going down, but selling slowly becomes weaker. As the range gets tighter, it often means a big move is getting close.
Right now, ADA is holding near the $0.35 support level. This area is helping the price stay stable, and buyers are slowly stepping in, showing that selling pressure is easing.
Crypto trader Captain Faibik shared a chart showing ADA near the end of this falling wedge. He believes a breakout could happen if the price moves above the upper trendline.
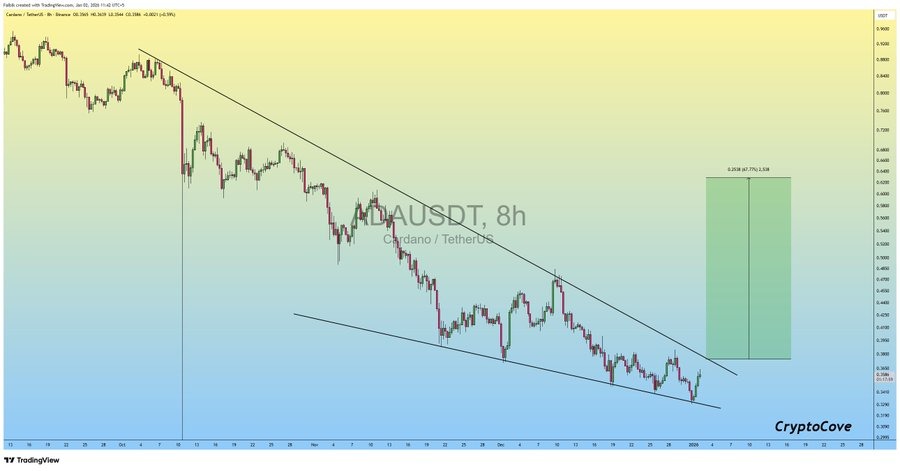
As long as ADA stays above support, the setup remains healthy. If the breakout happens, the price could move toward the $0.52–$0.55 zone, which would mean nearly a 50% rise from current levels.
Stay ahead with breaking news, expert analysis, and real-time updates on the latest trends in Bitcoin, altcoins, DeFi, NFTs, and more.
Rising on-chain activity, improving market conditions, and renewed large-holder interest suggest stronger confidence in ADA’s short-term outlook.
Cardano could trade between $2.75 and $3.25 in 2026 if market sentiment improves, adoption grows, and key support levels hold.
Cardano is considered a long-term project due to its research-driven development, scalability upgrades, and focus on decentralization.
By 2030, Cardano could be valued around $9 to $10 based on long-term growth, network usage, and sustained investor confidence.
CoinPedia has been delivering accurate and timely cryptocurrency and blockchain updates since 2017. All content is created by our expert panel of analysts and journalists, following strict Editorial Guidelines based on E-E-A-T (Experience, Expertise, Authoritativeness, Trustworthiness). Every article is fact-checked against reputable sources to ensure accuracy, transparency, and reliability. Our review policy guarantees unbiased evaluations when recommending exchanges, platforms, or tools. We strive to provide timely updates about everything crypto & blockchain, right from startups to industry majors.
All opinions and insights shared represent the author’s own views on current market conditions. Please do your own research before making investment decisions. Neither the writer nor the publication assumes responsibility for your financial choices.
Sponsored content and affiliate links may appear on our site. Advertisements are marked clearly, and our editorial content remains entirely independent from our ad partners.
“To our knowledge, this is the first study to demonstrate that RR [Rhodiola rosea] can elicit concurrent improvements in maximal strength, muscular endurance and power—challenging a previously reported trade-off,” wrote researchers at Jacksonville State University in the United States and Azad University in Iran.
They reported differing effects on performance with the two doses they tested: “Lower doses preferentially enhancing late-set muscular endurance/volume and higher doses favoring maximal lower-body strength without sacrificing power.” The findings also revealed dose-dependent nootropic effects.
The study noted that rhodiola’s effects have previously been described as “modest and outcome-specific, rather than broadly ergogenic” and that the benefits and mechanisms involved may depend on intake patterns, length of supplementation and the type of exercise.
Rhodiola rosea is a perennial herb that mostly grows at high altitudes in arctic areas of Europe and Asia, with forms of the herb in trade including dry extracts in solid dosage forms such as capsules and tablets, liquid extracts, cut, dried rhizome and root and powdered rhizome and root.
It has traditionally been used to manage stress, depression and mental and physical fatigue, and to boost energy.
Rhodiola may be beneficial for exercise due to its bioactives such as salidroside, which modulates pathways in the nervous system that can support fatigue resistance and power maintenance. Salidroside can also dampen oxidative stress and support mitochondrial biogenesis and stability. The current study did not, however, collect mechanistic biomarkers.
“Practically, these findings suggest that 7-day RR supplementation (200–1,500 mg/day) may benefit athletes in resistance training programs that emphasize volume and fatigue resistance, such as those used in hypertrophy or strength protocols”, the researchers reported, adding that the cognitive enhancements may support sports requiring mental acuity alongside physical demands.
However, they noted that the lack of effects in the Wingate cycling test implied limited utility for explosive sports such as sprinting, although team sports may benefit.
The crossover, double-blind, randomized, placebo-controlled study aimed to determine whether seven-day Rhodiola rosea (RR) supplementation improved resistance performance and executive function in resistance-trained adults compared with placebo.
Twenty-seven resistance-trained athletes between the ages of 18 and 40 were divided into one of four groups: control (CON; no supplement), placebo (PL), low-dose RR at 200 mg/day (LDRR) and high-dose RR at 1,500 mg/day (HDRR). Each period lasted seven days under the assigned condition, with laboratory performance testing on the seventh day comprising strength, cycling and cognitive tests, as well as anthropometric and physiological measurements.
The dosage of RR used was informed by prior studies in athletes and consisted of standardized to 3% salidroside and 1% rosavin sourced from BulkSupplements.com. It was administered to the participants an hour before exercising so that the researchers could evaluate short-term rather than chronic effects.
The results revealed that LDRR increased bench press one-repetition maximum (1RM), set-3 repetitions, set-3 volume and mean power compared with the control condition. HDRR increased set-3 repetitions and peak power “with a trend for set-3 volume”, the researchers wrote.
On the leg press, both rhodiola doses improved 1RM compared to control, with the lower dose increasing the maximum by 35.7 kg and the higher dose increasing it by 47.7 kg. Improvements for both groups were significant versus placebo.
There were also improvements for the supplements in the Stroop Color–Word Tests. No consistent sex differences were observed.
“Short-term RR consumption, regardless of dose or gender, improved resistance performance and significantly enhanced Stroop outcomes, with minimal changes in anaerobic cycling and RPE, and no consistent acute hemodynamic effects,” the researchers concluded.
Source: Nutrients 2025, 17(23), 3736. doi: 10.3390/nu17233736. “Dose–Response Effects of Short-Term Rhodiola rosea (Golden Root Extract) Supplementation on Anaerobic Exercise Performance and Cognitive Function in Resistance-Trained Athletes: A Randomized, Crossover, Double-Blind, and Placebo-Controlled Study”. Authors: M.S. Koozehchian et al.
XRP, the fifth-largest cryptocurrency by market cap, surged 3% today as the new year rally kicks off. Latest market data shows Ripple’s XRP at $1.88, nearing the crucial $2 threshold that could signal a major breakout in 2026. Despite the short-term uptrend, XRP’s overall market trend remains bearish, with an extended monthly decline of $15.24%. As of January 1 and 2, there has been no big surge at the start of 2026 yet, and the XRP market trend looks sideways to moderately bearish in the short term.
XRP’s price bounce reflects new year rally participation, and the digital asset is one of the highly rated ones in the market. However, reaching $100 in 2026 is highly speculative and unlikely, because the market trend projects a more realistic range of $3.50 to $20 by the end of this year. Despite sluggish market conditions, demand for US XRP-spot ETFs held steady, reaching nearly $500 million in December alone. The U.S. lawmakers have officially set a January 15 markup for the newly imposed Market Structure Bill. Based on the factors like legislative progress with the enhanced ETF momentum, XRP will push above the $3 psychological level soon.
According to the current XRP market data, the XRP price today is $1.88, trading closer to the $2 psychological level. The new year rally is making a difference in the XRP rally, because the digital asset is around 3% higher over the past 24 hours. XRP Ledger’s native cryptocurrency is trading with a 24-hour trading volume of $ 2.05B Market cap of $ 114.02B, and a market dominance of 3.79%. XRP’s market sentiment remains bearish, and it has been trading below its 50-Day SMA ($ 2.05) and 200-Day Simple Moving Average ($ 2.48) for a long period of time. Along with the extended bearish trend, XRP has traded 13/30 (43%) days in green with a market volatility of 5.04%. XRP’s fear and greed index signals 20, which is extreme fear in the market, meaning that traders and investors are cautious.
XRP has long faced criticism over its long-term potential, yet early 2026 sessions suggest the asset is gaining momentum. Veteran trader and crypto investor usernamed @investorie shared his thoughts on XRP and explained his long-term admiration for the virtual asset.
He urged traders to stop crying and pay attention. XRP was still below its descending trendline on the daily chart. He acknowledged that the structure was not bullish yet, but stated that what people were missing was that MACD was forming higher lows, RSI was forming higher lows, and price was compressing, not accelerating downward. He mentioned that that was classic momentum divergence. He noted that this did not mean a reversal was confirmed and that it meant selling pressure was weakening under the surface. He pointed out that markets did not bottom when sentiment felt good, but rather when prices stopped responding to fear.
His post shows traders are still valuing XRP and rating it highly as they enter into the new year with a fresh mindset. He concluded his X post by stating that for XRP, the game only changed on a daily close above the trendline (around $2.05–$2.10). Until then, that was accumulation, not hype, and not moon talk. He advised to ignore emotions, watch structure, and watch momentum.
Currently, XRP is slowly regaining its previous market momentum and is on the verge of outperforming prominent cryptocurrencies such as BTC, ETH, SOL, etc. Today, XRP is consolidating between $1.82–$1.87. Based on the recent market data, crossing above the $2 psychological level could be challenging and difficult even with enhanced spot XRP ETF inflows and short-term resurrection.
Here is the XRP price prediction for the next seven days.
| Date | Min Price | Avg Price | Max Price |
|---|---|---|---|
| Jan 2, 2026 | $1.82 | $1.84 | $1.86 |
| Jan 3, 2026 | $1.81 | $1.83 | $1.85 |
| Jan 4, 2026 | $1.81 | $1.83 | $1.85 |
| Jan 5, 2026 | $1.83 | $1.85 | $1.87 |
| Jan 6, 2026 | $1.86 | $1.88 | $1.90 |
| Jan 7, 2026 | $1.86 | $1.88 | $1.90 |
| Jan 8, 2026 | $1.85 | $1.87 | $1.89 |
| Jan 9, 2026 | $1.84 | $1.86 | $1.88 |
Disclaimer: XRP price prediction is speculative and subject to change based on the changing market scenario.
According to the XRP short-term price prediction, the digital asset is expected to trade at an average maximum price of 1.88 in the next seven days.
For XRP, 2026 could mark a major comeback, as the resolution of its long-standing SEC battle and newfound regulatory clarity are set to boost performance and ignite a bullish rally. Based on the recent data and XRP’s historic trend, Ripple’s native cryptocurrency will not hit $100 in 2026. A $100 price demands substantial growth and a total market value above Bitcoin’s, which is highly unlikely at the moment. Industry experts believe that for that kind of growth, XRP might need to become something like a global reserve or settlement currency that is widely used at a massive scale.
The FOMC meeting in December was clear: even though there were some internal disagreements, most of the Fed’s policymakers still think there’s room for further easing if inflation continues to slow. The upshot is lower interest rates, which make holding non-yielding assets like gold much less costly, keeping demand for them afloat.
The ongoing conflicts and tensions between nations have added a big layer of uncertainty to the mix, which in turn has led investors to stick with the tried and true safe haven assets that always seem to do well during times of uncertainty – and gold is no exception.
The big question is: will its price hold at record levels despite the inevitable pullbacks? That said, we do face some near-term headwinds.
The first is that after a gain as sharp as gold’s, some people will want to cash in their profits, which could lead to selling pressure. The CME Group has also decided to up the margin requirements for gold and other metals, which is likely to make it a little more expensive to speculate on the price of gold, and that could also dampen demand.
Looking ahead, gold is likely to remain well-supported as long as rate-cut expectations and geopolitical tensions continue to simmer. However, with US markets set to release a batch of important data, including the final Manufacturing PMI, traders are likely to keep a close eye on how it all plays out, especially its impact on the dollar and the Fed’s next move.
Gold may consolidate between $4,350–$4,450 in the near term, with dips attracting buyers above $4,300, while a break above $4,400 could reopen the path toward $4,475.
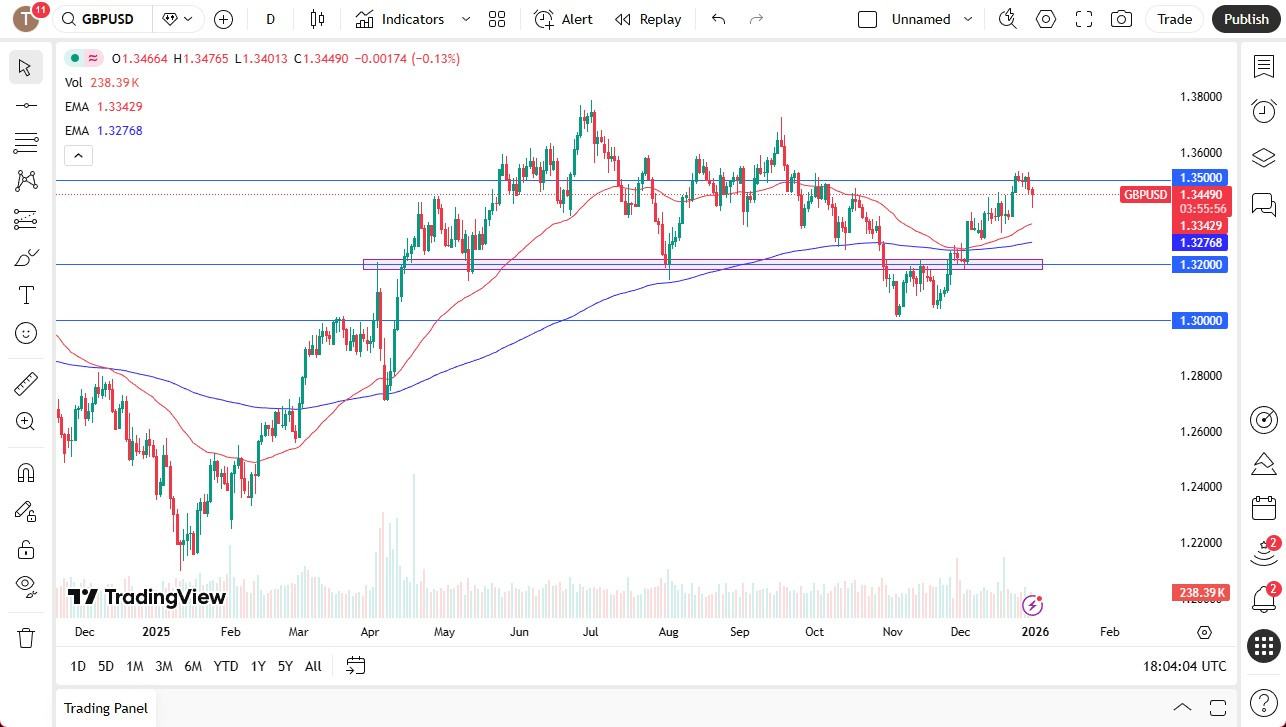
If we break down below the lows of the Wednesday session, we probably go looking to the 50-day EMA, perhaps the 200-day EMA after that, and then eventually the 1.32 level. In general, this is a market that I think continues to be very noisy and, of course, will be driven by the US Dollar more than anything else.
While the Federal Reserve is expected to cut rates next year, the reality is that a lot of the economic numbers coming out of the United States are stronger than people are comfortable with, as far as cutting twice. We’ll see whether or not that ends up being the case, and of course, we’ll have to watch the Bank of England because they just cut. Now the question is, will they have to cut more?
I do think there is potential for either direction at this point, and we’ll just have to watch how things play out over the next couple of trading sessions. The early part of next week will be a bit thin, but as we get later in the week, I think you start to see a little bit more liquidity, a little bit more reality when it comes to this market. Keeping in mind that on Friday there will be trading, but it will be in very thin conditions, so I wouldn’t read too much into this market until at least Monday of next week.
Ready to trade our daily GBP/USD Forex forecast? Here’s some of the best forex broker UK reviews to check out.
Christopher Lewis has been trading Forex and has over 20 years experience in financial markets. Chris has been a regular contributor to Daily Forex since the early days of the site. He writes about Forex for several online publications, including FX Empire, Investing.com, and his own site, aptly named The Trader Guy. Chris favours technical analysis methods to identify his trades and likes to trade equity indices and commodities as well as Forex. He favours a longer-term trading style, and his trades often last for days or weeks.
Last Updated:
Only Camellia sinensis-based drinks can be labelled as tea in India, says FSSAI.
The Food Safety and Standards Authority of India (FSSAI) has issued a formal clarification, where they mentioned that, in India, only beverages made from the Camellia sinensis plant will be labelled as Tea. This move comes after regulators noticed Food Business Operators (FBOs) marketed products like herbal tea, flower tea, and rooibos tea, even though they are not derived from the traditional tea plant.
According to FSSAI, tea is defined under the Food Safety and Standards (Food Product Standards and Food Additives) Regulations, 2011. Products only made with the Camellia sinensis plant qualify as tea. It includes black tea, green tea, white tea, oolong tea, Kangra tea and instant tea in solid form. In all these varieties, the difference is just the processing methods like oxidation and drying, but all come from the same plant.
FSSAI clarified that plant-based or herbal infusions made from flowers, herbs, fruits, or other plants do not qualify as tea. Using the word “tea” for such products, either directly or indirectly, is misleading. As per labelling rules under the Food Safety and Standards (Labelling and Display) Regulations, 2020, the name of the food must reflect its true nature on the front of the package. Calling herbal infusions “tea” amounts to misbranding under the Food Safety and Standards Act, 2006.
All FBOs, including e-commerce platforms, have been directed to stop the use of the word ‘tea’ for products not derived from Camellia sinensis. Based on their ingredients, these products can be categorised and classified as proprietary foods or non-specified foods. State food safety authorities have been given strict monitoring instructions and action to be taken against violators.
top videos
2026 Fitness Guide: Short And Effective Workout Plans For Hourglass Figure, Abs, And Fat Loss
Goal Setting In 2026: Evidence-Based Strategies To Finally Succeed
New Year Resolutions: How To Make A Vision Board That Actually Works In 2026
Steal Sonakshi Sinha’s Housewarming Glow With This Easy Makeup Routine | Watch
Shilpa Shetty’s Yoga Routine For High Blood Pressure | Natural Ways To Lower BP
For consumers, the clarification brings more transparency. Green tea and black tea remain unchanged. However, products commonly known as chamomile tea, hibiscus tea, or rooibos tea may soon be sold as “herbal infusions” or “flower infusions,” helping buyers better understand what they are consuming.
With this move, FSSAI aims to curb misleading labels and ensure honesty in food marketing, reinforcing that in India, “real tea” comes only from Camellia sinensis.
Delhi, India, India
January 02, 2026, 12:02 IST