The main category of All News Articles.
You can use the search box below to find what you need.
[wd_asp id=1]
The main category of All News Articles.
You can use the search box below to find what you need.
[wd_asp id=1]
You know the drill.
It’s the day after New Year’s, you’ve cleaned out the closet, you’ve made the vision board, you’ve sworn off the sugary treats and libations that the holiday season brought, and now you’re locking in to a new fitness routine. What’s next? Perhaps a pre-workout.
Whether it’s as simple as upping your step count or you’ve got some grand plans to get shredded at the gym this year, these supplements are clinically proven to deliver physical and cardiovascular benefits, including increased energy, focus, and strength during exercise. Not only that, but clinical reviews have also revealed that pre-workouts could have positive impacts on blood pressure and triglyceride levels.
Today marks a rare opportunity to stock up on one of Amazon’s most popular pre-workout formulas for less. The vegan, keto-friendly C4 Original Pre Workout Powder is currently 20% off in several favorite flavors, including Cherry Limeade, Fruit Punch, and Cherry Bombsicle.
Combining 150 mg of caffeine, 1.6 g of beta-alanine, and a single gram of creatine, this patented blend is a clear favorite among users, who report significant performance gains with minimal side effects.
Designed to charge your fitness goals, C4 is a top-rated pre-workout powder that combines clinically studied ingredients for a powerful, yet steady energy boost.
Jitters and energy crashes are common complaints with pre-workouts, but C4 users note that this balanced blend seems to alleviate some of those side effects.
“What I appreciate most about C4 Original is that it provides a reliable energy boost without giving me jitters or a crash afterwards,” one reviewer claimed. “The explosive energy claim is legit — within about 20–30 minutes, I feel more alert, focused, and ready to push harder in my workouts.”
C4 mixes easily with water and comes in a variety of tasty, refreshing flavors, now under $40 on Amazon for a 60-serving supply. A solid deal for beginners and seasoned fitness pros alike.
This article was written by Miska Salemann, New York Post Commerce Writer/Reporter. As a health-forward member of Gen Z, Miska seeks out experts to weigh in on the benefits, safety and designs of both trending and tried-and-true fitness equipment, workout clothing, dietary supplements and more. Taking matters into her own hands, Miska intrepidly tests wellness products, ranging from Bryan Johnson’s Blueprint Longevity Mix to home gym elliptical machines to Jennifer Aniston’s favorite workout platform – often with her adorable one-year old daughter by her side. Before joining The Post, Miska covered lifestyle and consumer topics for the U.S. Sun and The Cannon Beach Gazette.
Solana is priced near $125.69 with a live market cap around $70,780,655,373 and a 24-hour volume near $2,306,325,895, ranking #7 on CoinMarketCap with roughly 563,155,830 SOL in circulating supply. In the broader tape, Bitcoin is near $88,485.13 with a market cap of about $1,767,069,049,489, while Ethereum is near $2,993.90 with a market cap of about $361,347,912,973.
That macro backdrop matters because when BTC and ETH stabilize, capital often rotates into high-beta majors like SOL before it later chases smaller narratives.
Solana sits in the sweet spot where liquidity is deep enough for large flows, yet narrative momentum can still move price faster than the slowest large caps.
Why Solana Demand Keeps Returning
Solana remains one of the most used consumer-oriented chains because its throughput and low fees make on-chain activity feel instant. That user experience is a real moat in cycles where traders want speed, cheap execution, and a constant stream of new launches. When meme and NFT activity heats up, Solana often benefits because it can absorb high transaction bursts without pricing out smaller users.
This is why SOL tends to respond quickly when risk appetite returns. Still, it is important to separate network popularity from price multiples. At a ten of billions valuation, SOL can trend strongly, but it is less likely to deliver the life-changing percentage jumps that micro caps can produce.
Technical Indicator View Using Classic Signals
A disciplined 2026 outlook uses confirmation instead of wishful forecasting. Start with the 200-day moving average because it often acts like the market’s long-term trend line. When SOL holds above the 200-day average for weeks, the market is usually signaling that demand is absorbing supply. Next, watch the 50-day moving average for trend acceleration. If the 50-day line is rising and price respects it on pullbacks, momentum is typically constructive.
Then check RSI. Readings in the 50 to 60 zone often indicate healthy momentum with room to run, while repeated failures to hold 50 can warn that rallies are being sold. MACD is your trend change detector. A bullish cross that stays supported by steady volume is more meaningful than a one-day pop.
Finally, use simple support and resistance planning. Solana often builds a base, tests the ceiling multiple times, then breaks when volume expands. A confirmed breakout usually includes a daily close above resistance and a successful retest that turns that level into support.
Solana Price Prediction Scenarios for 2026
Base case. SOL continues a grind higher as the market normalizes, with pullbacks that find buyers at key moving averages. In this scenario, traders look for higher lows on the weekly chart, an RSI staying above 50, and a steady slope in the 50-day moving average.
Bull case. A strong risk-on year pushes users and liquidity back into high-activity chains. If Solana keeps attracting launches and on-chain flows, the price can trend into new ranges, especially if BTC remains firm and ETH sentiment stays positive.
Bear case. If macro conditions tighten or liquidity dries up, SOL can consolidate for longer and sweep downside support zones before recovering. That does not break the long-term thesis, but it can delay the breakout timing and raise opportunity cost.
Pepeto Micro Cap Rotation Built on Ethereum
Solana can be a strong major, yet the biggest percentage moves in crypto usually happen at the micro-cap layer when retail attention concentrates. Pepeto is positioned for that lane on Ethereum mainnet, combining meme culture with real utility so the story is both simple and usable.
Pepeto (https://pepeto.io/) ecosystem includes PepetoSwap, positioned as a zero-fee swap; Pepeto Bridge for cross-chain movement; and Pepeto Exchange, a verified meme exchange where all volume routes through $PEPETO. That routed volume design is the demand engine. The goal is for swap, bridge, and exchange activity to continuously pull usage through the token rather than relying on a single hype moment.
Pepeto supply is fixed at 420T tokens (https://pepeto.io/#tokenomics) . Staking APY is marketed around 216% , which can tighten circulating supply and reduce future sell pressure if early buyers choose yield. Security posture is supported by audits from SolidProof and Coinsult.
The community is presented as more than 100,000 members, adding social gravity that often attracts liquidity in meme cycles.
The live presale snapshot shows 1 PEPETO equals $0.000000175 with $7.14M raised. For traders hunting the best crypto to buy now, Pepeto is framed as the next 100x meme coin style asymmetry because the starting valuation is small and the participation path is straightforward.
How to Buy Pepeto
Use a direct, clean process. Go to (https://pepeto.io/) and confirm you are on the official site before connecting anything. Connect a Web3 wallet, choose payment in ETH, USDT, BNB, or a bank card via Web3Payments, then enter your amount and approve the transaction.
Right after buying, you can stake from the same flow to start earning the high APY before launch (https://pepeto.io/en/staking). The official site also advertises a $700,000 giveaway, so treat copycat links as a red flag and type the domain manually.
Solana’s 2026 outlook is strongest when classic indicators confirm the trend and the market stays risk-on, but its large valuation naturally moderates extreme multiples. Pepeto is positioned as the faster retail rotation bet on Ethereum, with routed ecosystem demand, staking-driven supply tightening, and audited infrastructure layered onto a meme narrative, positioning it as a Best Crypto Presale.
In every cycle, the window with the best risk reward usually appears before the next price step and before the crowd arrives.
To stay ahead of key updates, listings, and announcements, follow Pepeto on its official channels only:
Website: https://pepeto.io
X (Twitter): https://x.com/Pepetocoin
Telegram: https://t.me/pepeto_channel
Instagram: https://www.instagram.com/pepetocoin/
Windows like this belong to those who secure position before momentum ignites, because once participation explodes, this entire access channel collapses.
Contact: Dani Bonocci
Website: https://www.tokenwire.io
Phone: +971586738991
SOURCE: Pepeto
Press release distribution
This release was published on openPR.
The Spice & Tea Exchange is refreshing its matcha lineup with offerings that invite creativity in the kitchen and behind the bar. From smooth ceremonial matcha to playful blends like blueberry matcha and tropical mango matcha, these selections are ready to star in lattes, spirits, and desserts.
To complete the experience, The Spice & Tea Exchange matcha whisk kit features a 5-piece set with a bowl, sifter, bamboo whisk, and scoop, making it an ideal way to start the year for tea lovers and wellness enthusiasts.
Ceremonial matcha ~ Green tea leaves are finely ground, resulting in high-quality matcha that’s perfect for preparing traditional matcha, cold-brewed matcha, green tea lattes, and smoothies. This is a ceremonial grade matcha, which tends to have a smoother flavor and results in a more vibrant, deeper shade of green than culinary matcha. Price $21.99
Tropical mango matcha ~ This exotic fusion combines matcha’s earthy, umami-rich flavour with the sweet, tropical essence of ripe mango. The result is a delightful pairing, delivering a smooth texture and a potent antioxidant boost with a refreshing and fruity twist. This harmonious balance of flavors offers both a tropical escape and a luxurious tea experience. Price $21.99
Blueberry matcha ~ This innovative blend combines the rich, umami notes of high quality matcha with the sweet, tangy essence of blueberry. The result is a beautifully balanced powder that can transform any beverage into a flavorful and benefit-rich experience. The ceremonial-grade matcha is finely ground from young, shade-grown tea leaves, providing a smooth texture and a potent antioxidant boost, while blueberry adds a fruity twist to complement green tea’s natural depth. Price $21.99
Key Takeaways
YoungHoon Kim, who claims to hold the world’s highest IQ, has predicted Bitcoin could reach $276,000 by February 2026.
Several of his past Bitcoin price forecasts have failed to materialise.
Analysts say Bitcoin is nearing a potential breakout zone.
The self-proclaimed world’s smartest man has once again made a bold prediction about the future price of Bitcoin (BTC), saying the world’s largest crypto could surge over $270,000 in just a month.
Kim, who claims to hold an IQ of 276, has made a new claim that Bitcoin’s price could surge to $276,000 by February 2026.
The social media predictor reportedly highlighted increased and weakening fiat currencies as reasons for his bullish outlook.
Bitcoin has historically shown large price swings and remains increasingly sensitive to shifts in global macroeconomic factors.
Kim’s latest forecast follows a series of previous Bitcoin predictions that have failed to materialize.
In November, Kim told followers on X that Bitcoin would surge to $220,000 within 45 days, more than doubling from levels at the time.
That rally did not occur.
“I expect Bitcoin is going to $220,000 in the next 45 days,” Kim wrote, adding that he would use all future BTC profits to fund church constructions worldwide.
On top of this prediction, Kim also said he believed “Bitcoin may replace USD by 2026.”
The high IQ holder has continued to tell his followers that Bitcoin’s current low price was just a “temporary discount” caused by market manipulation.
“I think any such manipulation may disappear within a week, and then it could start accelerating toward a new ATH,” he wrote.
Kim has also issued optimistic projections for other cryptocurrencies, including XRP.
He has said XRP could approach $1,000 over the next decade under what he described as specific macroeconomic conditions, including a large-scale shift of capital into digital assets.
“Under the assumption of a large-scale migration of capital into crypto, alongside a significant decline in the dollar’s value and elevated inflation, the scenario cannot be ruled out on a numerical basis,” Kim wrote.
In separate posts, he suggested XRP may be nearing a major cycle peak and could benefit from seasonal price movements, predicting a possible rally around Christmas and a potential all-time high in January 2026.
On Dec. 30, Kim put out a bullish urgent post stating: “Watch XRP. Next 48 hours. $3 level.”
At the time of reporting, XRP is trading at $1.89, up just 1% in the last week.
Despite optimism from bullish predictions, analysts are pointing to technical signals that suggest Bitcoin is nearing a decisive move but lacks confirmation of a sustained upside breakout.
By HOKANEWS Editorial Team
After years of experimentation, boom-and-bust cycles, and shifting player expectations, the Web3 gaming sector is preparing for a decisive new chapter in 2026. Leading projects are signaling a willingness to take greater creative and economic risks, betting that innovation rather than caution will define the next phase of blockchain-based games.
Insights from developers and industry leaders suggest that Web3 gaming is moving beyond its early play-to-earn foundations toward more complex, skill-driven, and high-stakes experiences. Among the most closely watched developments are plans by Axie Infinity to embrace bolder design choices, a new competitive “risk-to-earn” mode under development by Illuvium, and broader reflections from Animoca Brands co-founder Yat Siu on politics, regulation, and the future of Web3 under a changing global landscape.
The discussion, highlighted in coverage by Cointelegraph Magazine and confirmed by the Cointelegraph X account, reflects a growing consensus that Web3 gaming must evolve rapidly to survive and compete with traditional gaming ecosystems.
Once the flagship of the play-to-earn movement, Axie Infinity became a global phenomenon during the 2021 bull market. However, like much of the Web3 gaming sector, it struggled to maintain momentum as token incentives weakened and player engagement declined.
Heading into 2026, the Axie Infinity team is signaling a strategic shift. Developers have acknowledged that overly conservative design decisions limited innovation and contributed to stagnation. In response, the project plans to take more creative and economic risks, focusing on gameplay depth, competitive balance, and long-term player retention rather than short-term token rewards.
Executives behind Axie Infinity argue that the next generation of Web3 gamers expects experiences comparable to traditional games, with meaningful progression, real challenge, and the possibility of loss. This represents a departure from early models that emphasized guaranteed rewards and low barriers to entry.
Industry analysts view this shift as a necessary evolution. Without higher stakes and deeper mechanics, Web3 games risk being perceived as financial products rather than entertainment.
Illuvium is also pushing boundaries with its plans for a new risk-to-earn deathmatch mode, an approach that explicitly embraces loss as part of the gameplay loop. Unlike traditional play-to-earn systems, where rewards are often distributed regardless of performance, risk-to-earn models require players to stake assets with the possibility of losing them.
Developers believe this approach creates stronger emotional engagement, competitive integrity, and a healthier in-game economy. By tying rewards to skill and strategy rather than participation alone, Illuvium aims to attract players who value challenge and mastery.
The proposed deathmatch mode would allow players to pit their characters and assets against one another in high-stakes battles. Winners earn meaningful rewards, while losers accept real consequences. Supporters argue that this mirrors the appeal of esports and competitive gaming, where risk and reward are inseparable.
Critics, however, warn that such systems could alienate casual players. Illuvium’s team has indicated it plans to balance accessibility with optional high-risk modes, allowing players to choose their level of exposure.
The shift toward risk-based mechanics reflects a broader industry rethinking of play-to-earn itself. Early Web3 games often prioritized financial incentives over gameplay quality, leading to unsustainable economies and mercenary player behavior.
In 2026, many developers are reframing the model as play-and-compete or play-and-own. Under this approach, blockchain elements enhance ownership and interoperability, but the core experience remains grounded in fun, challenge, and community.
Market researchers note that successful Web3 games increasingly resemble traditional games first, with tokenomics playing a supporting role rather than the central attraction. This trend aligns with player feedback and lessons learned from past cycles.
Beyond game design, industry leaders are also grappling with macro forces shaping the future of Web3. Yat Siu, a prominent advocate for digital property rights, has spoken openly about the political and regulatory environment facing blockchain innovation.
Siu has suggested that political shifts, including the growing influence of Donald Trump, could significantly affect Web3 adoption in the United States. He argues that policies favoring deregulation, entrepreneurship, and digital ownership could create a more favorable environment for blockchain gaming and virtual economies.
At the same time, Siu cautions that regulatory clarity is more important than ideology. Developers and investors, he says, need predictable rules to build sustainable platforms. Uncertainty, rather than regulation itself, remains the biggest obstacle to growth.
His comments reflect a pragmatic view shared by many in the industry: Web3 gaming’s success will depend as much on policy frameworks as on technical innovation.
These insights were highlighted in reporting by Cointelegraph Magazine and have been confirmed by the Cointelegraph X account. HOKANEWS has cited this confirmation as part of its broader analysis of Web3 gaming trends, consistent with standard media practices.
While Cointelegraph is a leading source of crypto and blockchain news, the developments discussed align with independent observations across the gaming and technology sectors.
Another factor driving risk-taking in Web3 gaming is competition from traditional game studios. Major publishers are investing heavily in live-service games, esports, and user-generated content platforms, raising player expectations across the board.
To compete, Web3 games must offer more than token rewards. They need compelling narratives, polished mechanics, and social experiences that rival established franchises. Risk-based gameplay is one way developers hope to differentiate themselves while appealing to core gamers.
As 2026 approaches, Web3 gaming stands at a crossroads. Projects that remain cautious may struggle to capture attention in an increasingly crowded market. Those willing to experiment, even at the cost of short-term volatility, could define the next generation of blockchain games.
Axie Infinity’s renewed appetite for risk, Illuvium’s embrace of high-stakes competition, and Yat Siu’s reflections on policy and politics all point to an industry searching for maturity rather than hype.
For players, this evolution promises richer, more challenging experiences. For developers, it represents both opportunity and responsibility. And for the broader crypto ecosystem, it signals that Web3 gaming is no longer content to be a niche experiment.
hokanews.com – Not Just Crypto News. It’s Crypto Culture.
Writer @Ethan
Ethan Collins is a passionate crypto journalist and blockchain enthusiast, always on the hunt for the latest trends shaking up the digital finance world. With a knack for turning complex blockchain developments into engaging, easy-to-understand stories, he keeps readers ahead of the curve in the fast-paced crypto universe. Whether it’s Bitcoin, Ethereum, or emerging altcoins, Ethan dives deep into the markets to uncover insights, rumors, and opportunities that matter to crypto fans everywhere.
Disclaimer:
The articles on HOKANEWS are here to keep you updated on the latest buzz in crypto, tech, and beyond—but they’re not financial advice. We’re sharing info, trends, and insights, not telling you to buy, sell, or invest. Always do your own homework before making any money moves.
HOKANEWS isn’t responsible for any losses, gains, or chaos that might happen if you act on what you read here. Investment decisions should come from your own research—and, ideally, guidance from a qualified financial advisor. Remember: crypto and tech move fast, info changes in a blink, and while we aim for accuracy, we can’t promise it’s 100% complete or up-to-date.
The 1.18 level continues to be a very difficult ceiling to break, and I think that’s your theme going forward. I’m not looking for big moves. I just recognize that there is a bit of a ceiling above that the market can’t seem to rise above, and as a result, I think we probably drift a little bit lower in the short term, but again, not a big move.
The British pound continues to see the 1.35 level offer quite a bit of resistance, and as a result, I think we’re getting to the top of a potential range as well. Again, keep in mind Monday is going to be a lot more realistic read on the environment than Friday, but it does look a bit like the British pound is trying to do everything it can to top out here.
If we were to break above the 1.36 level, that would open up the floodgates to a move to 1.3750, which is possible, but probably not immediately. As things stand right now, I look at this as a market that is in danger of at least rolling over a little bit. I don’t think we fall apart to the downside either, I just think it’s more likely of two scenarios.
The euro is slightly negative against the British pound, but we’re in a very tight range, have been for five or six days now. Quite frankly, this is a market that continues to look at the 0.8750 level as a bit of a ceiling. The 50-day EMA sits there as well and of course, the pound has been stronger than the euro in general, so this is not a huge surprise. I do think we will eventually go lower here and therefore look at short-term rallies as potential selling opportunities in this particular pair.
For a look at all of today’s economic events, check out our economic calendar.
Dietary supplements are among the most widely used health products in the United States, with roughly three-quarters of Americans reporting regular use of at least 1 supplement and an estimated 80,000 to 100,000 products on the market.1 While most consumers view vitamins, minerals, and herbal products as safe and helpful to their health, the FDA’s recent moves are indicating changes in regulations that could significantly change the way users are informed about these products’ restrictions and possibly increase the public health risks.
Under current law, dietary supplement manufacturers must include a conspicuous disclaimer on product labels whenever they make health-related claims. That disclaimer states that the claim “has not been evaluated by the [FDA]” and that the product “is not intended to diagnose, treat, cure, or prevent any disease.”1 These warnings are designed to remind consumers that supplements are not approved for safety or efficacy before sale, unlike prescription medications or over-the-counter drugs.1
In a recent letter to industry, the FDA’s food division head indicated that the agency is thinking of loosening the old regulation that requires the repeated display of such disclaimers on supplement packaging. Instead, companies will only have to put the necessary FDA disclosure once on the label rather than next to each individual health claim. The agency indicates that this change would lessen “label clutter,” save money, and reflect that the current rule has been rarely enforced.
However, the FDA has not established a timeline for formal rulemaking, and the existing requirements will remain unenforced during the review period. The announcement—despite this temporary status—has already ignited a discussion among medical professionals and advocates.
Critics of the proposal, including Pieter Cohen, MD, a physician at Harvard Medical School, warn that reducing the frequency of disclaimers could weaken consumers’ understanding of the products they are buying.1 As Cohen told NBC News, shifting disclaimers from prominent placement could lead to smaller, less noticeable warnings—or ultimately, to consumers overlooking them entirely.1 This concern resonates with long-standing criticisms that supplement labeling already provides insufficient context on product limitations and risks.
Consumer confusion about dietary supplements is not new. By law, supplements are regulated more like foods than drugs and are not subject to premarket approval for safety or effectiveness.2,3 Manufacturers are responsible for ensuring safety and accurate labeling before marketing, but they are not required to provide evidence of efficacy to the FDA prior to sale.3 Consequently, products often reach the marketplace with limited or uneven clinical support for their purported benefits, and adverse events may only emerge through voluntary reporting after widespread use.3
A 2022 review highlights how those statutory limitations in the current regulatory framework hinder the FDA’s ability to assure consumer safety.2 The Dietary Supplement Health and Education Act of 1994 explicitly defines supplements as a unique category of products distinct from conventional food and drug items, limiting FDA’s premarket authority and placing much of the compliance burden on manufacturers.2
The proposed change in labeling rules comes at a time when use of dietary supplements is deeply ingrained in US health practices. With millions relying on these products for perceived immune support, cardiovascular health, energy enhancement, or digestive wellness, the need for clear and accurate information has never been greater.1 Yet, the nature of supplement marketing, where broad claims often go unverified by rigorous clinical trials, means that labeling plays a critical role in guiding consumer expectations and safety.1
Reducing the visibility of disclaimers may increase the likelihood that consumers assume regulatory endorsement of supplement claims. Public health advocates argue that this could erode informed decision-making, particularly among vulnerable populations such as older adults, pregnant people, or those with chronic disease who may be more likely to use multiple supplements concurrently with prescription medications.
Furthermore, critics note that relaxing warning label requirements does not address deeper issues in supplement oversight, such as inconsistent product quality, variable ingredient concentrations, and the presence of undeclared components in some formulations.2 Without stronger safety nets, the regulatory landscape risks favoring industry convenience over consumer protection.
As the FDA evaluates potential regulatory changes, health care professionals, especially pharmacists, must remain vigilant in educating patients about the limitations and risks of dietary supplements. Clinicians should encourage open dialogue about all products patients are taking and emphasize that “natural” does not always equate to “safe.”3 Patients should be advised to consult qualified health care professionals before adding new supplements, especially when managing chronic conditions or taking prescription medications.
Ultimately, the pending regulatory shift serves as a reminder that, in the realm of dietary supplements, consumer literacy and clinical guidance are as critical as any government requirement.
Rongchai Wang
Jan 02, 2026 12:31
MATIC price prediction shows potential 37% upside to $0.52 if bulls break $0.58 resistance, while technical analysis reveals neutral RSI and oversold conditions setting up recovery.
Polygon (MATIC) sits at a critical juncture as we enter 2026, with the token trading at $0.38 and facing a decisive test at the $0.58 resistance level. Our comprehensive MATIC price prediction analysis reveals a cautiously optimistic outlook, supported by upcoming technical catalysts and oversold conditions that could fuel a recovery rally.
• MATIC short-term target (1 week): $0.42 (+10.5%) – targeting the 20-day SMA resistance
• Polygon medium-term forecast (1 month): $0.45-$0.52 range – aligning with analyst consensus
• Key level to break for bullish continuation: $0.58 – critical resistance that unlocks higher targets
• Critical support if bearish: $0.35 – immediate support before deeper correction to $0.33
The latest MATIC price prediction landscape shows a clear divide between short-term caution and long-term optimism. CoinCodex maintains a conservative stance with a $0.1065 target, reflecting current bearish momentum, while CoinLore presents an aggressive $3.66 long-term forecast based on historical crypto cycle analysis.
The analyst consensus gravitates toward the $0.45-$0.52 range for medium-term targets, with Blockchain.News and MEXC News both highlighting this zone as achievable if MATIC can overcome the critical $0.58 resistance. Coinbase’s modest $0.14 five-year projection appears overly conservative given Polygon’s technological developments and ecosystem growth.
The most compelling Polygon forecast comes from CoinMarketCap’s analysis of the AggLayer v0.3 upgrade launching this January, which could significantly boost demand for POL tokens by unifying liquidity across Polygon chains. This technical catalyst provides fundamental support for bullish price predictions.
Current Polygon technical analysis reveals MATIC is positioned in oversold territory with an RSI of 38.00, creating conditions ripe for a bounce. The token trades below all major moving averages, with the 20-day SMA at $0.43 serving as immediate resistance and the 200-day SMA at $0.69 highlighting the longer-term bearish trend.
The MACD histogram at -0.0045 confirms bearish momentum remains intact, but the relatively shallow reading suggests selling pressure may be waning. MATIC’s position within the Bollinger Bands at 0.29 indicates the token is trading in the lower portion of its recent range, often a precursor to mean reversion moves.
Trading volume of $1.07 million on Binance appears subdued, which could work in MATIC’s favor if buying interest emerges, as thin liquidity often amplifies price movements. The daily ATR of $0.03 suggests moderate volatility, providing reasonable risk-reward ratios for position traders.
Our bullish MATIC price prediction centers on a break above $0.58 resistance, which would invalidate the current bearish structure and open the door to the $0.45-$0.52 target zone. The first MATIC price target sits at $0.45, coinciding with the 50-day moving average and representing an 18% gain from current levels.
A sustained move above $0.45 would target the analyst consensus range of $0.52, offering 37% upside potential. This level aligns with the upper Bollinger Band projection and previous support-turned-resistance from late 2025. Technical confirmation would require RSI breaking above 50 and MACD turning positive.
The AggLayer v0.3 upgrade serves as a fundamental catalyst that could drive institutional interest and ecosystem adoption, supporting higher price targets throughout Q1 2026.
The bearish scenario for our MATIC price prediction involves a breakdown below $0.35 immediate support, which would target the strong support zone at $0.33. This level represents the 52-week low and a critical test of investor confidence in Polygon’s long-term prospects.
A break below $0.33 would signal a deeper correction, potentially targeting the $0.28-$0.30 zone based on Fibonacci extensions from the 2025 high. Such a move would require a broader crypto market selloff or negative developments specific to Polygon’s ecosystem.
Risk factors include delayed AggLayer implementation, competitive pressure from alternative L2 solutions, or broader market volatility that could pressure risk assets.
Based on our Polygon technical analysis, the optimal buy or sell MATIC decision involves a tiered approach. Conservative investors should wait for a break above $0.42 (20-day SMA) before initiating positions, targeting the $0.45-$0.52 range with a stop-loss below $0.35.
Aggressive traders can consider accumulating MATIC near current levels around $0.38, using the $0.35 support as a stop-loss level. This approach offers a favorable 3:1 risk-reward ratio targeting $0.45 as the first objective.
Position sizing should reflect the medium confidence level in this Polygon forecast, with exposure limited to 2-3% of portfolio allocation given the technical uncertainties. Dollar-cost averaging into MATIC positions over 2-3 weeks could help mitigate timing risk.
Our comprehensive MATIC price prediction points toward a potential recovery rally targeting the $0.45-$0.52 zone over the next month, contingent on breaking above $0.58 resistance. The combination of oversold technical conditions, upcoming AggLayer upgrade, and analyst consensus supports a cautiously optimistic outlook with medium confidence.
Key indicators to monitor include RSI breaking above 50 for momentum confirmation, MACD turning positive for trend validation, and volume expansion above 2 million to confirm institutional interest. The critical $0.58 resistance level remains the make-or-break point for this Polygon forecast.
Timeline expectations suggest initial moves toward $0.42 within 1-2 weeks, followed by a potential test of $0.45-$0.52 by February 2026 if technical conditions align. Failure to hold $0.35 support would invalidate this bullish thesis and require reassessment of the medium-term outlook.
Image source: Shutterstock
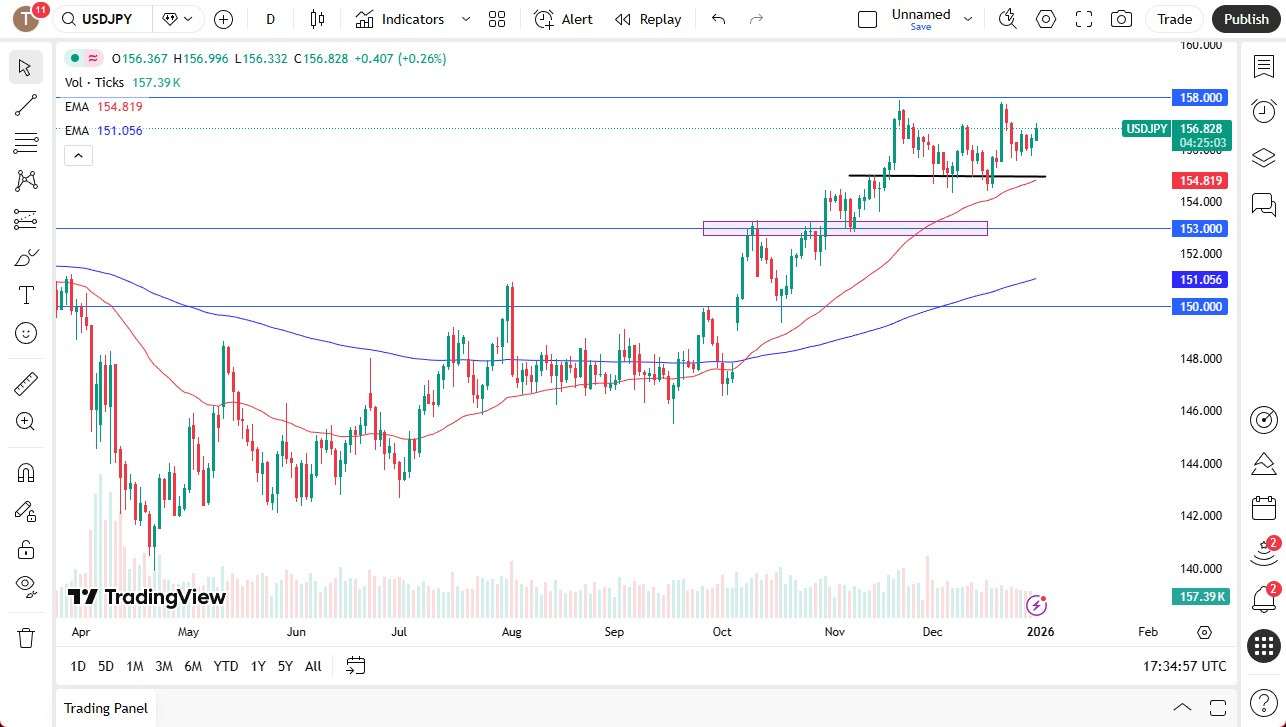
The Bank of Japan is in a situation where it simply cannot tighten monetary policy too much because of the massive amount of debt that the Japanese are currently suffering from. With this being the case, I think you’ve got a situation where you remain buy on the dip as far as your attitude is concerned.

The 50-day EMA reaching the 155 yen level is likely to see quite a bit of support, just as the 158 yen level above is significant resistance. If we can break above there, then it could open up the possibility of a move to the 160 yen level, and I do think that happens sooner or later.
Ultimately, this is a market that I think will continue to be very noisy, but again, as you get paid at the end of every day to hang on to the US dollar against the Japanese yen, I think you need to keep that in the back of your mind.
The market breaking down below the 50-day EMA opens up the possibility of a move down to the 153 yen level, but I don’t think that is the most likely of outcomes. Ultimately, I look at this as a market that continues to favor quite a bit of momentum, but in the meantime, we are just simply working off some of that momentum that we had built up over the last couple of months. I continue to favor the US dollar over the Japanese yen despite the fact that the Federal Reserve is likely to cut rates again.
Want to trade our USD/JPY forex analysis and predictions? Here’s a list of forex brokers in Japan to check out.
Christopher Lewis has been trading Forex and has over 20 years experience in financial markets. Chris has been a regular contributor to Daily Forex since the early days of the site. He writes about Forex for several online publications, including FX Empire, Investing.com, and his own site, aptly named The Trader Guy. Chris favours technical analysis methods to identify his trades and likes to trade equity indices and commodities as well as Forex. He favours a longer-term trading style, and his trades often last for days or weeks.
Choose caffeine-free teas to unwind and promote overall health thanks to their antioxidants and soothing properties.
Chamomile, peppermint, and ginger teas are popular for relaxation, helping digestion, and easing nausea.
Lemon balm and elderberry teas are great for reducing stress, supporting immunity, and offering a delicious flavor experience.
While many folks enjoy tea all year round, snuggling up with a warm cup to read a book or watch a classic movie is a beloved winter pastime. But for as many people who love to partake in these cozy evening activities, there’s an equal amount who are highly sensitive to caffeine—especially when consumed much past lunchtime.
This is where caffeine-free tea really shines. Because while many of the classic tea varieties are caffeinated (like black, green, white, oolong, pu-erh, and red), there are far more decaffeinated versions available to us. And it’s just an added bonus that these teas often boast an array of impressive health benefits.
“In general, tea is most well-known for containing antioxidants, such as flavonoids and catechins, which help combat oxidative stress in the body—and some teas also provide small amounts of minerals, such as potassium, magnesium, and manganese (depending on the type),” says Jamie Adams, MS, RDN, women’s health dietitian. With Adams’ help, we’ve compiled a list of some of the best non-caffeinated teas that are not only comforting on those long, cold winter nights, but also encourage better health.
Jamie Adams, MS, RDN, RPYT, is a registered dietitian and the founder and owner of Mamaste Nutrition
Before diving into our favorites, it’s important to note that there’s actually a difference between decaffeinated and non-caffeinated teas. “When looking for non-caffeinated teas, it should be noted that some decaffeinated teas may still contain some caffeine,” Adams says. “One study found that decaffeinated teas contained less than 12 mg of caffeine per serving, while no caffeine was detected in herbal teas.”
It’s also worth noting that not every cup of tea (even of the same variety) is going to necessarily offer the same exact amount of nutrients. “Steeping time and temperature may impact the amount of antioxidants and other beneficial compounds released from the tea leaves, affecting the overall health benefits of tea,” Adams says. She also adds that pregnant and breastfeeding women should consult with their healthcare provider before drinking herbal teas, as some herbs may not be recommended during this time.
01 of 08
As one of the most popular types of herbal teas, chamomile is often turned to for unwinding after a long day and promoting more restful sleep. “Chamomile tea may also help reduce inflammation and support digestion,” says Adams. These attributes lend this floral tea to supporting immune health as well—perfect for cold and flu season.
02 of 08

The flavor of peppermint is not only festive (especially come winter-time) but it is also positively delicious, refreshing, and health-promoting! “Known for its ability to ease digestive discomfort, bloating, and nausea, it may also help relax muscles and alleviate headaches,” says Adams. Peppermint essential oil, found in its tea, is also associated with sinus congestion relief, ideal for this time of year.
03 of 08

“This has been a life saver throughout my three pregnancies as I navigated morning sickness—ginger is a powerhouse for digestion and nausea relief,” Adams says. “It also contains anti-inflammatory properties and can support immune health.” Its soothing effects on the gastrointestinal tract can be effective in reducing bloating, too. Plus, ginger tea may help to alleviate congestion and wet coughs as an expectorant and airway muscle relaxant.
04 of 08

If you’ve never tried lemon balm tea, it’s worth brewing a cup for its delicate, mild flavor. “Another go-to before bed time, lemon balm tea is mildly citrusy and excellent for relaxation, while helping to reduce stress, anxiety, and insomnia. It’s also believed to support cognitive function and digestion,” Adams says. This herbal tea has been found to be a potent antioxidant as well, reducing inflammation throughout the body and warding off disease-causing free radical molecules. This is thanks, in part, to the impressive amounts of plant compounds it contains, including rosmarinic acid, gallic acid, and flavonoids.
05 of 08

The brilliant deep pink color of hibiscus tea (and its tart, slightly sweet flavor) is hard to miss, earning it a permanent menu spot on many large-chain coffee shop menus. “When I’m looking to stay hydrated throughout my day but want to switch up my water routine, hibiscus tea is a favorite of mine to sip on—it’s vibrant and high in antioxidants, including vitamin C, which supports immune health,” Adams explains. This beloved tea is also rich in quercetin, another potent immune-booster that may also be neuroprotective, according to a 2021 animal study. Hibiscus tea can also encourage better heart health through its impressive ability to support blood pressure and cholesterol regulation.
06 of 08

Green tea is often purported as one of the healthiest beverage choices you can make as a rich source of bioactive plant compounds like epigallocatechin gallate (EGCG), catechins, quercetin, and kaempferol. These offer whole body benefits, supporting heart, gut, immune, and metabolic health. “Decaf green tea offers all the benefits of these antioxidants without the caffeine,” Adams says. “Though it should be noted that decaf green tea may lose much of its antioxidant content after becoming decaffeinated, depending on how it’s processed.”
Generally, higher quality tea brands do a great job of ensuring that as many of these bioactives remain in their green tea through the decaffeination process as possible, however, the best way to be sure is to contact the tea company. It’s also worth noting that as the only decaffeinated option in this round-up, decaf green tea may contain traces of caffeine.
07 of 08

It’s no secret at this point that turmeric is a bonafide superfood, thanks to the positive press the vibrant orange root receives for its notable health benefits. “Turmeric contains a substance called curcumin, an anti-inflammatory compound that supports joint health, digestion, and immune function,” Adams says. Turmeric tea is often combined with ginger, lemon, or honey to amplify its whole body health benefits and enhance its warm, comforting flavor.
08 of 08

You may recognize elderberry as a common ingredient in many cough syrups and immune-boosting supplements—and this is for good reason! This gorgeous dark purple berry is chock-full of phytonutrients (or plant compounds) that reduce inflammation throughout the body as well as promote heart, brain, metabolic and overall immune health. The ingredient has even been found to be beneficial in treating a variety of respiratory illnesses.
Read the original article on Real Simple