The main category of All News Articles.
You can use the search box below to find what you need.
[wd_asp id=1]
The main category of All News Articles.
You can use the search box below to find what you need.
[wd_asp id=1]
EUR/JPY continues its losing streak for the seventh consecutive day, trading around 176.70 during Asian hours on Monday. Technical analysis of the daily chart shows that the currency cross is testing the lower boundary of the descending channel, suggesting the price could either hold support and trigger a temporary bounce toward the channel’s upper limits, or break below it to signal accelerating downward momentum in a steeper downtrend.
The 14-day Relative Strength Index (RSI) at 27.00 signals oversold conditions that could slow the decline but do not yet challenge the prevailing negative bias. The EUR/JPY cross is maintaining a bearish near-term tone as it sits beneath both the nine- and 50-day Exponential Moving Average (EMAs). The pair’s slide below these key averages suggests downside pressure dominates.
A successful break below the lower boundary of the channel around 176.50, followed by an 11-month low of 175.70, recorded in November 2025. Further support lies at the 14-month low of 169.72.
On the upside, the EUR/JPY cross may rebound toward the nine-day EMA at 178.27, followed by the 50-day EMA at 181.34. Further resistance lies at the upper boundary of the descending channel around 184.40, followed by the all-time high of 187.95 set on April 17.
BoJ’s Uchida speech scores 7.2 on FXS Speechtracker, exactly in line with Uchida’s historic average, signaling a stable tone rather than an escalation in policy urgency. The emphasis on AI as a major positive demand shock, pushing up economic activity, prices, and long-term rates via equity gains and bond issuance, tilts the message modestly hawkish for the Yen as it highlights upside risks to inflation and financial conditions.
By stressing that AI affects output gaps, financial conditions, and key “star” variables, Uchida effectively frames AI as a structural force that could justify tighter policy over time if demand-side effects dominate. The caution about correction risks if profits disappoint tempers the hawkish bias, but the commitment to closely monitor AI-driven indicators keeps the balance of risks skewed toward gradual normalization rather than renewed easing, mildly supportive of the Yen.
(The technical analysis of this story was written with the help of an AI tool. Know more.)
The table below shows the percentage change of Euro (EUR) against listed major currencies today. Euro was the weakest against the US Dollar.
| USD | EUR | GBP | JPY | CAD | AUD | NZD | CHF | |
|---|---|---|---|---|---|---|---|---|
| USD | 0.71% | 0.28% | 0.16% | 0.25% | 0.13% | 0.58% | 0.21% | |
| EUR | -0.71% | -0.39% | -0.53% | -0.43% | -0.41% | -0.20% | -0.46% | |
| GBP | -0.28% | 0.39% | -0.13% | -0.02% | 0.00% | 0.17% | -0.07% | |
| JPY | -0.16% | 0.53% | 0.13% | 0.07% | 0.05% | 0.31% | 0.05% | |
| CAD | -0.25% | 0.43% | 0.02% | -0.07% | -0.01% | 0.21% | -0.06% | |
| AUD | -0.13% | 0.41% | 0.00% | -0.05% | 0.01% | 0.20% | -0.06% | |
| NZD | -0.58% | 0.20% | -0.17% | -0.31% | -0.21% | -0.20% | -0.27% | |
| CHF | -0.21% | 0.46% | 0.07% | -0.05% | 0.06% | 0.06% | 0.27% |
The heat map shows percentage changes of major currencies against each other. The base currency is picked from the left column, while the quote currency is picked from the top row. For example, if you pick the Euro from the left column and move along the horizontal line to the US Dollar, the percentage change displayed in the box will represent EUR (base)/USD (quote).
Disclaimer: For information purposes only. Past performance is not indicative of future results.
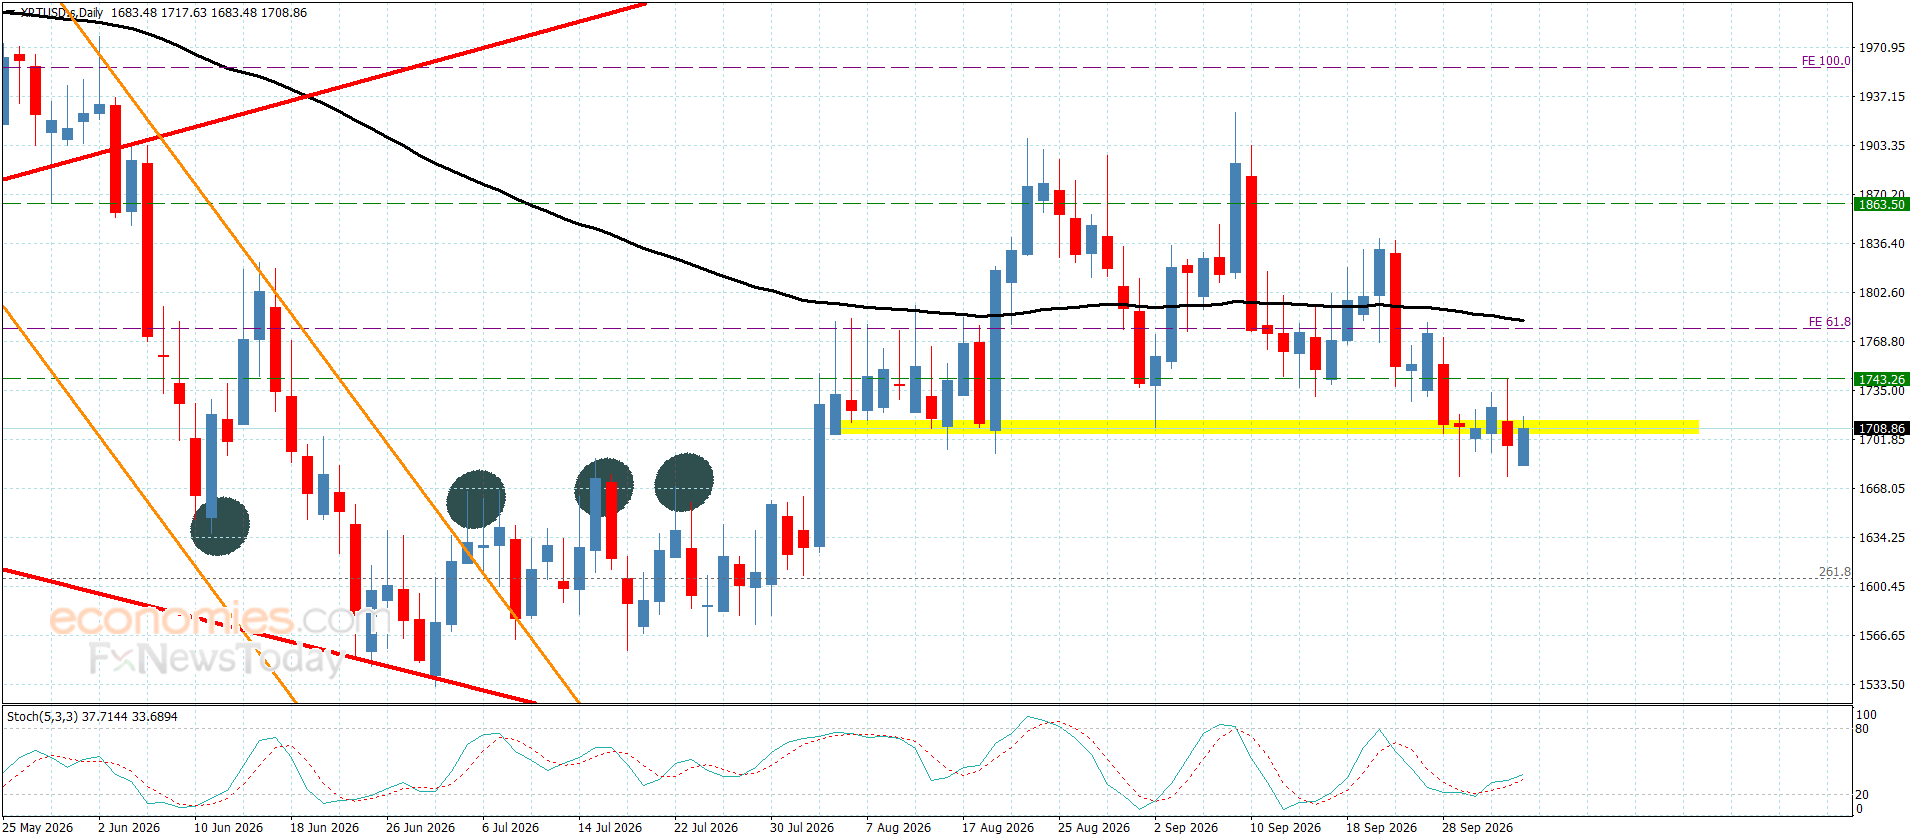
Platinum price faced fresh negative pressure, causing it to incur some losses after touching the $1675.50 level before attempting to test the broken support positioned near $1705.00. We note that a negative close below this support would confirm the price’s readiness to form strong bearish waves, with expectations of initially targeting $1660.00 before attempting to reach the next target at $1605.00.
As for confirming a recovery of the uptrend, the price would need to stage a strong bullish surge and stabilize above the barrier at $1840.00. This would pave the way for further gains, with the price gradually targeting $1880.00 and $1950.00.
The expected trading range for today is between $1660.00 and $1740.00.
Trend forecast: Bearish
Despite the bearish implications of this week’s price action, support has held at $4,111, leaving open the possibility that a decisive rally above Friday’s high could lead to a test of resistance near the falling 20-day moving average near $4,285, which is also close to the week’s high of $4,285, or a minor lower swing high at $4,316. The downtrend prevails unless there is a recovery of the lower swing high and the 50-day moving average, currently near $4,326. Therefore, Friday’s failed push above resistance keeps the bearish structure intact, while a break below $4,103 would provide the next confirmation that the correction is extending lower.
If you’d like to know more about how to trade gold and silver, please visit our educational area.
I wrote on 27th September that the best trades for the week would be:
Long of the S&P 500 Index following a daily close above 7803. This did not set up.
Short of the EUR/USD currency pair following a daily close below 1.1358. This set up on Tuesday and gave a weekly return of 0.78%.
Long of Soybeans. Soybean futures fell by 3.11%.
Long of Ethereum. Ethereum was unchanged over the week.
The total loss of 2.33% averages 0.58% per asset.

A summary of last week’s most important data in the market:
US Core PCE Price Index – this came in lower than expected, at a month-on-month increase of only 0.2% compared to the expected increase of 0.3%. Dovish for the USD.
US Average Hourly Earnings – this came in considerably lower than expected, at a month-on-month increase of only 0.1% compared to the expected increase of 0.3%. Dovish for the USD.
US Final GDP – higher than expected at 2.2% instead of the expected 1.5%. Somewhat hawkish for the USD.
US Non-Farm Employment Change – notably lower than expected. Dovish for the USD.
RBA Cash Rate & Rate Statement – the RBA hiked 0.25%, but the dovish language left it as a dovish hike for the AUD.
Australia CPI (Inflation) – this was expected to rise from an annualized rate of 3.5% to 4.1% but rose only to 4.0%, so this was just fractionally dovish.
US Unemployment Rate – unexpectedly rose a fraction, from 4.1% to 4.2%. Dovish for the USD.
The USD turned more dovish last week as weak US employment data sharply reduced expectations for another near-term Fed increase. CME FedWatch pricing for an October 0.25% rate hike fell from 64.2% a week earlier to roughly 17–23% after payrolls, while futures implied only about 0.22% of total additional tightening through end-2026, down from roughly 0.255% before the jobs report.
US non-farm payrolls rose only 29,000 in September, far below the 90,000 consensus forecast, prior months were revised lower, and unemployment increased to 4.2%. The data pushed Treasury yields lower and supported risk appetite: US equities rallied into Friday, with technology and smaller-cap shares benefiting most, while the USD lost some ground as markets unwound immediate Fed-hike expectations.
Earlier in the week, markets had been dealing with a more inflationary—and USD-supportive—mix: elevated energy prices and higher global government-bond yields, amid the US-Israel/Iran conflict had revived concern that central banks might have to keep policy restrictive. The Fed’s recently hawkish tone, the RBA’s rate hike, and firmer euro-area inflation had reinforced that concern.
Geopolitical risk remained the principal counterweight to the softer US data narrative. The conflict-driven oil shock had helped fuel the bond sell-off, but Friday brought relief as expectations of recovering Middle Eastern supply and discussions of releasing European diesel reserves pushed WTI down 3.7% to $89.43 and Brent down 2.7% to $99.45. Lower crude reduced immediate inflation anxiety, aided bonds and equities, and compounded the post-payrolls dovish repricing of Fed expectations.
Markets ended the week favouring a softer-US-growth / less-imminent-Fed-tightening narrative, weakening the USD’s rate advantage. However, oil and geopolitical developments remain capable of quickly reversing that move by reviving global inflation and rate-hike concerns. We may now be entering a period where risk assets will strengthen, and the US Dollar will begin to decline.
Next week will see very few highly important data items. The coming week’s most important data points, in order of likely importance, are:
FOMC Meeting Minutes
BoJ Governor Ueda Speaks
Canada Unemployment Rate and Employment Change
It is a public holiday in Australia on Monday and in China from Monday to Wednesday.
For the month of September, I made no forecast, as the US Dollar had no real long-term trend.
For the month of October, I forecast that the EUR/USD currency pair will decline in value.
There were no excessive moves in currency crosses last week, so I make no forecast.
Volatility remained low last week, with 19% of the notable currency pairs and crosses moving by more than 1% in value. Next week’s volatility is likely to be similarly low, or maybe even lower.
You can trade these forecasts in a real or demo Forex brokerage account.
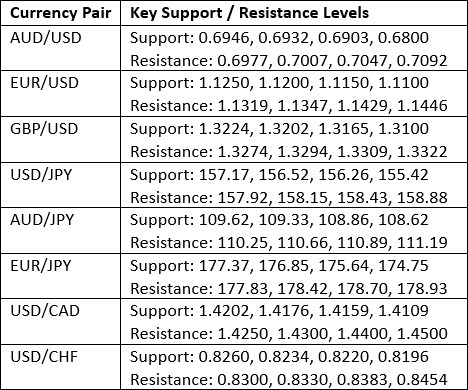
Key Support and Resistance Levels
The US Dollar printed a bullish candlestick of healthy size last week, which reached a new 18-month high and closed above the resistance level at 101.39. This is a significant bullish breakout, and just a few days ago things were looking extremely bullish for the USD, but that may be starting to change with the lower than expected PCE Price Index and Average Hourly Earnings data, which suggest that the US economy is slowing down, and that the Fed only need to make one further hike of 0.25% before the end of 2026.
Despite these dovish factors, it is worth noting that the greenback held up quite well towards the end of last week, even after these data surprises. This is a sign of real strength in the USD, although it may not last.
Turning back again to technical factors, there is a clear long-term bullish trend on most momentum metrics, which gives Dollar bulls a tailwind. Additional supportive factors include relatively high US Treasury Yields, with even the 10-Year reaching well above 5.20%.
I think there are good reasons to take a bullish bias here, but be cautious as this could change, especially if there is any more dovish news for the USD. It might be best to focus on other assets and to just be neutral on the USD over the coming week.
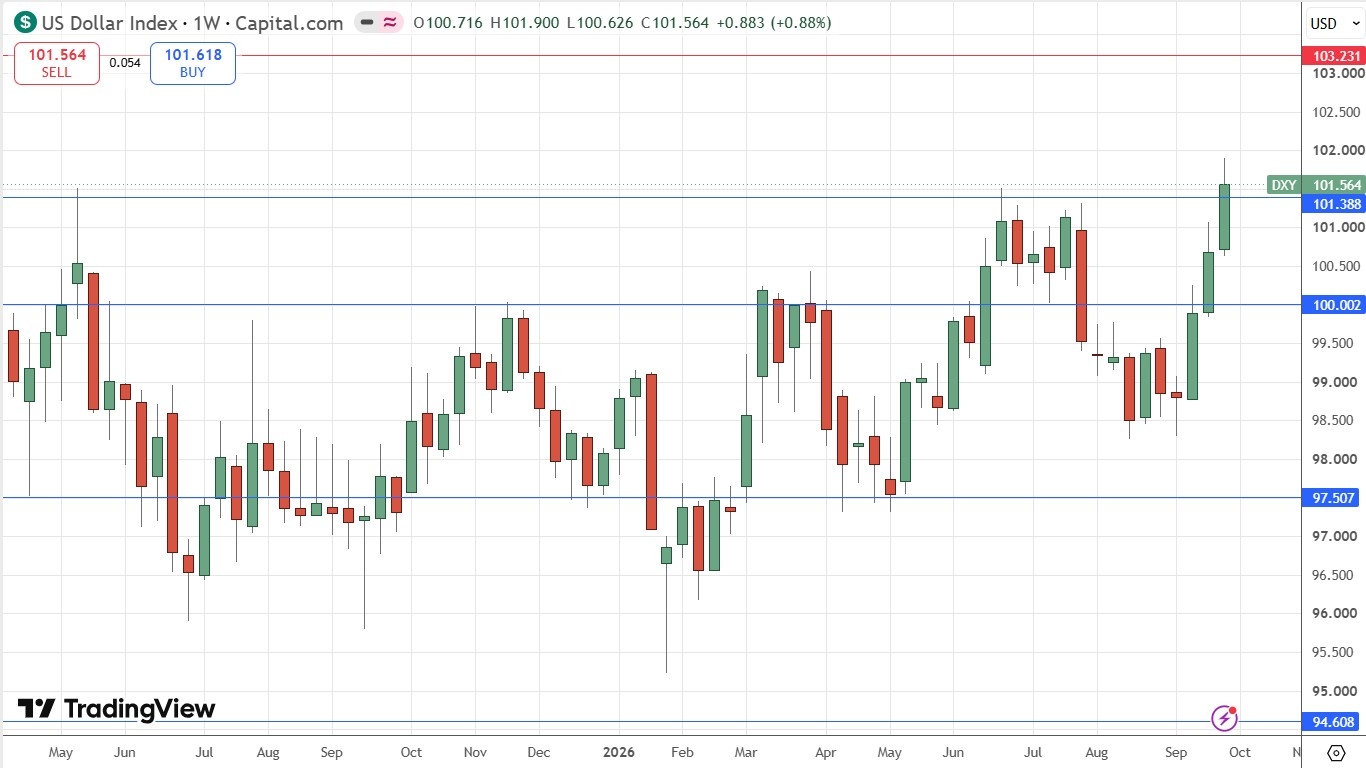
US Dollar Index Weekly Price Chart
The EUR/USD currency pair fell strongly last week, making a significant technical bearish breakdown to a new 16-month low and reaching close to the 1.1200 handle before clawing back some of its losses towards the end of the week.
The Euro weakened mainly because Europe-specific risk overwhelmed the supportive effect of higher euro-area inflation: France’s fiscal concerns triggered a sharp widening of French/German bond spreads, while markets also scaled back expectations of an imminent ECB hike.
The US Dollar has been strong as markets were expecting further rate hikes, although that has evaporated after last weeks US economic data releases which had a dovish impact upon those expectations. Yet the Dollar remained strong even after that.
This currency pair has historically tended to trend very reliably. It also likes to pull back within trends, so when it moves this quickly, that is significant.
Note in the weekly price chart below, how there is a clear sequence of lower highs and lower lows, supporting a bearish interpretation.
It might be somewhat late to enter a new short trade now, but it is worth holding on to this short trade if you are already in it and using a trailing stop – I like to use three times the ATR (100) from the lowest daily close.
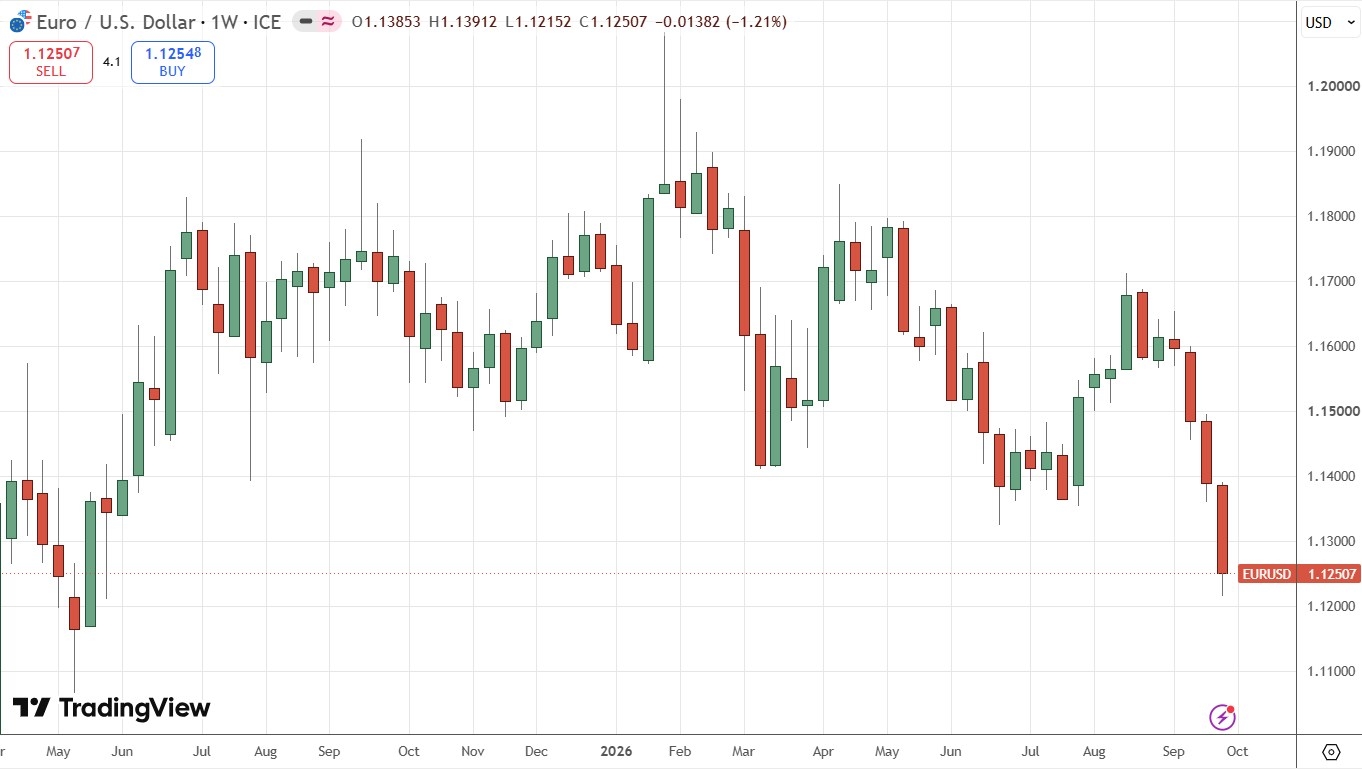
EUR/USD Weekly Price Chart
The tech-based NASDAQ 100 Index briefly reached another short-term high price before pulling back. This is interesting as the broader S&P 500 Index has not been able to make a new record high for a while, so we are seeing tech outperformance, although this is nothing unusual over the long term.
In tech, focus remains on the AI sector and the incredible valuations, although this has started to become a drag as many analysts see that collapses of some companies are bound to start as revenue is not yet matching valuations – prices are being driven by expectations, and many see it as likely that the smaller and more exposed AI companies will start to go under, with the first being a catalyst for more.
Despite that negative outlook, the tape or chart if you prefer, still looks bullish, as can be seen below. The US stock market has historically shown a tendency to keep rising even when analysts start to say it shouldn’t.
As a trend trader, I am long here, but I will not “bet the farm” on tech. However, as we are seeing data which is going to make the Fed less hawkish, I am somewhat more optimistic on the outlook for the US stock market.
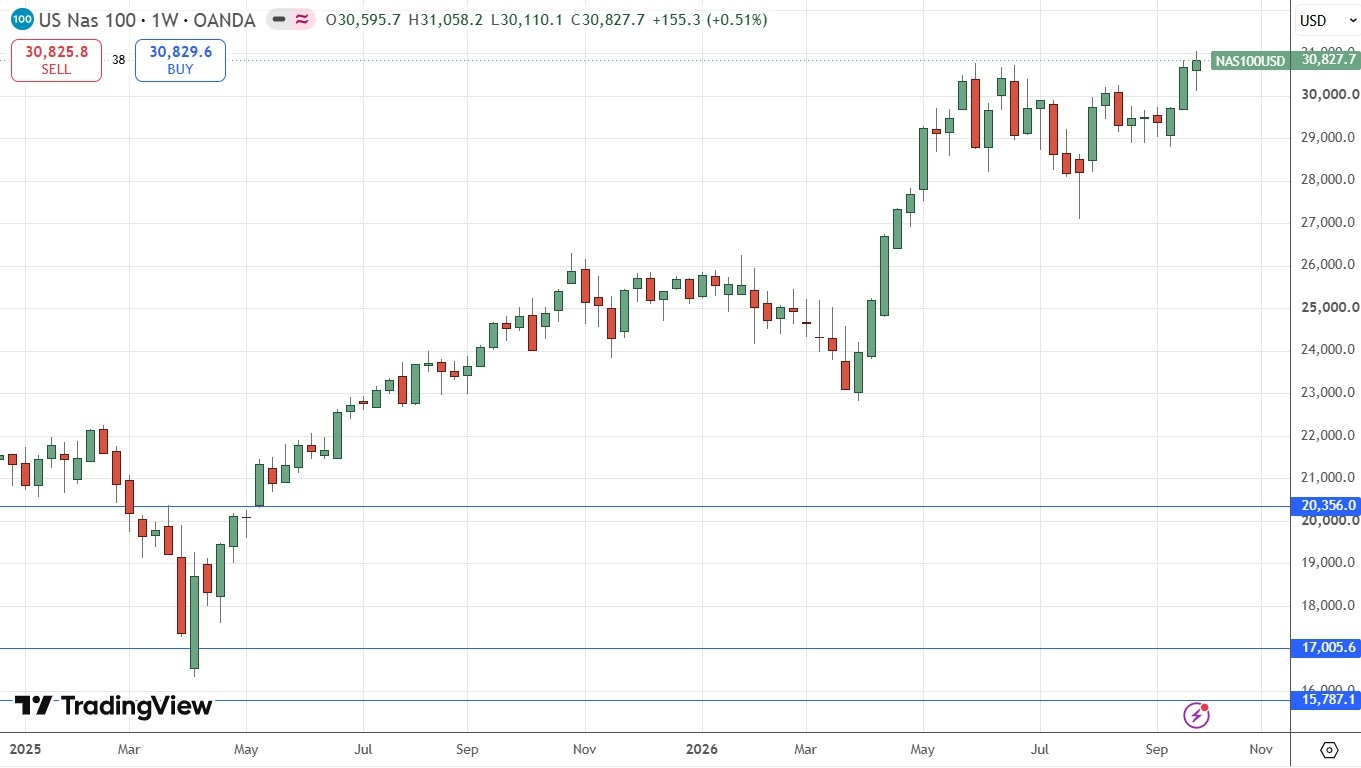
NASDAQ 100 Weekly Price Chart
WTI Crude Oil has reached a very interesting technical point, which suggests higher prices are on the way. The price chart below shows that the key support level at $87.68 has held, and the confluent lower trend line of the ascending price channel evidenced by the linear regression analysis drawn from the end of the major phase of the Iran war has also held. This is significant, and points to the line of least resistance being upwards.
As has been the case for many months, what happens militarily and geopolitically in the Strait of Hormuz and in the Gulf is the main driver here, making trading unpredictable.
It is obvious that President Trump will do all he can to keep the price of crude oil from going overly high, but while the situation with Iran remains unresolved, that is going to be difficult to achieve – it is a Sisyphean task.
Longer-term traders might do well to look for buying opportunities if they think a resumption of the war is going to happen after the mid-terms, but they might need to be quick to take profit, as President Trump tends to make moves pretty quickly to bring down the price of Crude Oil once it exceeds $100.
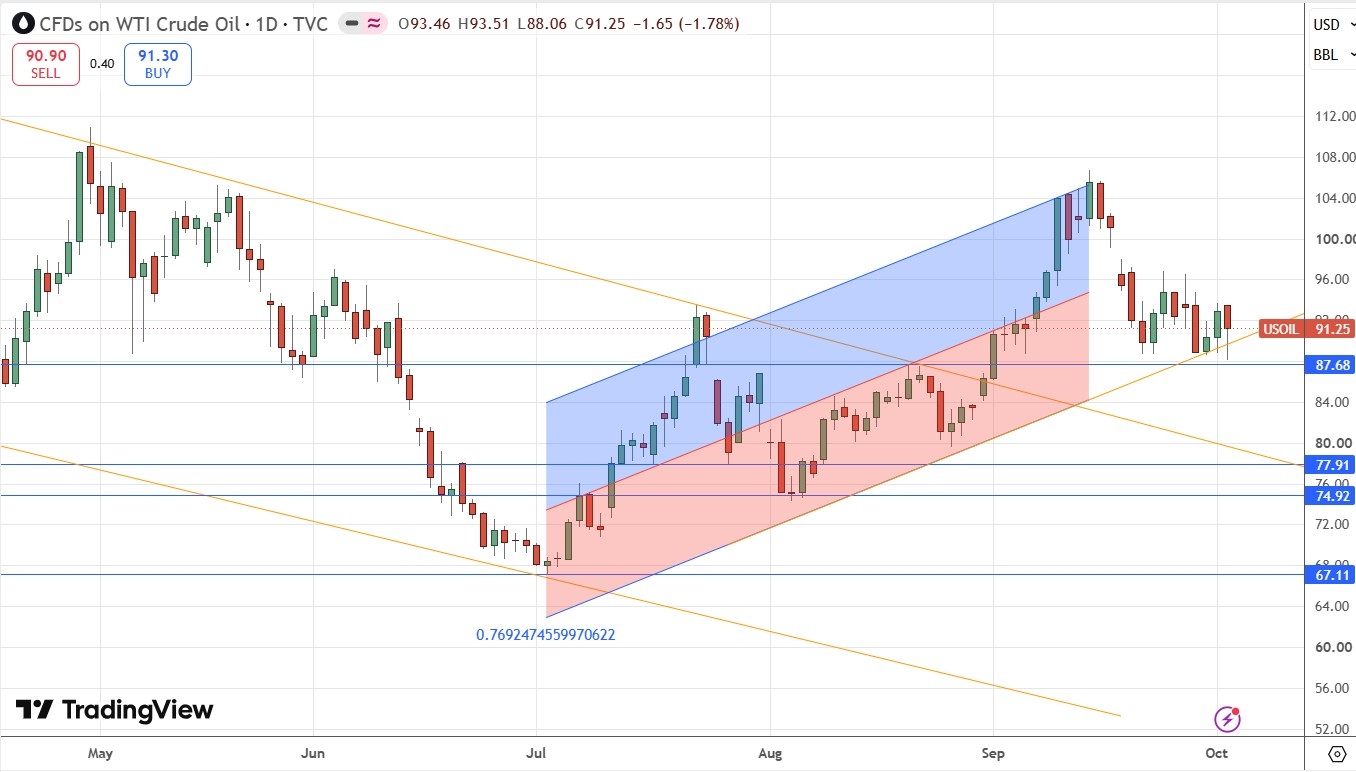
WTI Crude Oil Spot Daily Price Chart
This cryptocurrency has continued to consolidate, and it looks like a tight and exciting consolidation which could produce an explosive breakout to the upside. Look in the daily price chart shown below and note how well the resistance turned support levels are being respected and have been respected.
Many trend traders will already be long, but there is a case for tightening the stop and adding to this position if we get a strongly bullish daily close above $2,800, where a recent high and a round number are confluent.
I don’t think Ethereum is especially useful or even much practical use at all, but it is widely traded and it looks like a great breakout candidate. There are even micro Ethereum futures available at the CME.
I will be holding on to my long Ethereum position.
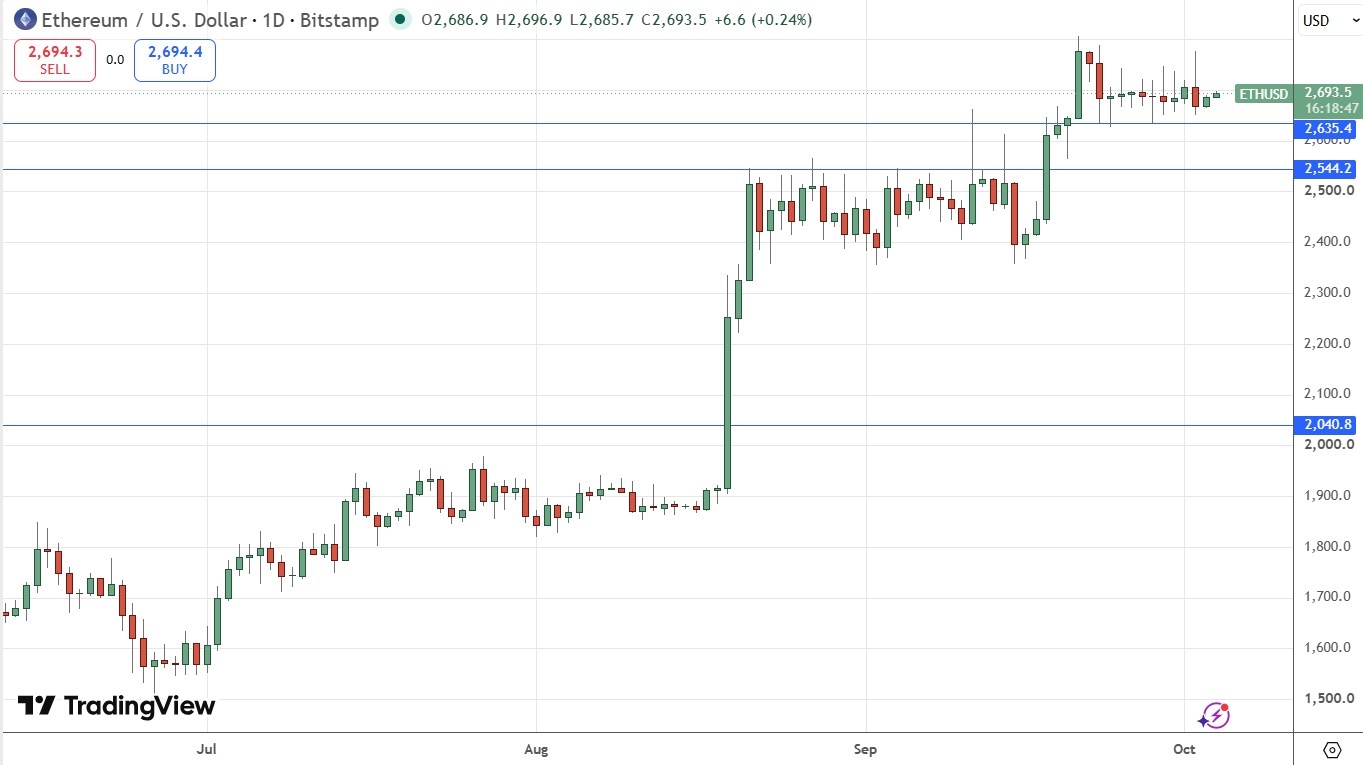
Ethereum Daily Price Chart
I can say all the same things about Bitcoin that I just wrote about Ethereum above. Arguably, Bitcoin is even more important, as it leads the crypto market both psychologically and by market capitalization.
The level to watch for a new entry (adding to the position, if you want to and already have some) is the high at $78,293.
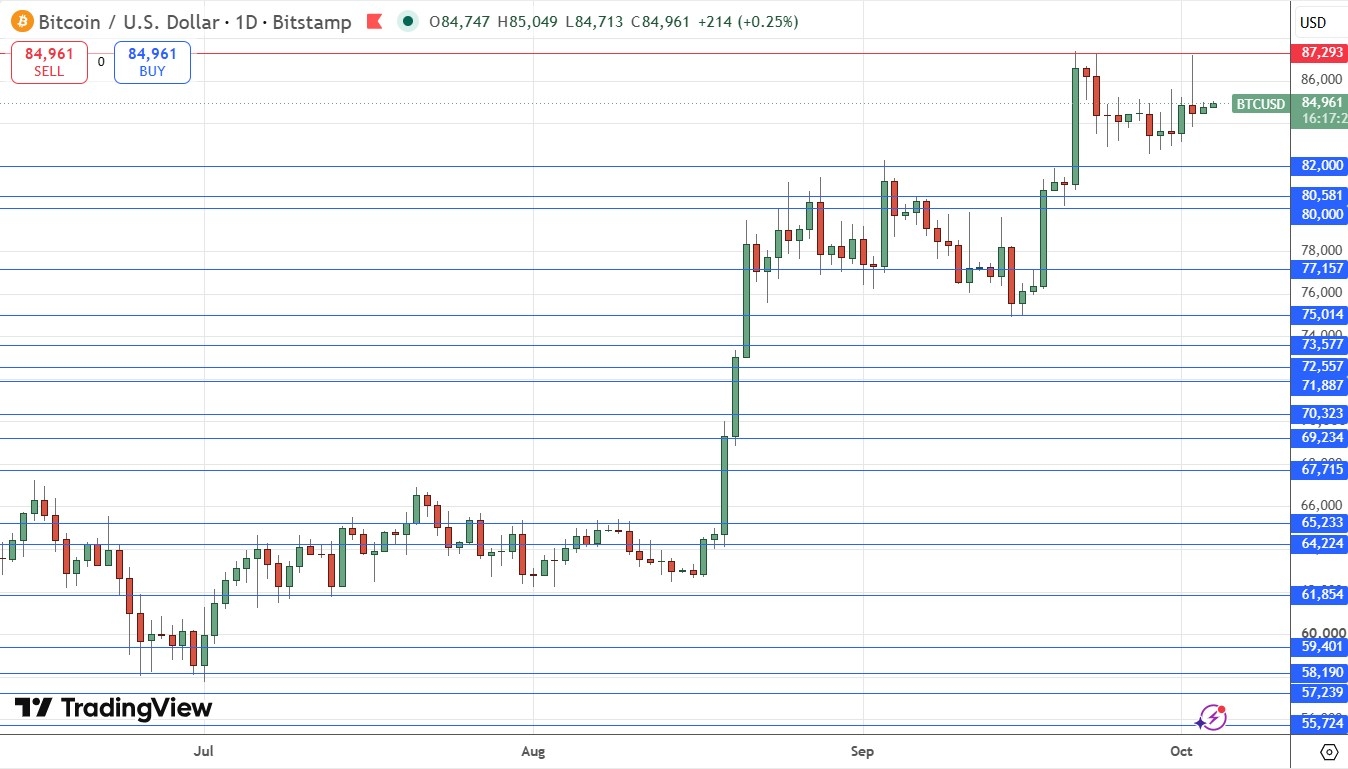
Bitcoin Daily Price Chart
I see the best trades this week as:
Long of the S&P 500 Index following a daily close above 7803.
Long of the NASDAQ 100 Index.
Short of the EUR/USD currency pair.
Long of Bitcoin.
Long of Ethereum.
That being said, it is difficult to get long on crude oil heading into a weekend that could bring anything that we can imagine as far as headlines. I think this is probably something that should be thought about over the next couple of days, and maybe Monday we’ll have more of a clear picture.
The situation in Iran just is never going to end, it seems, and that, of course, has a major influence on what’s going on here.
The British Pound (GBP) is bouncing strongly against the Japanese Yen (JPY) in Wednesday’s early London session, supported by the upward revision of the UK’s Gross Domestic Product (GDP) and a positive surprise in the Current Account. The GBP/JPY has regained most of the ground lost during the early Asian session, trading at 208.00 at the time of writing, after hitting a fresh year-to-date (YTD) low at 206.89.
TMGM Analysis: Financial Market News, Economic Calendar & Market Insights
The UK economy grew at a 0.5% pace in the second quarter, instead of the 0.4% previously estimated, according to final Gross Domestic Product (GDP) figures released earlier in the day. Likewise, the year-on-year (Y-o-Y) reading has been revised up to 1.4% from the 1.2% preliminary reading.
Beyond that, UK Current Account data released at the same time showed that the deficit narrowed unexpectedly to GBP 19.932 billion in Q2 from a downwardly revised GBP 21.12 billion in Q1, against market expectations of a widening gap of GBP 25.6 billion.
Data from Japan has failed to support the Yen on Wednesday. Retail Trade contracted 1.2% in August, after growing 2.1% in July. Industrial Production also disappointed as preliminary data showed a 4.8% decline in August, against the 1.7% growth anticipated by the market consensus and following a 0.5% increase in July,
GBP/JPY has bounced up to 207.90, but the near-term bias remains bearish, with price action holding below a previous trendline support, which will likely act as resistance now. Momentum indicators on 4-hour charts remain within negative territory, with the Relative Strength Index (14) below 40, despite the recent rebound, and the Moving Average Convergence Divergence (MACD) slightly negative, which suggests that the recovery is still frail.
Bulls are facing a cluster of resistances in the 208.30 area, where the mentioned trendline meets the intra-day high. A confirmation above here would boost confidence for bulls and expose the September 27 and 28 highs in the 209.00 area. Further up, the September 22 and 24 highs, near 210.15 seem out of reach for the coming sessions.
On the downside, the Pound has an important support area at 207.00. Below here, the 127.2% Fibonacci retracement of September’s rally, at the 206.00 area, seems like a plausible target.
(The technical analysis of this story was written with the help of an AI tool. Know more.)
The table below shows the percentage change of British Pound (GBP) against listed major currencies today. British Pound was the strongest against the Australian Dollar.
| USD | EUR | GBP | JPY | CAD | AUD | NZD | CHF | |
|---|---|---|---|---|---|---|---|---|
| USD | -0.10% | -0.37% | -0.31% | -0.06% | 0.11% | -0.32% | -0.12% | |
| EUR | 0.10% | -0.24% | -0.21% | 0.03% | 0.20% | -0.22% | -0.02% | |
| GBP | 0.37% | 0.24% | 0.02% | 0.29% | 0.45% | 0.04% | 0.24% | |
| JPY | 0.31% | 0.21% | -0.02% | 0.24% | 0.43% | -0.02% | 0.21% | |
| CAD | 0.06% | -0.03% | -0.29% | -0.24% | 0.18% | -0.25% | -0.04% | |
| AUD | -0.11% | -0.20% | -0.45% | -0.43% | -0.18% | -0.43% | -0.21% | |
| NZD | 0.32% | 0.22% | -0.04% | 0.02% | 0.25% | 0.43% | 0.21% | |
| CHF | 0.12% | 0.02% | -0.24% | -0.21% | 0.04% | 0.21% | -0.21% |
The heat map shows percentage changes of major currencies against each other. The base currency is picked from the left column, while the quote currency is picked from the top row. For example, if you pick the British Pound from the left column and move along the horizontal line to the US Dollar, the percentage change displayed in the box will represent GBP (base)/USD (quote).
The weekly chart shows this week’s range contained within last week’s range, reflecting consolidation on that timeframe. It also provides key support and resistance levels, at $2.912 and $3.18, respectively. Another important development is that this week is set to close above support represented by the 200-week moving average near $2.997 and the 20-week moving average around $2.985.
Both failed to hold as support earlier in the week, but quick reclaims within the week show that support has been retained near those moving averages. Therefore, Friday’s bullish outside day is occurring as natural gas remains above important weekly support, giving the short-term reversal signal a stronger technical foundation.
At 9:15 a.m. Eastern Time today, oil was priced at $103.37 per barrel with Brent serving as the benchmark (we’ll explain different benchmarks later in this article). That’s a gain of $0.39 drop compared with yesterday morning and around $37.41 higher than the price one year ago.
It’s impossible to forecast oil prices with detailed precision. Many different elements affect the market, but ultimately it boils down to supply and demand. When worries about economic recession, war, and other large-scale disruptions increase, oil’s path can shift fast.
Gas prices at the pump don’t only track crude oil. They also include what it takes to refine and move that fuel, the taxes layered on top, and the extra markup your local station adds to stay in business.
Since crude oil generally makes up a majority of the per-gallon cost, changes in its price have an outsized impact. When oil surges, gas prices typically rise in tandem. But when oil retreats, gas prices often lag on the way down, a trend sometimes described as “rockets and feathers.”
In case of emergency, the U.S. has a store of crude oil known as the Strategic Petroleum Reserve. Its primary purpose is energy security in case of disaster (think sanctions, severe storm damage, even war). But it can also go a long way toward softening crippling price hikes during supply shocks.
It’s not a long-term answer and is more meant to provide temporary relief, assisting consumers and keeping critical parts of the economy running, like key industries, emergency services, public transportation, etc.
Both oil and natural gas are key sources of the energy we use every day. Because of this, a big change in oil prices can affect natural gas. For example, if oil prices increase, some industries may swap natural gas for some segments of their operations where possible, which increases demand for natural gas.
To gauge oil’s performance, we often turn to two benchmarks:
Between these two, Brent better represents global oil performance because it prices much of the world’s traded crude. And, it’s often the best way to track historical oil performance. In fact, even the U.S. Energy Information Administration now uses Brent as its primary reference in its Annual Energy Outlook.
Looking at the Brent benchmark across several decades, oil has been anything but steady. It’s seen spikes due to factors such as wars and supply cuts, and it’s also seen crashes from global recessions and an oversupply (called a “glut”). For example:
All to say, oil’s historical performance has been anything but smooth. Again, it’s hugely affected by wars, recessions, OPEC whims, evolving energy initiatives and policies, and much more.
Looking to stay up-to-date regarding the latest energy developments? Check out our recent coverage:
The current price of oil per barrel depends largely on supply and demand, including news about potential future supply and demand (geopolitics, decisions made by OPEC+, etc.). In the U.S., prices also move based on how friendly an administration is to drilling, as it can affect future supply. For example, 2025 saw the Trump administration move to reopen more than 1.5 million acres in the Coastal Plain of the Arctic National Wildlife Refuge for oil and gas leasing, reversing the Biden administration’s policy of limiting oil drilling in the Arctic.
The price of oil updates constantly when the “futures” markets are open. A futures market is effectively an auction where people agree to buy or sell oil in the future. As long as people and companies are trading contracts, the oil price is changing.
In short, shale is rock that contains oil and natural gas. Think of shale as energy yet to be tapped. The more shale the U.S. accesses, the more energy we’ll have—and the more easily oil prices can keep from spiking as much thanks to a greater supply.
When oil is expensive, it tends to make everyday items cost more. This can be related to energy (your heating, gas utilities, etc.), but it’s also due to the logistics involved with making those items accessible to you. Shipping, for example, can affect the price of things at the grocery store, as it’s more expensive to get those products from warehouses and farms onto the shelf.
The article covers the following subjects:
Consider long positions from corrections above 87.70 with a target of 105.17–115.50.
Breakout and consolidation below 87.70 will allow the asset to continue declining to the levels of 79.25–67.00.
On the weekly chart, a descending correction has likely finished developing as the second wave of larger degree (2) and an ascending third wave (3) is forming. On the daily time frame, the first wave of smaller degree 1 of (3) has apparently formed, a downward correction has been completed as the second wave 2 of (3), and the third wave 3 of (3) is developing, with wave i of 3 unfolding as its part. On the H4 time frame, wave (iii) of i is developing, with a local correction completed as wave iv of (iii) within it. If the presumption is correct, WTI will continue to rise to 105.17–115.50 within wave v of (iii). The level of 87.70 is critical in this scenario as a breakout below it will enable the asset to continue declining to the levels of 79.25–67.00.
This forecast is based on the Elliott Wave Theory. When developing trading strategies, it is essential to consider fundamental factors, as the market situation can change at any time.
The content of this article reflects the author’s opinion and does not necessarily reflect the official position of LiteFinance broker. The material published on this page is provided for informational purposes only and should not be considered as the provision of investment advice for the purposes of Directive 2014/65/EU.
According to copyright law, this article is considered intellectual property, which includes a prohibition on copying and distributing it without consent.
– Written by
Minesh Chaudhari
STORY LINK British Pound to Dollar Forecast: Weak Payrolls Ease Pressure on GBP/USD
The Pound to Dollar (GBP/USD) exchange rate came under heavy pressure on Thursday, falling to fresh three-month lows below 1.3200 before stabilising as investors reacted to extreme moves in global bond markets.
GBP/USD touched around 1.3193, its lowest level since June, before recovering modestly.
The 2026 low remains around 1.3140.
Risk appetite deteriorated sharply as bond yields surged across major markets, boosting demand for the Dollar and limiting support for Sterling.
ING had commented; “Expect DXY to remain bid in a 101.50-101.80 range today, but an upside breakout is a possibility should tomorrow’s US data surprise on the upside or should the sell-off in European government debt start to heavily weigh on the euro.”
According to UoB; “GBP has likely entered a range-trading phase, expected to be between 1.3205 and 1.3345.”
Get better rates and lower fees on your next international money transfer.
Compare TorFX with top UK banks in seconds and see how much you could save.
The bond-market rout intensified on Thursday, with the US 10-year Treasury yield climbing above 5.3% and the UK 30-year gilt yield breaking above 6% for the first time since 1998.
The surge in borrowing costs triggered losses across global equity markets and intensified concerns over fiscal sustainability.
AJ Bell investment director Russ Mould commented; “Prime Minister Andy Burnham and Chancellor John Healey already have enough on their plate without a rapid increase in government borrowing costs since they took office. Gilt yields moving at such a pace presents a major challenge for their spending and borrowing plans.”
Friday’s US employment data, however, provided some relief.
Non-farm payrolls increased by just 29,000 in September, far below consensus forecasts of around 90,000.
The unemployment rate also edged higher to 4.2% from 4.1%, while previous payroll estimates were revised lower.
The weak report prompted a sharp retreat in Treasury yields and reduced expectations that the Federal Reserve will raise rates again in October.

Markets cut the implied probability of an October hike to around 20%, compared with close to 40% before the release and roughly 70% last week.
The US 10-year yield retreated towards 5.17% following the figures.
The labour-market figures followed softer-than-expected US inflation data earlier in the week.
Core PCE prices increased 0.2% in August, while the annual rate held at 3.0%.
The data had already encouraged traders to reduce expectations of a back-to-back Federal Reserve rate hike.
National Australia Bank head of FX strategy Ray Attrill commented; “There’s a little bit of comfort to be drawn from the (US PCE) numbers. I think the market’s been right to moderate somewhat its expectations for a back-to-back Fed hike, but I don’t think it necessarily means there aren’t still more Fed hikes ahead.”
The latest payroll figures have strengthened the argument for the Fed to pause in October, although inflation remains above target and policymakers may still consider another increase later in the year.
Attrill had also noted that the Dollar was becoming more sensitive to developments in longer-dated Treasury yields than to immediate policy pricing.
That relationship was evident again on Friday as lower yields triggered a modest Dollar retreat.
For the GBP/USD exchange rate, the 1.3190-1.3200 area remains the immediate downside support zone.
A sustained break below this region would expose the June low around 1.3140.
On the upside, Pound Sterling would need to recover above 1.3250 and then 1.3300 to ease the immediate bearish pressure.
The softer US jobs report has provided some breathing room, but the broader Dollar trend remains supported by high yields, elevated geopolitical risk and continued concerns over global fiscal policy.
International Money Transfer? Ask our resident FX expert a money transfer question or try John’s new, free, no-obligation personal service! ,where he helps every step of the way,
ensuring you get the best exchange rates on your currency requirements.
TAGS: Pound Dollar Forecasts