The main category of All News Articles.
You can use the search box below to find what you need.
[wd_asp id=1]
The main category of All News Articles.
You can use the search box below to find what you need.
[wd_asp id=1]
As of today, Bitcoin USD (BTCUSD) is trading at $87,877.29, experiencing a slight increase of 0.81%. The big question on traders’ minds now is whether Bitcoin can hit the $92,000 mark in the coming months. Let’s break down the current data, trends, and technical indicators to understand the possibilities.
Bitcoin’s current price stands at $87,877.29, with a daily range between $87,349.52 and $88,000. This aligns with a modest rise of 0.81%, or $705.61, over the last 24 hours. Bitcoin is significantly below its 50-day moving average of $91,712.54 and even further from its 200-day average of $107,608.47, indicating potential bearish sentiment in the short term. The market cap is a robust $1.73 trillion, supported by a relatively high volume of $15.16 billion compared to an average of $508 million.
Technical indicators show mixed signals for Bitcoin. The RSI is at 42.91, approaching the oversold territory, suggesting that a rebound might be possible. The MACD, with a value of -2355.42, reveals bearish momentum, but a positive histogram could indicate a potential crossover in the future. The ADX at 34.98 confirms a strong trend, although not specifying direction. The Bollinger Bands suggest that Bitcoin is near its middle band of $89,354.05, hinting at possible sideways movement. Forecasts can change due to macroeconomic shifts, regulations, or unexpected events affecting the crypto market.
Looking ahead, Meyka AI provides several forecasts: the monthly target is $91,771.03, while the quarterly projection is a bullish $137,052.42. However, the yearly prediction dips to $83,932.49, indicating uncertainty in long-term market conditions. Meanwhile, five-year estimates hover around $133,253.33, suggesting potential growth.
Recent news reports continue to highlight Bitcoin’s popularity among traders but emphasize uncertainty due to volatile market conditions. No significant new events have directly impacted Bitcoin in the last 24 hours, beyond slight market fluctuations. The trend, as indicated by volume spikes and technical indicators, underscores the market’s cautious optimism.
Bitcoin’s path to $92,000 is filled with both challenges and opportunities. While current technical indicators show mixed signals, the broader market forecasts suggest potential upside. Traders should remain vigilant, keeping an eye on macroeconomic developments and market trends for further clues about where BTCUSD is headed.
As of now, BTCUSD is priced at $87,877.29 with a 0.81% increase over the last day. Visit our detailed analysis page for more insights here.
Monthly targets are set at $91,771.03, while quarterly forecasts suggest a rise to $137,052.42. Long-term projections estimate a price of $133,253.33 over five years.
Technical indicators present mixed signals. The RSI suggests possible room for a rebound, while the MACD shows bearish momentum, indicating caution is warranted.
Bitcoin’s performance is impacted by various market sentiments and simple updates, with no major events altering its recent trajectory significantly. Volatility remains a key factor.
With mixed technical signals and a cautious yet optimistic market forecast, Bitcoin reaching $92,000 depends on multiple factors including macroeconomic conditions.
Disclaimer:
Cryptocurrency markets are highly volatile. This content is for informational purposes only.
The Forecast Prediction Model is provided for informational purposes only and should not be considered financial advice.
Meyka AI PTY LTD provides market data and sentiment analysis, not financial advice.
Always do your own research and consider consulting a licensed financial advisor before making investment decisions.
Marks & Spencer is launching a range of foods tailored to people taking weight-loss injections as use of the drugs accelerates in the UK.
The new range of 20 “nutrient-dense” products from the retailer is aimed at customers taking GLP-1 weight-loss medications, as supermarkets increasingly adapt to the impact the drugs are having on shopping baskets.
The range will go on sale in M&S foodhalls from January 5 and includes salads, meals and bread designed to deliver high levels of fibre, vitamins and minerals in smaller portions.
There has been a dramatic rise in the use of GLP-1 drugs in the UK. Online searches and private prescriptions have increased sharply, driven by their effectiveness for weight loss and widespread media attention. About 1.5 million people in the UK are now estimated to be accessing GLP-1 treatment privately, while NHS England prescriptions for the injections have risen by around 900 per cent since 2020.
GLP-1 medications — known formally as glucagon-like peptide-1 (GLP-1) receptor agonists — were originally developed to treat type 2 diabetes by helping to regulate blood sugar. In recent years, drugs such as semaglutide (sold as Ozempic for diabetes and Wegovy for weight loss) and tirzepatide (sold as Mounjaro) have surged in popularity for their weight-loss effects, as they suppress appetite, slow digestion and signal fullness to the brain.
• Our writers’ share tips for 2026, plus last year’s winners and losers
Nutrient-dense foods are those that provide a concentrated source of vitamins, minerals, fibre, healthy fats and protein relative to their calorie content. M&S said the range was developed by its nutritionists in consultation with the British Nutrition Foundation, using criteria that ensure each product delivers more nutrients per mouthful.
M&S said the new range had been developed to address the nutritional challenges that can arise when people eat less, whether due to medication, age or lifestyle. A reduced appetite can make it harder to consume enough fibre and essential nutrients, increasing the risk of deficiencies and digestive side effects such as constipation.
Grace Ricotti, M&S head of food nutrition, said: “Our nutrient-dense range is perfect for customers looking to support their health as each recipe is packed with the key nutrients we all need in our diets.
“With the increase in popularity of weight-loss injections, a reduced appetite can mean missing out on important nutrients and that’s why nutrient density is so important. These new meals, snacks and drinks can help everyone get more fibre, vitamins and minerals in their diet.”
Supermarkets and consumer goods companies are increasingly catering to households using the drugs. Morrisons was the first UK supermarket to announce a dedicated “GLP-1 friendly” range, developed with sports nutrition brand Applied Nutrition, under its “Small & Balanced” banner. Nestlé, the consumer goods giant, has launched a frozen food brand in the US aimed at GLP-1 users, while Haleon, the British multinational consumer healthcare company, has introduced a multivitamin designed to help replenish nutrients for people eating less.
The trend is expected to accelerate further as GLP-1 medications move beyond injections. Tablet versions are beginning to reach the market, with US regulators approving an oral version of Wegovy and rival pills expected to follow, potentially widening access to the drugs.
While the drugs are approved for diabetes and obesity treatment, clinicians have raised concerns about the number of people accessing them outside clinical pathways for cosmetic weight loss. The long-term consequences of widespread use are still being studied, particularly as lower calorie intake can increase the risk of nutrient deficiencies if diets are not carefully managed.
Solana price trades below $130 as whale short positions and bearish chart structures keep downside levels around $105 and $78 firmly in focus.
Solana price is trading around the $125–$127 area, but short-term pressure remains heavy as sellers continue to defend overhead resistance and large players position for further downside.
While longer-term optimism around Solana remains intact, recent price action and trader commentary suggest that SOL may not be done correcting yet, with several market watchers pointing to lower support zones before any meaningful recovery attempt.
Solana current price is $127.15, up 2.16% in the last 24 hours. Source: Brave New Coin
Solana price is currently trading near $127, according to data from Brave New Coin. Despite a minor bounce, price remains well below key weekly levels, keeping short-term momentum tilted to the downside.
One of the clearest short-term bearish signals comes from positioning data shared by analyst Ted Pillows. His chart highlights a large trader actively holding short exposure across major assets, including a $43.1 million short position in SOL, alongside significant shorts in Bitcoin and Ethereum.

A major whale continues to hold a $43.1M short position in SOL. Source: Ted Pillows via X
Such positioning suggests that large players are still leaning towards further downside or, at a minimum, continued weakness below resistance. While whale positions do not guarantee immediate follow-through, they often align with prevailing market sentiment. In this case, SOL remains below key resistance zones, making it difficult for upside moves to gain traction.
Until price invalidates this positioning by reclaiming higher levels, the presence of sizeable short exposure keeps the short-term outlook tilted toward caution rather than confidence.
Adding to the downside case, analyst Elite Crypto pointed to a bearish head-and-shoulders pattern forming on Solana’s higher-timeframe chart. According to his analysis, the structure remains intact as long as SOL trades below key resistance, with $105 acting as the critical neckline support.

A bearish head-and-shoulders structure keeps $105 in focus, with a clean breakdown potentially opening the door to a much deeper corrective move. Source: Elite Crypto via X
A decisive break below this level would significantly weaken the broader structure and open the door to a deeper corrective move. Elite Crypto highlighted potential downside targets in the $75–$51 range, suggesting that, if triggered, the correction could extend well beyond a short-term pullback and persist into mid-2026.
While this scenario is conditional, it reinforces why many traders remain defensive at current prices despite recent rebounds.
Another bearish-to-neutral perspective comes from analyst StefanB, who shared that he is only interested in accumulating Solana at much lower levels. His analysis highlights the $78 region, aligning with the 0.786 Fibonacci retracement, as a zone where long-term risk-reward becomes more attractive.

The $78 level stands out as a potential long-term accumulation zone, aligning with the 0.786 Fibonacci retracement where deeper demand could emerge. Source: StefanB via X
This approach implies that current prices may still sit above areas where stronger demand is expected to emerge. Rather than chasing short-term bounces, StefanB’s positioning suggests patience, with bids placed at levels that coincide with historical structure and deeper retracements.
Taken together with the $105 breakdown risk, this frames the current price zone as transitional rather than a confirmed bottom.
While short-term and medium-term signals lean bearish, longer-term charts introduce a conditional bullish element. Analyst ShardiB noted that Solana is currently interacting with its 200-week moving average, a level that has historically acted as major long-term support.

Solana price tests its 200-week moving average, a level that has historically acted as long-term support and could mark an early base if price manages to hold. Source: ShardiB via X
According to the analysis, Solana price is attempting to form a base near this zone, with early signs of a potential weekly bottom candle developing. In previous cycles, sustained holds above the 200-week level have often preceded longer-term recovery phases, though not without extended consolidation.
However, ShardiB also cautioned that failure to hold this area would significantly weaken the long-term outlook, reinforcing that bullish scenarios remain conditional rather than guaranteed.
In the short term, Solana remains vulnerable below key resistance, with downside levels clearly defined. As long as Solana price trades below the $135–$140 region, attention remains on $120 and, more importantly, $105 as critical support levels.
A confirmed break below $105 would increase the probability of a deeper move towards $78, with further downside towards the $75–$51 zone possible if broader market conditions deteriorate. These levels align with multiple market watchers projections and higher-timeframe structures.
On the upside, any meaningful bullish shift would likely require SOL Solana price to hold long-term support and reclaim higher resistance levels over time. Such a move would signal that the corrective phase is transitioning into a broader base-building process rather than immediate trend reversal.
Important DisclaimersFXEmpire is owned and operated by Empire Media Network LTD., Company Registration Number 514641786, registered at 7 Jabotinsky Road, Ramat Gan 5252007, Israel. The content provided on this website includes general news and publications, our personal analysis and opinions, and materials provided by third parties. This content is intended for educational and research purposes only. It does not constitute, and should not be interpreted as, a recommendation or advice to take any action, including making any investment or purchasing any product. Before making any financial decision, you should conduct your own due diligence, exercise your own discretion, and consult with competent advisors. The content on this website is not personally directed to you, and we do not take into account your individual financial situation or needs. The information contained on this website is not necessarily provided in real time, nor is it guaranteed to be accurate. Prices displayed may be provided by market makers and not by exchanges. Any trading or other financial decision you make is entirely your own responsibility, and you must not rely solely on any information provided through the website. FXEmpire does not provide any warranty regarding the accuracy, completeness, or reliability of any information contained on the website and shall bear no responsibility for any trading losses you may incur as a result of using such information. The website may include advertisements and other promotional content. FXEmpire may receive compensation from third parties in connection with such content. FXEmpire does not endorse, recommend, or assume responsibility for the use of any third-party services or websites. Empire Media Network LTD., its employees, officers, subsidiaries, and affiliates shall not be liable for any loss or damage resulting from your use of the website or reliance on the information provided herein.Risk DisclaimersThis website contains information about cryptocurrencies, contracts for difference (CFDs), and other financial instruments, as well as about brokers, exchanges, and other entities trading in such instruments. Both cryptocurrencies and CFDs are complex instruments and involve a high risk of losing money. You should carefully consider whether you understand how these instruments work and whether you can afford to take the high risk of losing your money. FX Empire encourages you to conduct your own research before making any investment decision and to avoid investing in any financial instrument unless you fully understand how it works and the risks involved.
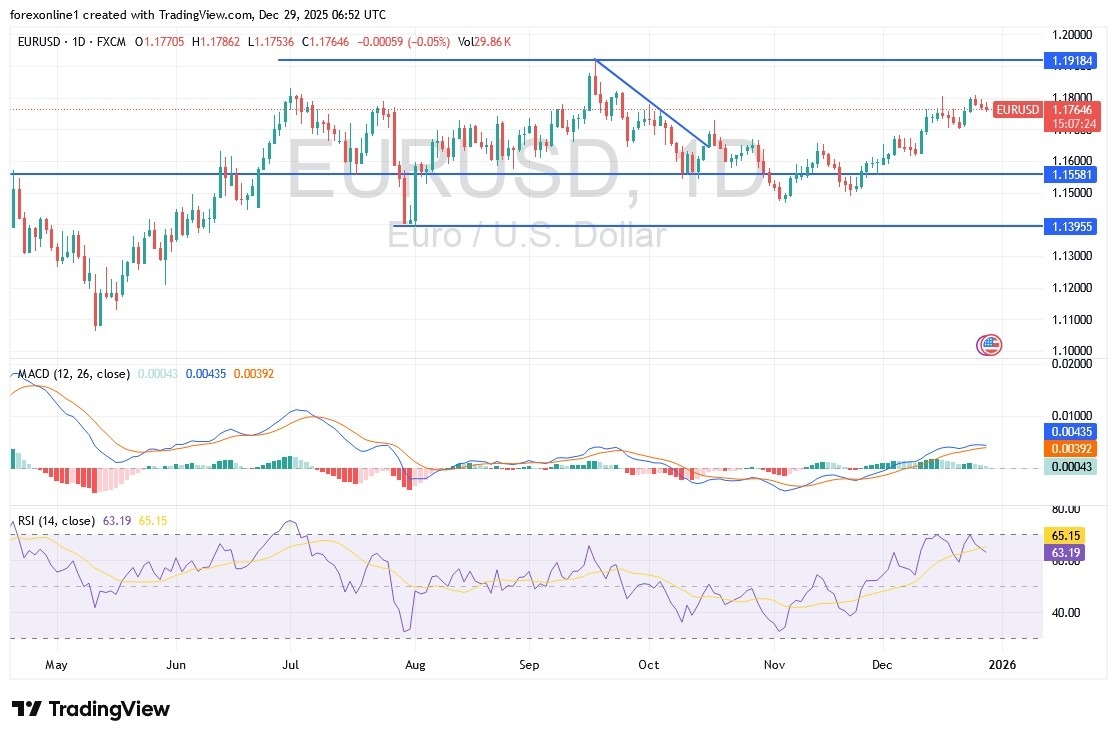
The Euro is stabilizing against the US Dollar (EUR/USD) near the 1.1800 resistance as the final trading days of 2025 begin. This sets the stage for a strong performance heading into 2026. According to top-tier trading platforms, Euro trading has remained positive, fueled by market expectations regarding the future policies of the US Federal Reserve compared to those of the European Central Bank (ECB).
Amidst quiet holiday trading between Christmas and the New Year, the exchange rate settled near 1.1772. The US Dollar remains under pressure despite strong US growth data. Recently, financial markets have shifted their focus toward Federal Reserve policy outlooks and concerns over central bank independence, rather than short-term economic activity indicators.
With long positions on the euro increasing, the potential for further gains may depend on the emergence of new catalysts in early January.

According to forex market trading, the euro (EUR) remained stable in global markets last week, while the dollar remained under pressure despite better-than-expected US GDP data. Consequently, the EUR/USD exchange rate reached its highest level in three months, approaching 1.1810, before settling slightly below 1.18.
Regarding factors influencing currency prices, any developments related to the incoming Federal Reserve Chair and other US central bank officials will be closely monitored. Looking ahead, MUFG Bank anticipates further limited net losses for the dollar in 2026 due to interest rate changes. They stated, “We expect the European Central Bank to maintain its current monetary policy throughout 2026, justifying the EUR/USD exchange rate’s rise in short-term yield movements, given that the Federal Reserve is poised to cut interest rates at least three times, exceeding expectations.”
After an initial stabilization, the bank expects the EUR/USD exchange rate to reach 1.24 by the end of 2026.
Traders advise caution when trading during periods of low market liquidity, a natural reaction to holidays in many financial markets.
According to currency trading experts, the US dollar is likely to remain vulnerable to volatility in global markets until the start of the new year. However, the latest Commitments of Traders (COT) data from the Commodity Futures Trading Commission (CFTC) shows an increase in non-commercial long positions in the euro to nearly 145,000 contracts from 138,000 contracts previously, its highest level in two years. This concentration will increase the risk of a euro correction early next year. Very strong resistance is also likely for the EUR/USD pair on any move towards the psychological resistance level of 1.20.
On the Economic Front, US GDP data for the third quarter showed annualized growth of 4.3%, compared to 3.8% previously, exceeding analysts’ expectations of 3.3%. Consequently, financial markets are currently trading at a probability of less than 15% for another US interest rate cut by the Federal Reserve in January, with two further cuts expected in 2026.
Ready to trade our daily Forex analysis? We’ve made this forex brokers list for you to check out.
Health officials have issued a massive recall of hundreds of products that may be contaminated with rodent feces.
Gold Star Distribution, Inc recalled all FDA-regulated products held at its Minneapolis Facility after the agency found evidence of rodent feces and urine and bird droppings.
The FDA warned that feces and urine contamination can raise the risk of consumers contracting harmful bacteria such as salmonella, which infects over 1million Americans a year and is especially dangerous for those with weakened immune systems such as young children and older adults.
The recall, issued December 26, includes all cold and flu medications, dietary supplements, food, pet food, cosmetics and medical devices from the Minneapolis facility.
The majority of products were distributed to stores in the Minneapolis area, but some were found in Indiana, New York, Illinois and North Dakota.
Affected cold and flu products include DayQuil Cold & Flu, Tylenol Cold & Flu, Tylenol PM, Excedrin, Motrin, Alka-Seltzer Original, Benadryl, Advil Ibuprofen Tablets and Advil PM, among others.
Other recalled products include JIF crunchy peanut butter, Pringles products, Quaker corn meal, Haribo gold bears and peaches, Extra gum products, Gatorade products, Skittles, Gillette razors, Trojan condoms, Purina dog chow, Meow Mix cat products, Colgate toothpaste and Tampax tampons.
The company has previously been cited by the FDA for unsanitary conditions, including for ‘significant rodent activity and insanitary conditions.’ In 2018, the agency sent a warning letter to Gold Star following an inspection of its Minneapolis facility, the same one tied to the most recent recalls.
The recall included products stored at Gold Star Distribution, Inc’s facility in Minneapolis (pictured here)

Affected cold and flu products include DayQuil Cold & Flu, Tylenol Cold & Flu and Tylenol PM, among others
A full list of affected products can be found on the FDA’s website. The recall only applies to products held at the Gold Star facility in Minnesota. It does not affect products shipped directly to retailers.
No illnesses have been reported.
Gold Star said: ‘Products held under insanitary conditions may become contaminated.
‘Exposure to contaminated products can pose serious health risks to consumers, including the potential for bacterial contamination, which may result in illness or infection, including salmonella.’
‘Adverse reactions or quality problems experienced with the use of this product may be reported to the FDA’s MedWatch Adverse Event Reporting program,’ the company added.
Gold Star advised consumers to destroy affected products and provide a receipt of destruction to the company to qualify for a refund.
For verification and a refund, proof of destruction can be sent to Gold Star Distribution at 1000 N Humboldt Ave, Minneapolis, MN 55411.
Consumers with questions can also contact the company at 612-617-9800 any day from 8am to 5pm central time.
In the warning letter to Gold Star following an inspection of its Minneapolis facility, FDA employees wrote that they found ‘significant evidence of rodent activity and insanitary conditions,’ including rodent droppings, rodent fair, gnawed open packaging, live and dead birds, live fruit flies and dead rodents.


Tylenol PM (left) and Excedrin (right) were two products at the Minneapolis facility that were subject to the recall

Haribo gold bears (pictured here) were part of the recall
The roof also ‘appeared to be leaking in several areas of the facility,’ and several products had spilled on to the floor. Bottles of bleach were also ‘leaking onto a pallet of hot sauce crunchy cheese curls,’ and food meant to be refrigerated was in unrefrigerated sections.
It’s unclear if Gold Star responded to the letter.
Salmonella is one of the most common forms of bacteria found in animal feces. Sickening 1.3 million Americans every year, salmonella leads to bloody diarrhea, severe stomach cramps, vomiting and loss of appetite.
While most people recover on their own or have no symptoms, the bacteria can be especially dangerous to young children and the elderly, both of whom have weakened immune systems.
About 420 Americans die from salmonella every year and 26,500 are hospitalized.
E. coli and Campylobacter, which cause similar symptoms as salmonella, also are found in feces.
The FDA urged consumers to contact a physician if they experience symptoms related to using the affected products.
Customers with concerns about their pets who have eaten recalled animal products should contact a veterinarian.
| Company | Address | City |
|---|---|---|
| AFRICAN HALAL DELI, INC | 301 E. LAKE ST. | MINNEAPOLIS |
| AFRIK STORE | 613 CEDAR AVE S. | MINNEAPOLIS |
| AIMMART INTERNATIONAL MARKET | 1435 W. 86TH ST. | Indianapolis |
| AINU SHAMS HALAL FOOD LLC. | 200 W LAKE ST. ST 351 | Minneapolis |
| ASHAMA GROCERY | 804 UNIVERSITY AVE W | ST. PAUL |
| BARAKA GROCERY INC | 1005 N BROADWAY AVE | ROCHESTER |
| BROTHERS IMPORTS | 3012 PILLSBURY AVE SO | MINNEAPOLIS |
| CASPIAN BISTRO RESTAURANT | 2418 UNIVERSITY AVE SE | MINNEAPOLIS |
| CENTRAL MARKET | 3634 CENTRAL AVE NE | MINNEAOLIS |
| CLIFF HALAL MARKET | 1918 E CLIFF RD | Burnsville |
| CLINTON HALAL MARKET | 1930 CLINTON AVE S | MINNEAPOLIS |
| DESI BROTHERS | 8098 MORGAN CIR. SOUTH | Bloomington |
| DURDUR MARKET | 1552 EAST LAKE STR. | MINNEAPOLIS |
| ELLIOT MARKET INC | 1600 CHICAGO AVE | MINNEAPOLIS |
| EP MART INC | 8795 COLUMINE RD | Eden Prairie |
| ETHIO MARKET | 1316 MAYNARD DRIVE WEST | Saint Paul |
| EZ STOP FOOD MARKET | 7641 ZANE AVE | Brooklyn PARK |
| FARGO HALAL MARKET | 855 45TH STREET S. | Fargo |
| FRIENDLY GROCERY & DELI | 537 RICE ST Saint Paul | Saint Paul |
| GHALEY GROCERIES MART | 47 Little Canada Rd E | Saint Paul |
| GOINKH TRADING LLC | 1263 DONAHUE AVE | Saint Paul |
| HALAL FOODS LLC | 13000 ALDRICH AVE SO. | BURNSVILLE |
| HALAL MINI MARKET | 410 CEDAR AVE S | MINNEAPOLIS |
| JERUSALEM MARKET | 4945 CENTRAL N.E | COLUMBIA HGTS |
| JIMMY’S FOOD | 1121 12TH AVE NO. | MINNEAPOLIS |
| KALIS ADULT DAYCARE CENTER | 2301 2ND AVE N. | MINNEAPOLIS |
| KIMIS GROCERY STORE INC | 517 12TH ST. SE | ROCHESTER |
| KISMAYO DISCOUNT STORE | 2932 W DIVISION | Saint Cloud |
| KISMAYO HALAL | 7595 148TH AVE | Apple Valley |
| LA PICANTE MARKET | 7914 BASS LAKE RD | New Hope |
| LAKE STREET MARKET | 201 W LAKE ST. | MINNEAPOLIS |
| MCKNIGHT SHELL GAS | 275 MC KNIGHT RD | ST.PAUL |
| MIDWEST MARKET | 2000 PORTLAND AVE. S | MINNEAPOLIS |
| MILTON HALAL MARKET | 757 MILTON ST N | Saint Paul |
| MINNEAPOLIS HALAL MARKET LLC | 2833 13th AVE SOUTH | MINNEAPOLIS |
| MINNESOTA HALAL MARKET 1926 | CHICAGO AVE. SO | MINNEAPOLIS |
| MZ MARKET | 232 Marshall Road | SHAKOPEE |
| OASIS MARKET AND DELI | 920 E LAKE ST SUITE 145 | Minneapolis |
| OSARI TRADING LLC | 7308 ASPEN LN NORTH | BROOKLYN CENTER |
| PALMS MARKET | 105 85TH AVE NW | COON RAPIDS |
| PANGEA WORLD MARKET | 8500 SPRINGBROOK DR. | COON RAPIDS |
| PANJHA BROTHERS LLC | 3535 WEST ST. GERMAIN STR. | Saint Cloud |
| PEACE MARKET | 923 45TH AVE NE | Hilltop |
| QALINLE FAMILY GROCERY | 117 E SAINT GERMAIN ST | Saint Cloud |
| SHABELLE GROCERY | 2325 EAST FRANKLIN | MINNEAPOLIS |
| ST PAUL GROCERY | 470 LEXINGTON AVE.N | ST.PAUL |
| STAR FOODS | 818 LOWRY AVE. | MINNEAPOLIS |
| STAR OCEAN | 1211 W Pierce Butler Route | Saint Paul |
| SUDAMIC IMPORT & EXPORT INC | 2904 2ND NORTH | MINNEAPOLIS |
| SUNRAY HALAL MARKET | 373 PEDERSEN ST. | Saint Paul |
| SUPER PLAZA HALAL FOODS | 1525 S 4TH ST #100 | MINNEAPOLIS |
| TBS INTERNATIONAL MKT | 7836 PORTLAND AVE. S | Bloomington |
| VIENGCHAN ORIENTAL MKT | 3050 BROOKDALE DRIVE | BROOKLYN CENTER |
| WEST BANK MKT | 417 CEDAR AVE.S. | MINNEAPOLIS |
The Solana price declined after a brief intraday rally. SOL briefly touched $129.3 on December 29 but encountered resistance and reversed, raising questions about the strength of the move.
With holiday-driven volatility increasing, this Solana price prediction examines the key technical levels and potential scenarios for Solana as 2025 comes to a close.
Summary
Solana (SOL) is hovering near $123.2, nearly back to pre-spike levels. It’s down 0.11% today and about 3% for the week, but the selling is light — more of a breather.
Volume’s tapering off on the pullback, and the $120–$130 zone has been a solid support area, often sparking big bounces earlier.
Overall, this gives some perspective on the Solana outlook. Momentum might be slowing a bit in the short term, but buyers are holding key levels, keeping the bigger picture intact.
Bulls need to keep their eyes on $129. If SOL manages a convincing daily close above that, it’d mean momentum’s returning and buyers are running the show. In that case, the recent dip loses its sting, and a rally to $150 and beyond becomes realistic.
Things are still looking okay, but there’s some risk on the downside. The $123–$124 area has repeatedly attracted sellers. SOL’s trading right in that zone, and failing to defend it could push it lower.
Breaking below this area would place $115 on the radar as the next support level. If it fails, short-term momentum is fading, and a seasonal rally might be delayed. That would shift the SOL forecast to cautious, with more sideways or downside likely before it recovers.
SOL’s trading appears to remain in the $120–$130 range for now. Staying above $120 keeps the setup intact and leans bullish, while breaking $129 would improve the SOL price prediction and open the door for a year-end rally.
Gold prices edged sharply lower in the American session on Monday, with the bright metal currently hovering at around $4,330, after flirting with the $4,550 figure at the beginning of the new week. Gold run to record levels continued on the back of diminished US Dollar (USD) demand, exacerbated by thinned market conditions. New Year’s holiday cuts the week in half, and investors seem unwilling to take fresh risk or commit to a certain trend.
The ongoing XAU/USD slump is the result of profit taking, but by no means suggests the rally is over. The USD weakness results from speculation that the Federal Reserve (Fed) will trim interest rates in 2026 by more than what policy makers actually hinted during their December meeting. The Federal Open Market Committee (FOMC) Minutes will be released next Wednesday, and are likely to clarify some of the thinking related to the matter.
In the meantime, Wall Street trades with a negative note, with the three major indexes in the red at the time of writing, also affected by profit-taking.
From a technical perspective, the XAU/USD is not yet bearish. The 4-hour chart shows that the 20-period Simple Moving Average (SMA) turned south above the current level, providing resistance at around $3,382.50. At the same time, the pair stands above the 100- and 200-period SMAs, and in fact, buyers seem to be defending the downside around the shorter one, located at $4,330.81. Meanwhile, technical indicators neared oversold readings and are currently aiming to recover, not enough, however, to confirm a near-term advance.
In the daily chart, XAU/USD bounced after testing a bullish 20-day SMA, which advances above the 100- and 200-day SMAs, with the longer ones retaining their firm upward slopes, all of which hint at buyers holding the grip. The 20-day SMA at $4,309.32 offers nearby dynamic support, while the 100-day SMA stands at $3,924.00. Finally, the Momentum indicator eases, but remains above its midline, while the Relative Strength Index (RSI) eases and stands at 54, confirming a cooldown from prior overbought conditions. A daily close above the 20-day SMA at $4,309.32 would keep buyers in control, whereas a break below that level could expose the 100-day SMA at $3,924.00.
(The technical analysis of this story was written with the help of an AI tool)
Christmas is over and a new year is upon us. Time, then, to start planning your next summer holiday.
Next year, however, you may be more likely to be downing gut health shots and Japanese tea in the airport than the once-traditional morning pints.
Figures from Manchester Airport Group, the biggest in the UK, show soaring numbers of passengers shunning pre-flight booze in favour of more wholesome alternatives.
Sales of matcha, the antioxidant-rich green tea, rose 165% at Manchester, Stansted and East Midlands airports this year as TikTok influencers sold it as the ultimate wellness drink.
Younger travellers were also more likely to sink super smoothies and gut health shots – up 650% and 102% respectively – than £7 airport pints.
And rather than having a skinful in the sky, a social media craze for “skincare in the sky” drove a 399% increase in sales of onboard face masks compared with 2024.
The trends reflect the healthier – and more selfie-conscious – habits of gen Z travellers, defined as those born between 1997 and 2012, with many more of them jetting off on city breaks and retreats than rowdy 18-30 holidays.
Andrew MacMillan, the chief strategy officer at Manchester Airport Group, said this generational shift was transforming habits in the departure lounge: “This data shows the influence of our younger passengers. Generation Z are creating their airport experiences strongly influenced by AI and social media. These travellers both want to follow trends and set them.”
While experts are not yet calling time on pre-flight pints – sales in recent years have risen in line with the growth in passengers – younger travellers are less likely to be filling airport pubs.
Across Manchester, Stansted and East Midlands airports, 61,500 more cups of matcha were sold this year than in 2024. Stansted alone recorded 70,000 sales of the Japanese super-tea this year – almost 200 a day.
One of the year’s must-have accessories – at least, according to TikTok – were Stanley drinks holders, beloved by influencers (they come in an array of colours). More than 10,000 of the £40 Stanley bottles were sold at the three airports this year, up six-fold since they went on sale in 2024.
It is not just social media driving alternative travel habits: AI is increasingly being used as a “virtual travel agent”, according to Manchester Airport Group.
A recent survey found that one in four of its passengers aged under 25 had used or intended to use tools such as ChatGPT to plan their trip.
Travel data also suggests that fewer gen Z travellers are jetting off on boozy 18-30 holidays to party hotspots in the Canary Islands and Mediterranean.
Among the typical 18-30 party places, only Tenerife and Palma made the top 10 destinations for under-25s last year. City breaks to Barcelona, Amsterdam, Dublin and New York were more in demand.
Gen Z are more likely than their elders to venture away from the tourist traps. Figures from the Civil Aviation Authority (CAA) show flights to Albania, Bulgaria and Romania doubled among under-25s last year, partly due to a social media trend for “destination dupes” recommending picturesque places on a budget.
Yet those with more money appear happy to spend it on long-haul travel. The holiday rental firm Airbnb said Buenos Aires in Argentina, Busan in South Korea, João Pessoa in Brazil and Nakano in Japan were the top trending cities among gen Z this year.
Younger Britons may find adventure closer to home, however. The travel magazine National Geographic on Monday picked stargazing in Northumberland as its hottest trip in the world for 2026, ahead of “forest bathing” in Japan and a football pilgrimage across South America. There may be no need for the in-flight face masks after all.
The crypto market is undergoing a deep correction, yet XRP continues to attract investor interest. Funds are reporting steady inflows, and Ripple is expanding its operational footprint across key regions. Together, these developments create a supportive backdrop for XRP’s price outlook.
A key development for XRP emerged as Ripple secured an extended license from the Monetary Authority of Singapore (MAS), allowing the company to expand its range of regulated payment services. Asia is a strategic market for Ripple. The company is building cross-border payment infrastructure in the region and already uses XRP and its RLUSD stablecoin within the Ripple Payments service.
The Asia-Pacific region remains one of the fastest-growing areas in the global crypto economy, with on-chain activity in Asia up roughly 70% year-on-year. In this context, the expanded license strengthens Ripple’s position and increases the likelihood that XRP will be used in a broader set of real-world payment applications.
Ripple is also continuing to scale through acquisitions. In November, the company acquired Palisade, a custody provider aimed at institutional clients. Even so, Ripple remains exposed to overall market conditions, and the winter season for digital assets has begun on a difficult note.
The market experienced a sharp sell-off on December 1. Bitcoin declined to $85,000, and daily liquidations exceeded $600 million. Other cryptocurrencies were affected as well, with XRP dropping from $2.2 to $2.
Despite the turbulence, large investors continued to show strong interest in XRP throughout the past week, and that demand remained firm after the decline. United States spot XRP exchange-traded funds recorded notable inflows. Grayscale and Franklin Templeton attracted more than $120 million on their first day of trading, and the segment has surpassed $580 million in total inflows since launch.
This trend proves that institutional investors view XRP as a token with recovery potential. Inflows have continued even in an environment of heightened volatility, setting XRP apart from most altcoins. New Solana and Ethereum exchange-traded funds have shown less stable momentum.
At the same time, XRP supply on exchanges is declining. Over the past two months, the volume of tokens on centralized platforms has nearly halved, suggesting that holders are moving XRP into long-term storage rather than selling during the correction. As capital flows out of other assets, this creates a favorable supply and demand imbalance that supports XRP’s price during periods of market pressure.
XRP currently benefits from a combination of factors that have historically preceded periods of price strength. With investor interest rising, analysts note that the current XRP price prediction appears more confident than that of many altcoins. Following the recent sell-off, the asset quickly returned to prior demand levels, and market dynamics indicate heightened buyer activity.
The shift toward more active accumulation is a noteworthy signal for XRP’s future trajectory. After sharp declines, such bursts of buying often form the early stage of a reversal, as market participants begin accumulating without waiting for a deeper correction. Similar patterns have marked the beginning of previous upward moves in XRP, and the market is now showing a comparable structure.
Spot market activity adds further support. Trading volumes are increasing, and buyers hold a dominant position. These periods often form the base for a new upward leg, reinforcing analysts’ optimism. In this environment, many expect that if current momentum continues, XRP could retest its recent local highs and extend its recovery following the latest downturn.
In a volatile market, XRP stands out as one of the few assets maintaining steady interest from institutional investors and commercial partners. Ripple’s expansion in Asia, inflows into United States XRP exchange-traded funds, and renewed spot-market demand provide the token with a foundation that many competitors currently lack. This combination allows XRP to navigate market turbulence more effectively and creates conditions that support further growth.
Despite sharp market swings in early December, XRP retained the confidence of key investor groups, including institutional funds and Ripple’s corporate clients across the Asia-Pacific region. If these trends persist, XRP is likely to be among the first assets to recover after the correction. In this context, even conservative forecasts for the token appear more resilient than those of most altcoins.