The main category of All News Articles.
You can use the search box below to find what you need.
[wd_asp id=1]
The main category of All News Articles.
You can use the search box below to find what you need.
[wd_asp id=1]
The British Pound (GBP) trades slightly lower against the Japanese Yen (JPY) on Wednesday, though thin holiday trading conditions are keeping price action contained within a tight range. At the time of writing, GBP/JPY trades around 210.60, holding firm near year-to-date highs and its highest level since August 2008.
The Japanese Yen has remained broadly weak this year, as fiscal concerns under the new leadership of Sanae Takaichi and a gradual pace of monetary policy normalisation continued to weigh on the currency. Against this backdrop, GBP/JPY is up around 6.9% year to date, reflecting persistent policy divergence between the UK and Japan.
From a technical perspective, the daily chart continues to reflect a strong uptrend, marked by a clear sequence of higher highs and higher lows, with prices holding comfortably above key moving averages.
That said, the Relative Strength Index (RSI) is easing from overbought territory and hovers around 68, signalling a risk of a mild pullback or consolidation before the next leg higher. A sustained recovery could see the pair push beyond the 212.00 handle, extending the broader bullish trend.
On the downside, initial support is seen in the 208.50-208.00 zone, where the 21-day Simple Moving Average (SMA) sits near 208.13. A decisive break below this short-term average would weaken the bullish structure and open the door for a deeper pullback toward the 50-day SMA around 205.22, followed by the 100-day SMA near 202.57.
Meanwhile, the Average Directional Index (ADX) is holding near 27, signalling that the trend remains strong, even as momentum cools in the near term.
The Pound Sterling (GBP) is the oldest currency in the world (886 AD) and the official currency of the United Kingdom. It is the fourth most traded unit for foreign exchange (FX) in the world, accounting for 12% of all transactions, averaging $630 billion a day, according to 2022 data.
Its key trading pairs are GBP/USD, also known as ‘Cable’, which accounts for 11% of FX, GBP/JPY, or the ‘Dragon’ as it is known by traders (3%), and EUR/GBP (2%). The Pound Sterling is issued by the Bank of England (BoE).
The single most important factor influencing the value of the Pound Sterling is monetary policy decided by the Bank of England. The BoE bases its decisions on whether it has achieved its primary goal of “price stability” – a steady inflation rate of around 2%. Its primary tool for achieving this is the adjustment of interest rates.
When inflation is too high, the BoE will try to rein it in by raising interest rates, making it more expensive for people and businesses to access credit. This is generally positive for GBP, as higher interest rates make the UK a more attractive place for global investors to park their money.
When inflation falls too low it is a sign economic growth is slowing. In this scenario, the BoE will consider lowering interest rates to cheapen credit so businesses will borrow more to invest in growth-generating projects.
Data releases gauge the health of the economy and can impact the value of the Pound Sterling. Indicators such as GDP, Manufacturing and Services PMIs, and employment can all influence the direction of the GBP.
A strong economy is good for Sterling. Not only does it attract more foreign investment but it may encourage the BoE to put up interest rates, which will directly strengthen GBP. Otherwise, if economic data is weak, the Pound Sterling is likely to fall.
Another significant data release for the Pound Sterling is the Trade Balance. This indicator measures the difference between what a country earns from its exports and what it spends on imports over a given period.
If a country produces highly sought-after exports, its currency will benefit purely from the extra demand created from foreign buyers seeking to purchase these goods. Therefore, a positive net Trade Balance strengthens a currency and vice versa for a negative balance.
A summary of the current discussions in consumer health and wellness on the topic of LULUTOX Detox Tea
Lulutox

New York City, NY, Dec. 24, 2025 (GLOBE NEWSWIRE) — With the ongoing popularity of digestive wellness and daily detox in the popular health and lifestyle discourse, the consumer-facing media has begun to take a closer look at how the topic of herbal supplements is framed, regulated, and interpreted by the general public. In this respect, LULUTOX Detox Tea has declared a modification of its official site, which will help to present a more definite picture of its caffeine-free herbal tea supplement and its purpose as a component of a general wellness program.
Visit Now Official Site
The update of the site is in the context of the ongoing consumer interest in the products that are placed in the digestive balance and internal cleansing. Instead of launching a new formulation or product line, the update is aimed at the availability of information, ingredient disclosure, and use recommendations to people who want to learn more about non-prescription herbal supplements.
Broadening: Digestive Health and Social Welfare regarding the Detox Practices
Within the last few years, the issue of digestive health acquired the leading position in the list of the activity of the wellness discussion because of lifestyle changes, diet, stress, and the increased popularity of gut-related disorders, such as bloating and irregular digestion. As a result, many solutions such as altering diet and probiotics and herbal teas are researched by a large population to get them more at ease within their digestive system.
LULUTOX Detox Tea Explore It To Know More
The detox teas, specifically, are in a specialized niche in this landscape. Historically linked with herbal traditions, these teas are commonly placed as mild, routine-based supplements instead of intensive cleansing protocols. The role of consumer reporting in 2025 is likely to focus more on the need to make a difference between the traditional wellness products and medical interventions as the level of scrutiny of the health claims by the population is expected to increase.
LULUTOX Detox Tea is mentioned in the context of this general discussion as a caffeine-free herbal tea supplement that is to be used on a daily basis. Consumer coverage does not define the product as a medical treatment, therapeutic solution, or a replacement of professional healthcare.
The Web Site Revision and Its Object
The updated LULUTOX site, according to publicly available information, is to display more structured and accessible information on the formulation of the product, its preparation, and overall usage. The update is an indication of a wider trend in the supplement industry towards more direct communication and consumer education.

Ali Charts, a popular on-chain analyst, said data shows that large Bitcoin holders, commonly known as whales, have been net sellers throughout the past year, as per a report. According to the analyst, whale holdings declined by 161,294 BTC over the last 12 months, a move he said typically appears before or during deeper market corrections rather than after prices have bottomed, as per a Zycrypto report.
He wrote in an X post, “The 1-year change in Bitcoin whale holdings is −161,294 $BTC,” adding, “That tells us whales have been net sellers over the last year. This behavior usually shows up before or during deeper corrections, not after bottoms,” as quoted by Zycrypto.
Also read:
Despite posting multiple new all-time highs this year, Bitcoin’s performance has been uneven, with several sharp flash crashes linked to heavy selling by large holders. At current levels, the cryptocurrency is hovering around $87,000, but market sentiment has become increasingly fragile as bearish pressure returns.
In total, whales are estimated to have sold about 161,294 BTC in 2025, worth roughly $15 billion, as per the Zycrypto report. Much of this selling occurred during key market moments, weighing on the bullish narrative. If the trend extends into 2026, analysts suggest it could be difficult for Bitcoin to achieve a sustained recovery.
Also read: Top Republican suddenly emerges as serious 2028 threat to JD Vance’s White House ambitions
Ali noted that heavy selling by whales often signals either an upcoming correction or the continuation of a bearish trend. In contrast, strong buying activity from large holders is typically associated with the early stages of bull markets, something that has been largely absent over the past year.
However, not all large investors have been selling. Medium-sized holders, often referred to as “sharks” and defined as wallets holding between 100 and 1,000 BTC, have been net buyers throughout the year. Their accumulation has helped absorb some of the pressure created by whale selling and has fueled speculation that market influence is slowly shifting away from legacy whales toward a broader base of participants, as per the Zycrypto report.
Even after the sell-off, whales still control more than 2 million BTC, giving them significant influence over price movements. Still, there are limits to how much they can sell, and the market’s ability to withstand sustained distribution in 2025 has highlighted Bitcoin’s resilience.
Looking ahead to 2026, analysts are expected to closely monitor whale activity for clues about the market’s next direction. A slowdown in selling, even if temporary, could provide short-term relief for bullish investors, while continued distribution may keep pressure on prices in the months ahead.
How much Bitcoin did whales sell in 2025?
About 161,294 BTC, worth roughly $15 billion.
How much Bitcoin do whales still control?
More than 2 million BTC.
Gold (XAU/USD) retreats slightly from a fresh all-time peak, around the $4,526 area touched earlier this Wednesday, and trades with a negative bias during the first half of the European session. The precious metal currently trades around the $4,485 region, down 0.25% for the day, though the downside seems limited amid a supportive fundamental backdrop.
Dovish US Federal Reserve (Fed) expectations might keep a lid on the US Dollar’s (USD) modest intraday bounce from its lowest level since early October and act as a tailwind for the non-yielding Gold. Apart from this, rising geopolitical uncertainties could benefit the safe-haven bullion and contribute to limiting the downside, warranting caution for aggressive bearish traders.
The Relative Strength Index (RSI) is flashing extremely overbought conditions on the daily chart. This, in turn, prompts some profit-taking around the XAU/USD, especially after the latest leg up to a series of new record highs since the beginning of this week. The broader technical setup, however, favors bullish traders and backs the case for the emergence of some dip-buyers around the Gold.
An ascending channel guides the uptrend, with price stretching above its upper boundary near $4,430.50. The 50-day Simple Moving Average (SMA) rises steadily, and the XAU/USD holds above it, reinforcing a bullish tone. The Moving Average Convergence Divergence (MACD) line stands above the Signal line in positive territory, and the widening histogram suggests strengthening momentum.
With the XAU/USD holding above the channel cap, pullbacks would be cushioned by the 50-day SMA at $4,167.09. As long as MACD remains above zero and its histogram stays positive, bulls would retain control. RSI remains elevated, highlighting stretched conditions, yet the broader trend stays higher while the price holds over dynamic support. Hence, a pause would not derail the uptrend.
(The technical analysis of this story was written with the help of an AI tool)
Monetary policy in the US is shaped by the Federal Reserve (Fed). The Fed has two mandates: to achieve price stability and foster full employment. Its primary tool to achieve these goals is by adjusting interest rates.
When prices are rising too quickly and inflation is above the Fed’s 2% target, it raises interest rates, increasing borrowing costs throughout the economy. This results in a stronger US Dollar (USD) as it makes the US a more attractive place for international investors to park their money.
When inflation falls below 2% or the Unemployment Rate is too high, the Fed may lower interest rates to encourage borrowing, which weighs on the Greenback.
The Federal Reserve (Fed) holds eight policy meetings a year, where the Federal Open Market Committee (FOMC) assesses economic conditions and makes monetary policy decisions.
The FOMC is attended by twelve Fed officials – the seven members of the Board of Governors, the president of the Federal Reserve Bank of New York, and four of the remaining eleven regional Reserve Bank presidents, who serve one-year terms on a rotating basis.
In extreme situations, the Federal Reserve may resort to a policy named Quantitative Easing (QE). QE is the process by which the Fed substantially increases the flow of credit in a stuck financial system.
It is a non-standard policy measure used during crises or when inflation is extremely low. It was the Fed’s weapon of choice during the Great Financial Crisis in 2008. It involves the Fed printing more Dollars and using them to buy high grade bonds from financial institutions. QE usually weakens the US Dollar.
Quantitative tightening (QT) is the reverse process of QE, whereby the Federal Reserve stops buying bonds from financial institutions and does not reinvest the principal from the bonds it holds maturing, to purchase new bonds. It is usually positive for the value of the US Dollar.
EUR/JPY extends its losses for the third successive session, trading around 183.70 during the European hours on Wednesday. The currency cross remains within the ascending channel pattern, suggesting a persistent bullish bias. Additionally, the 14-day Relative Strength Index (RSI) sits at 62.20, easing from overbought yet still supportive of positive momentum.
The EUR/JPY cross holds above the nine-day Exponential Moving Average (EMA) and the 50-day EMA, with both averages rising and confirming a bullish structure. The short-term average remains above the medium-term gauge, keeping the upside bias in place. The broader tone favors dip-buying while price holds over the rising 50-day EMA.
The EUR/JPY cross may rebound toward the all-time high of 184.95, which was recorded on December 22, aligned with the psychological level of 185.00. Further advances would support the currency cross to test the upper boundary of the ascending channel around 185.70.
The immediate support lies at the nine-day EMA of 183.37, followed by the lower ascending channel boundary. A break below the channel would weaken the bullish bias and put downward pressure on the pair to test the two-week low of 181.57, recorded on December 17. Further declines would open the doors for the currency cross to explore the region around the 50-day EMA at 180.15.
The table below shows the percentage change of Euro (EUR) against listed major currencies today. Euro was the weakest against the Japanese Yen.
| USD | EUR | GBP | JPY | CAD | AUD | NZD | CHF | |
|---|---|---|---|---|---|---|---|---|
| USD | -0.08% | -0.17% | -0.36% | -0.11% | -0.17% | -0.12% | -0.16% | |
| EUR | 0.08% | -0.09% | -0.29% | -0.04% | -0.09% | -0.04% | -0.08% | |
| GBP | 0.17% | 0.09% | -0.21% | 0.04% | -0.00% | 0.05% | 0.00% | |
| JPY | 0.36% | 0.29% | 0.21% | 0.26% | 0.19% | 0.24% | 0.21% | |
| CAD | 0.11% | 0.04% | -0.04% | -0.26% | -0.07% | -0.02% | -0.04% | |
| AUD | 0.17% | 0.09% | 0.00% | -0.19% | 0.07% | 0.05% | -0.02% | |
| NZD | 0.12% | 0.04% | -0.05% | -0.24% | 0.02% | -0.05% | -0.04% | |
| CHF | 0.16% | 0.08% | -0.01% | -0.21% | 0.04% | 0.02% | 0.04% |
The heat map shows percentage changes of major currencies against each other. The base currency is picked from the left column, while the quote currency is picked from the top row. For example, if you pick the Euro from the left column and move along the horizontal line to the US Dollar, the percentage change displayed in the box will represent EUR (base)/USD (quote).
(The technical analysis of this story was written with the help of an AI tool.)
In recent years, there has been growing concern about the rising prevalence of metabolic syndrome among youth, particularly those who are overweight or obese. This complex condition encompasses a cluster of risk factors including increased blood pressure, high blood sugar levels, excess body fat around the waist, and abnormal cholesterol levels. These risk factors are not only detrimental to physical health but also contribute to severe long-term consequences, such as cardiovascular disease and type 2 diabetes. As researchers strive to find effective interventions to combat this troubling trend, the role of microbiome-modulating supplements has emerged as a focal point of investigation.
A recent meta-analysis conducted by researchers Xie, Liu, and Wong delves into the potential of these supplements to manage metabolic syndrome risk factors in overweight and obese youth. This comprehensive analysis, which appears in BMC Pediatrics, employs the GRADE assessment framework to evaluate the quality of evidence surrounding these interventions. The findings of this study underline the importance of exploring innovative and effective strategies to counteract one of the most pressing public health crises of our time.
The human microbiome, comprising trillions of microorganisms that inhabit the gut, has been shown to play a significant role in various metabolic processes. An imbalance in this microbiome can lead to metabolic dysregulation, thereby increasing the likelihood of developing metabolic syndrome. The authors argue that microbiome-modulating supplements—ranging from probiotics and prebiotics to synbiotics—hold promise as a means to restore this balance and potentially mitigate health risks.
The relevance of this research is underscored by alarming statistics. The World Health Organization has reported a dramatic rise in obesity rates among children and adolescents over the past two decades. As the prevalence of overweight and obesity escalates, so too do the associated health risks. This meta-analysis aims to provide insights into how dietary supplementation can serve as an adjunct to traditional lifestyle interventions, offering a new frontier in the prevention and management of metabolic syndrome.
The study synthesizes existing data from a variety of clinical trials, focusing particularly on the effectiveness of different types of microbiome-modulating supplements. Notably, it draws attention to the variability in outcomes based on the type of supplement used. Some probiotics have been found to produce favorable outcomes in terms of weight management and metabolic health, while others may have little to no effect. This highlights the necessity for personalization when it comes to supplementation strategies.
Moreover, the GRADE assessment framework used in the meta-analysis enhances the credibility of the findings by systematically evaluating the quality of evidence. Researchers analyzed factors such as study design, risk of bias, and consistency of results across trials. This level of scrutiny is vital for establishing a robust understanding of the effects and limitations of microbiome-modulating supplements. It provides a clearer picture for healthcare professionals looking to recommend treatment options for obese youth.
Interestingly, the analysis also explores the potential mechanisms behind how these supplements exert their effects. By modulating the gut microbiota, these supplements can improve metabolic pathways, reduce inflammation, and enhance insulin sensitivity. Understanding these mechanisms is crucial for developing targeted interventions and informing clinical practice.
Furthermore, the meta-analysis emphasizes the importance of integrating microbiome-modulating supplements into broader lifestyle management strategies. Individuals who combine supplementation with dietary changes and physical activity are likely to experience more significant improvements in metabolic health. This holistic approach not only addresses the immediate concerns surrounding metabolic syndrome but also fosters sustainable health-related behaviors.
Another aspect worth noting is the potential benefits beyond metabolic health. The interplay between gut health and mental well-being is increasingly recognized, with emerging research suggesting that a healthy microbiome may positively influence mood and cognitive function. This connection adds another layer of significance to the exploration of microbiome-modulating supplements, as it opens doors to multi-faceted health benefits for overweight and obese youth.
As researchers continue to uncover the intricacies of the microbiome, it is essential for ongoing studies to assess the long-term effects of supplementation on metabolic health. Ensuring that findings are consistent across diverse populations and age groups will enhance the relevance and applicability of interventions.
Public health initiatives can greatly benefit from insights gained from this meta-analysis, providing a pathway for informed strategies to combat the ongoing epidemic of childhood obesity and metabolic syndrome. Policymakers, healthcare providers, and parents alike are urged to consider the implications of these findings as they navigate interventions aimed at improving young individuals’ health.
This investigation into the role of microbiome-modulating supplements is a vital step toward addressing the public health challenge at hand. As obesity and metabolic syndrome continue to burden our youth, understanding and utilizing emerging therapeutic options can pave the way for healthier futures.
The integration of scientific research and clinical practice is essential for developing effective strategies. As researchers push the boundaries of knowledge about the microbiome, the potential for transformative change in the health outcomes of overweight and obese youth becomes ever clearer. Future studies will undoubtedly provide further insights, but this meta-analysis lays a strong foundation for understanding the promising role these supplements can play.
In conclusion, as the healthcare community grapples with the rising tide of metabolic syndrome among youth, the findings presented in this meta-analysis are both timely and significant. By elucidating the role of microbiome-modulating supplements, researchers provide hope for more effective management of this concerning health challenge. With continued investigation and actionable insights, there is potential for substantial advancements in improving the health of future generations.
Subject of Research: The role of microbiome-modulating supplements in managing metabolic syndrome risk factors among overweight and obese youth.
Article Title: The role of microbiome-modulating supplements in managing metabolic syndrome risk factors among overweight and obese youth: a GRADE-assessed meta-analysis.
Article References:
Xie, J., Liu, S. & Wong, X. The role of microbiome-modulating supplements in managing metabolic syndrome risk factors among overweight and obese youth: a GRADE-assessed meta-analysis.
BMC Pediatr 25, 991 (2025). https://doi.org/10.1186/s12887-025-06319-8
Image Credits: AI Generated
DOI: https://doi.org/10.1186/s12887-025-06319-8
Keywords: microbiome, metabolic syndrome, overweight youth, obesity, probiotics, prebiotics, synbiotics, dietary supplements
Tags: cardiovascular disease risk in youthevidence-based microbiome researchGRADE assessment in health studiesgut microbiome and metabolisminnovative health strategies for youthinterventions for youth healthmicrobiome supplements for metabolic syndromeoverweight youth health interventionspublic health crisis of metabolic syndromerole of gut bacteria in obesitytype 2 diabetes prevention strategiesyouth obesity and metabolic syndrome
Updated: Dec. 24, 2025, 11:00 (UTC)
XRP (Ripple) is trading around $1.86 at 11:00 on Dec. 24, 2025, slipping roughly ~1% versus the previous close as year-end liquidity thins and traders keep the spotlight on two nearby levels: $1.85 as the immediate downside “line in the sand,” and $1.90 as the ceiling that keeps rejecting rebounds. [1]
The price action may feel muted, but it’s happening alongside a busy news cycle for XRP: a new yield product designed for XRP holders, continued debate around ETF flow data and institutional demand, and fresh attention on Ripple-linked on-chain transfers—each adding fuel to the tug-of-war between dip buyers and sellers into strength. [2]
Because crypto trades 24/7 and pricing differs slightly across venues, the cleanest way to describe XRP “price today at 11:00” is as a tight band in the mid-$1.80s.
Here’s what major data sources show for Dec. 24, 2025:
What that means in plain terms: XRP is not in a dramatic breakout or crash today—yet. Instead, it’s compressing into a narrow battlefield, where even small moves can look bigger than usual because holiday conditions often reduce participation and make technical levels more “sticky.” [7]
One of the most repeated observations across today’s technical commentary is that XRP’s rebounds are getting sold near $1.90, and that matters because it turns the market into a “range trade” rather than a trend.
A CoinDesk market note (reposted by MEXC) describes sellers active near $1.90, with attention shifting toward the $1.85 area after short-term support weakened—plus unusually concentrated volume when price rejected higher levels, hinting that larger participants were selling into strength rather than chasing the upside. [8]
Coingape’s market roundup tells a similar story: XRP fell toward $1.86 after failing to clear $1.90, and the rejection increased selling pressure. [9]
Bottom line: When the market repeatedly fails at the same level, it becomes self-fulfilling—more traders place orders around that zone, which can intensify the next reaction.
One of the most notable XRP-specific headlines today is the debut of earnXRP, positioned as a way for XRP holders to earn yield without selling their spot exposure.
According to CoinDesk coverage reposted by MEXC, Upshift, Clearstar, and Flare unveiled earnXRP, describing it as a vault that aims to simplify DeFi-style return strategies and pay yields denominated in XRP. The same report says users deposit FXRP (an over-collateralized representation of XRP on Flare) and receive earnXRP as a receipt token representing their share and yield. [10]
Despite the “new product” catalyst, XRP’s price has mostly moved in line with the broader crypto tape—suggesting that, at least intraday, traders are still treating XRP as part of a wider risk basket rather than repricing it aggressively on the news. [11]
Several Dec. 24 analyses frame XRP’s current moment as a tug-of-war between institutional-style demand signals and persistent distribution by large holders.
Whether every data point implies the same conclusion is exactly why price is “stuck”: the market is digesting bullish narratives (institutional access, inflows) while also seeing bearish behavior (distribution, weak momentum).
Adding to today’s nervousness, Coinpedia reports that Whale Alert flagged a transfer of 65 million XRP (valued in that report at roughly $121 million) from a Ripple-linked address to an “unknown wallet,” sparking renewed sell-off speculation. [15]
At the same time, even that coverage cautions that large Ripple-linked movements have occurred historically for operational reasons—treasury management, liquidity, partnerships—so the existence of a large transfer alone does not prove imminent selling. [16]
Why it matters anyway: In thin holiday markets, uncertainty can move faster than facts. Big transfers amplify short-term fear, which can pressure leveraged traders even if no direct spot selling follows.
Across today’s coverage, several price zones come up repeatedly:
A CoinDesk note (via MEXC) summarizes the current tape in a very trader-friendly way: “sell rallies into $1.90, buy dips near $1.86.” [21]
A more constructive intraday-to-short-term outlook typically requires:
If that happens during holiday-thinned conditions, price can move quickly—because fewer resting orders can mean less “friction” once a level breaks.
The risk case is straightforward:
BeInCrypto explicitly warns about downside risk if support fails, framing $1.85 as important and suggesting a drop toward lower levels if the market deteriorates. [26]
Forecasts vary widely in crypto, so the most responsible way to read them is as scenario maps, not promises. Still, several models and outlets updated projections around today’s price levels:
A noteworthy nuance from today’s CoinDesk-reposted piece: analytics firm Santiment is cited saying that unusually negative social sentiment around XRP has historically preceded rebounds (a contrarian signal), though that does not guarantee timing. [31]
If you’re following XRP price today and over the next few sessions, these are the practical “tells” traders watch most:
At 11:00 today (Dec. 24, 2025), XRP price is hovering around $1.86, down modestly on the day, with the market locked in a familiar pattern: buyers defending the mid-$1.80s while sellers cap rebounds near $1.90. [37]
The news backdrop is active—yield products, institutional flow narratives, whale activity, and on-chain transfers—but the chart suggests traders still want confirmation (a clean break of support or resistance) before committing to a bigger directional move.
Information in this article is for informational purposes only and is not financial advice. Crypto assets are volatile; prices can change rapidly.
1. www.investing.com, 2. www.mexc.co, 3. www.investing.com, 4. www.investing.com, 5. coinmarketcap.com, 6. coinmarketcap.com, 7. www.mexc.co, 8. www.mexc.co, 9. coingape.com, 10. www.mexc.co, 11. www.mexc.co, 12. www.coinspeaker.com, 13. www.fxleaders.com, 14. beincrypto.com, 15. coinpedia.org, 16. coinpedia.org, 17. www.mexc.co, 18. www.fxleaders.com, 19. coingape.com, 20. beincrypto.com, 21. www.mexc.co, 22. www.mexc.co, 23. www.mexc.co, 24. coingape.com, 25. www.fxleaders.com, 26. beincrypto.com, 27. changelly.com, 28. www.binance.com, 29. beincrypto.com, 30. www.mexc.co, 31. www.mexc.co, 32. www.mexc.co, 33. www.mexc.co, 34. www.mexc.co, 35. www.coinspeaker.com, 36. coinpedia.org, 37. www.investing.com
NEW YORK/LONDON/SINGAPORE — Dec. 24, 2025 — U.S. natural gas futures were softer in holiday-thinned Christmas Eve trading, giving back part of Tuesday’s sharp rebound as traders reassessed near-term weather forecasts, the durability of record LNG-driven demand, and the winter storage trajectory.
By late morning, NYMEX Henry Hub natural gas futures were trading around $4.29 per MMBtu, down from the prior close near $4.41, with prices moving inside a session range roughly spanning the low-$4.20s to the mid-$4.50s. [1]
That pullback comes after a dramatic “risk-on” reset earlier in the week. On Tuesday, front-month U.S. gas futures surged roughly 4% amid record-high feedgas flows to U.S. LNG export plants and expectations for higher demand in the next two weeks. [2]
The story of natural gas on December 24, 2025 is less about a single headline and more about the market’s tug-of-war:
The result: volatile, sometimes abrupt swings that can look outsized relative to the fundamental change on any one update—particularly in a shortened, lightly staffed session.
Weather remains the primary near-term catalyst because it changes residential and commercial heating demand faster than production can respond.
Recent industry tracking shows demand has already eased from early-December highs, with heating degree days (HDDs) down week-over-week in the latest readings—one reason futures have struggled to hold the most aggressive winter premium. [3]
At the same time, the U.S. government’s baseline forecast still leans firm for the winter as a whole. In its latest Short-Term Energy Outlook (released Dec. 9), the U.S. Energy Information Administration (EIA) raised its winter view and now expects the Henry Hub spot price to average around $4.30/MMBtu this winter (Nov–Mar), citing colder-than-expected December conditions. [4]
The EIA also notes it is assuming December HDDs are 8% above the 10-year average, a meaningful demand tailwind—though it also expects milder-than-normal weather in early 2026 to help cool prices after winter. [5]
The modern U.S. gas market increasingly trades like a hybrid of domestic utility fuel and global seaborne commodity—and LNG is the bridge.
On Tuesday, Reuters-reported market coverage highlighted record flows to LNG export plants, with average feedgas flows to major facilities rising to about 18.5 Bcf/d so far this month, above the prior monthly record. [6]
EIA’s weekly market update underscores just how large the LNG channel has become: in the week ending Dec. 17, 33 LNG vessels departed U.S. ports with a combined capacity of about 126 Bcf. [7]
Even with strong flows today, the market is increasingly focused on whether U.S. LNG economics remain compelling if domestic gas prices rise while global benchmark prices soften.
Reuters analysis earlier this month described a margin squeeze: Henry Hub prices have risen while European and Asian prices eased, narrowing the spread that supports U.S. LNG profitability. [8]
For now, LNG demand is still acting as a stabilizer for U.S. prices. But this margin discussion is important because it frames the key “next-level” risk: if the spread compresses far enough, exports become the release valve.
Storage is the market’s scoreboard in winter. The latest EIA weekly update (covering the report week ending Dec. 17) showed:
The EIA’s broader winter outlook expects December to be a heavy withdrawal month. It forecasts 580 Bcf withdrawn during December, about 28% above the five-year average for the month, and projects end-of-winter storage near 2,000 Bcf (about 9% above the five-year average). [10]
This is why even modest shifts in temperature guidance can move prices sharply: storage draws compound quickly during cold spells, and futures reprice the end-of-winter level in real time.
Record or near-record production has been the market’s counterweight to winter weather risk.
One reason the supply story still looks resilient: U.S. drillers have not meaningfully pulled back activity in a way that would suggest imminent supply stress. In Baker Hughes’ holiday-adjusted rig count update, U.S. firms held gas rigs around 127, with total oil-and-gas rigs rising slightly week-over-week (though still down year-over-year). [11]
The EIA also expects U.S. output to remain high into next year: it projects dry natural gas production averaging about 109 Bcf/d in 2026, up from 2025 levels. [12]
That said, winter is the season when production can still surprise to the downside due to freeze-offs and operational interruptions—so the market continues to price some risk premium.
Across the Atlantic, European gas pricing remains sensitive to weather, storage levels, and LNG arrivals—especially with the region still navigating the post-Russian pipeline era.
On Dec. 24, Europe’s benchmark Dutch TTF front-month eased to around €27.36/MWh (about $9.47/MMBtu) by mid-morning London time, as forecasts suggested a potentially quicker end to a cold spell and supply stayed stable. [13]
While Europe’s price level remains far above the ultra-cheap periods of the pre-2022 era, the market has become more two-sided: warm forecasts can soften prices quickly, while cold snaps still have the power to ignite rapid rallies.
Europe’s long-run gas architecture is also being reshaped by regulation. Reuters reported the European Parliament approved the EU plan to phase out Russian gas imports by late 2027, pushing the bloc toward longer-term reliance on LNG and alternative pipeline sources. [14]
In Asia, spot LNG prices have been supported by incremental winter buying, particularly where cold weather looks imminent.
A financial-market report citing Argus noted that South Korean buying interest emerged with temperatures expected to fall to two-year lows on Dec. 26, and that cargoes have been diverted from China to South Korea in recent weeks. [15]
This matters for U.S. gas because Asia is a major sink for Atlantic Basin LNG when economics work—supporting feedgas demand back in the United States.
One of the most consequential “quiet” forces in gas markets is the steady accumulation of long-term LNG contracts—the contractual plumbing that underwrites new liquefaction capacity.
On Dec. 24, Reuters reported Malaysia’s Petronas signed an agreement to supply 1 million metric tons per annum of LNG to CNOOC Gas and Power in Singapore, deepening an existing relationship. [16]
Deals like this don’t usually move Henry Hub futures minute-by-minute, but they reinforce the macro reality: LNG remains a structural growth channel, even as short-term weather dominates the daily tape.
Putting today’s cross-currents together, the clearest near-term framework looks like this:
EIA expects Henry Hub to moderate after winter with milder early-2026 weather and rising production, averaging around $4.00/MMBtu next year in its baseline outlook. [19]
Natural gas traders and energy consumers are likely to keep a close eye on:
If you want, I can tailor this same Dec. 24, 2025 update into (1) a shorter Google Discover-style “tight read” (400–600 words) or (2) a longer newsroom feature (1,800–2,200 words) while keeping it fully source-grounded and SEO-focused.
1. www.investing.com, 2. www.bairdmaritime.com, 3. www.aga.org, 4. www.eia.gov, 5. www.eia.gov, 6. www.bairdmaritime.com, 7. www.eia.gov, 8. www.reuters.com, 9. www.eia.gov, 10. www.eia.gov, 11. www.reuters.com, 12. www.eia.gov, 13. www.hellenicshippingnews.com, 14. www.reuters.com, 15. www.lse.co.uk, 16. www.reuters.com, 17. www.eia.gov, 18. www.reuters.com, 19. www.eia.gov, 20. www.aga.org, 21. www.eia.gov, 22. www.eia.gov, 23. www.reuters.com, 24. www.reuters.com
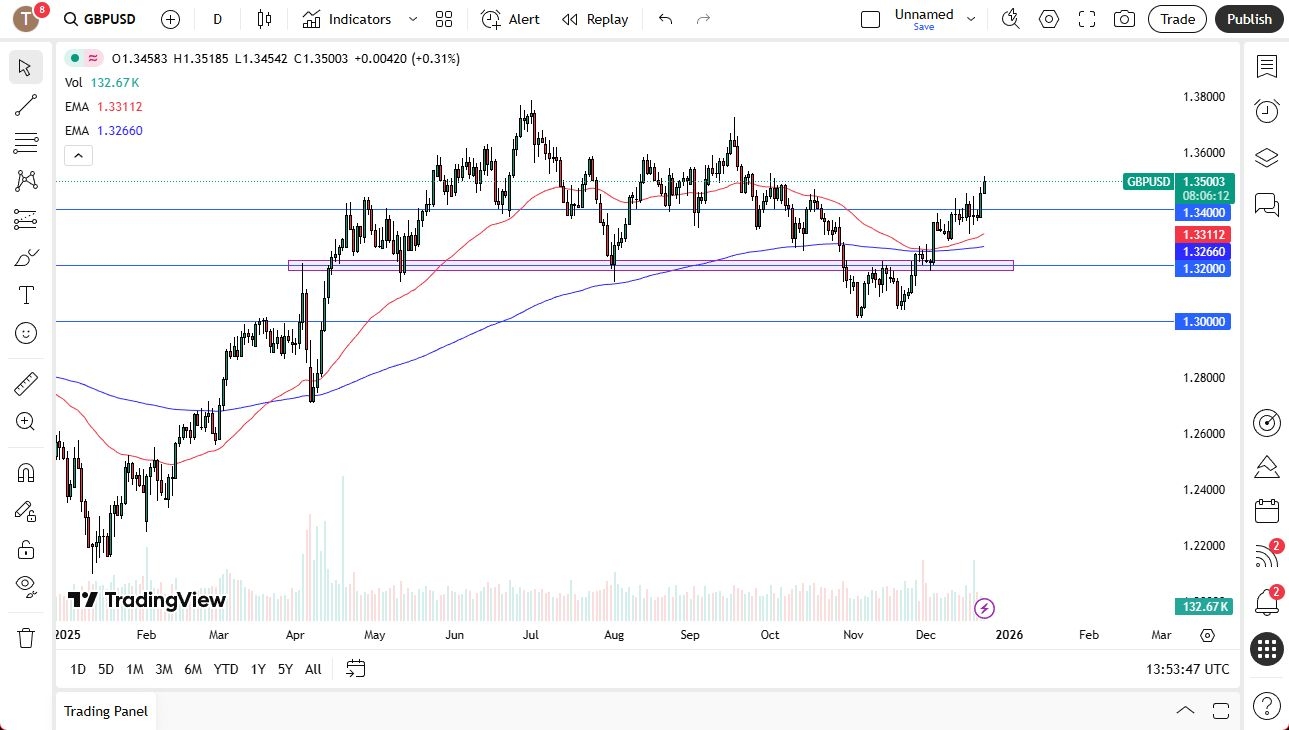
With that being the case, this is a market that I think will continue to be noisy, but the $1.35$ level is an area that’s been important in the past, and of course, it’s a large round, psychologically significant figure, so I do anticipate that there will be a certain amount of questions asked at this point.

If we can clear this area, it’s possible that we will end up going to the $1.37$ level. If we turn around and fall from here, it’s really not until we break down below the $1.34$ level that I think we will see a little bit more negative. Keep in mind that at this time of year, we have to worry about liquidity and volume, and that, of course, is a major influence as well.
With that being the case, I think you have to look at this through the prism of what’s going on with the Federal Reserve and, of course, the fact that the British pound has been a fairly strong performer in relation to the dollar over the last couple of years. Even when the US dollar was so strong, the British pound held up better than most of its contemporaries. Because of this, I’m watching the US dollar across the board, and if it does start to shrink, then this is a place I want to get long of. On the other hand, if the US dollar strengthens, I could short the British pound, but I will probably get more traction out of certain currencies like the Australian dollar or the New Zealand dollar.
Ready to trade our GBP/USD daily forecast? We’ve shortlisted the best regulated forex brokers UK in the industry for you.
Christopher Lewis has been trading Forex and has over 20 years experience in financial markets. Chris has been a regular contributor to Daily Forex since the early days of the site. He writes about Forex for several online publications, including FX Empire, Investing.com, and his own site, aptly named The Trader Guy. Chris favours technical analysis methods to identify his trades and likes to trade equity indices and commodities as well as Forex. He favours a longer-term trading style, and his trades often last for days or weeks.
Drinking water and caffeine-free teas helps keep you hydrated, which can help your body heal. Teas also contain plant compounds called polyphenols. Polyphenols may support your immune system and reduce your chances of catching a cold.
Green tea has catechins, which are a type of polyphenol. Polyphenols are a group of molecules that may help fight viruses, bacteria, and inflammation.
Taking green tea catechins—by drinking, gargling, or using supplements—may help prevent flu. A 2015 study found that people who drank green tea at least twice a week had a 61% lower risk of catching the flu.
One study suggests brewing finely ground tea leaves at 185 °F (85 °C) for 30 minutes to get the most polyphenols. Using very cool water (68 °F/20 °C) and brewing for a long time (12 hours) also gives the most antioxidants.
Squeeze a lemon to get the most benefits from green tea. Green tea catechins work better in acidic conditions. Adding lemon makes the tea more acidic.
Green tea contains caffeine, so consume it in moderation. Having too much caffeine can make it hard to sleep and can cause dehydration.
Echinacea is a purple flower that grows in areas east of the Rocky Mountains. It has many beneficial compounds, including one called alkamides. Alkamides may help your body fight inflammation and viruses and support overall immune health.
Some studies suggest that Echinacea tablets and capsules may help prevent upper respiratory tract infections and shorten the recovery period in children.
A 2022 study found that drinking Echinacea tea brewed at 185 °F (80 °C) worked better against viruses than taking capsules or tablets.
Another 2015 study found that drinking a hot drink made with Echinacea and elderberry worked as well as the flu medicine Tamiflu (oseltamivir) when the flu was treated early.
Be aware that Echinacea may not be safe during pregnancy and breastfeeding.
Some people may be allergic to Echinacea. Echinacea may also interact with immunosuppressant medications. Consult your doctor if you have chronic conditions or take any medication.
Elderberry is a dark purple berry that grows on the black elder tree. People use elderberry supplements to help with colds and other upper respiratory infections.
Elderberry is rich in anthocyanins, which are powerful antioxidants. These antioxidants help support the immune system and may slow down the spread of viruses.
A 2021 research review found that elderberry supplements may make colds shorter and less severe. Most studies focus on the effects of supplements. There is limited evidence that elderberry or elderberry tea helps with colds.
Elderflower tea is made from elderberry flowers. The leaves, stems, and unripe berries of the elder tree are poisonous.
Many people use chamomile to help with colds and coughs.
Chamomile has compounds that fight inflammation and act as antioxidants. However, no studies in humans show that chamomile tea directly helps with colds.
Chamomile has been shown to improve sleep. Since rest is essential for illness recovery and overall health, chamomile may help your body heal.
Ginger has compounds called gingerols. Gingerols might help fight the flu virus, but no studies show they work in people.
Studies in people suggest that ginger supplements might help lower inflammation and protect the body with antioxidants. Lowering inflammation may help your body heal, but no studies have looked at how ginger tea affects colds directly.
Some people claim lemon tea helps with cold symptoms, but there is no proof that it actually does.
Lemons are rich in vitamin C, which can help make colds less severe. But lemon tea doesn’t have much vitamin C. You can get vitamin C by eating lemons or other citrus fruits instead.
Still, lemon tea can provide hydration, which can support health. Add fresh lemon juice or a slice to hot water.







:max_bytes(150000):strip_icc()/Health-GettyImages-2188247727-d63902f8d23a486aa7096c3dee2f3dde.jpg "5 Teas That Help Relieve Cold Symptoms Naturally")