The main category of All News Articles.
You can use the search box below to find what you need.
[wd_asp id=1]
The main category of All News Articles.
You can use the search box below to find what you need.
[wd_asp id=1]
The Pepeto presale is progressing fast, and this is still the chance for early buyers to join before exchange listings and broader market visibility begin. To take part, head to the official website at , link your wallet, and buy PEPETO using ETH, USDT, BNB, or a bank card. Those who join early also have the option to stake their tokens and earn high APY rewards while waiting for the official launch.

The U.S. dollar is weakening at its fastest pace in years, boosting commodity prices worldwide. Central banks are aggressively accumulating gold to reduce reliance on dollar reserves. Supply disruptions, tariffs, and underinvestment in mining have tightened markets just as demand accelerates. Together, these forces explain why precious and industrial metals are rising in unison — and why the rally may not be over yet.
Gold’s rally is rooted in macroeconomic stress and policy shifts. The metal briefly touched $4,525 per ounce, a fresh all-time high, before consolidating near current levels. Monthly gains are nearing 9%, driven by expectations that the Federal Reserve will begin cutting interest rates in 2026.
Lower rates reduce the opportunity cost of holding gold, which pays no yield. At the same time, inflation concerns and rising government debt are fueling what traders call the “debasement trade.” A weaker U.S. Dollar has made gold cheaper for overseas buyers, amplifying global demand.
Central banks are another powerful force. Many have accelerated gold purchases to diversify reserves and hedge against financial instability. Analysts now project gold could dip modestly toward $4,350 near quarter-end before climbing toward $4,600 over the next 12 months, supported by sustained official-sector buying.
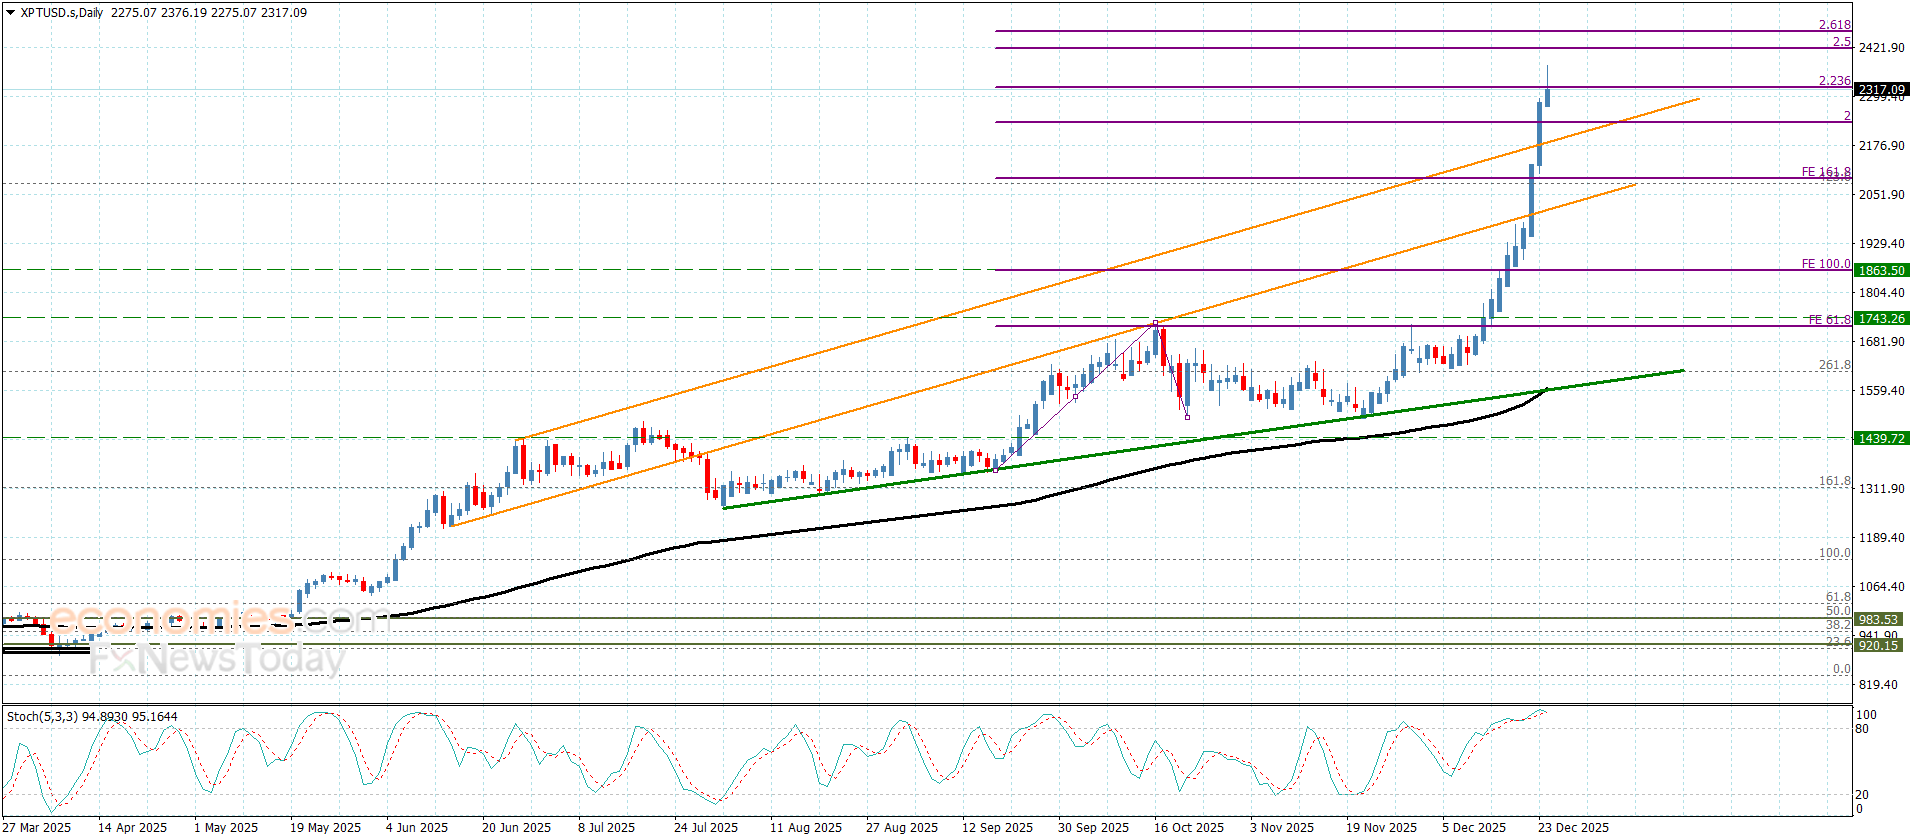
Silver’s surge is even more dramatic. Prices briefly topped $72.70 per ounce, and despite minor pullbacks, the metal remains up over 140% in 2025. Unlike gold, silver plays a dual role as both a safe-haven asset and a critical industrial material.
Demand from solar panel manufacturing, electric vehicles, and data centers has exploded. Each new energy or AI project consumes silver permanently, tightening supply. Monthly gains near 40% reflect how quickly inventories are being absorbed. With silver now classified as a strategic and critical mineral in several countries, analysts see prices holding above $70 into 2026, with forecasts pushing toward the mid-$70s.
Copper’s rally tells the story of the energy transition. Prices are approaching $12,000 per metric ton, driven by soaring demand from electric vehicles, artificial intelligence data centers, and power grid expansion. A single electric vehicle can use up to four times more copper than a traditional gasoline car.
According to Goldman Sachs, grid expansion and power infrastructure could account for more than 60% of copper demand growth by 2030. Supply, however, is struggling to keep pace. Mining disruptions in Chile and Peru have constrained output, while new projects face long approval timelines.
Adding to the pressure, U.S. trade policy has reshaped the market. A 50% tariff on imported copper products triggered stockpiling and hoarding. J.P. Morgan expects tight supply conditions to persist well into 2026.
Looking ahead to 2026, analysts broadly expect gold, silver, and copper prices to stay elevated, with volatility driven by interest rates, global growth, and supply constraints. Forecasts suggest the metals rally is shifting from a momentum-driven surge to a structurally supported cycle. Gold price forecast for 2026
Gold is expected to remain well above historical averages. Most bank and commodities desk models see gold trading in a $4,300–$4,900 per ounce range through 2026. Central bank buying remains the anchor. If the Federal Reserve begins rate cuts, real yields could fall further, supporting upside risk toward the upper end of forecasts. Downside risk appears limited unless inflation cools sharply and the dollar strengthens materially.
Silver price forecast for 2026
Silver forecasts are more aggressive due to tight supply and industrial demand. Analysts project an average range of $68–$78 per ounce, with volatility likely. Solar installations, EV production, and data center expansion continue to absorb supply faster than mining output grows. Silver’s dual role as an investment metal and industrial input keeps it highly sensitive to both rate policy and global manufacturing trends.
Copper price forecast for 2026
Copper outlooks remain bullish but uneven. Consensus estimates place copper between $5.40 and $6.10 per pound, with some upside scenarios tied to grid expansion and AI infrastructure. Electric vehicles, renewable energy, and transmission upgrades drive demand, while mine supply growth remains constrained. Trade barriers and inventory rebuilding could keep prices near cycle highs.
Gold is expected to stabilize at historically high levels. Silver may remain the most volatile, with sharp rallies on demand shocks. Copper prices are likely to stay supported by long-term electrification trends. Together, forecasts suggest metals will remain a key inflation and growth hedge throughout 2026, rather than reverting to pre-2024 norms.
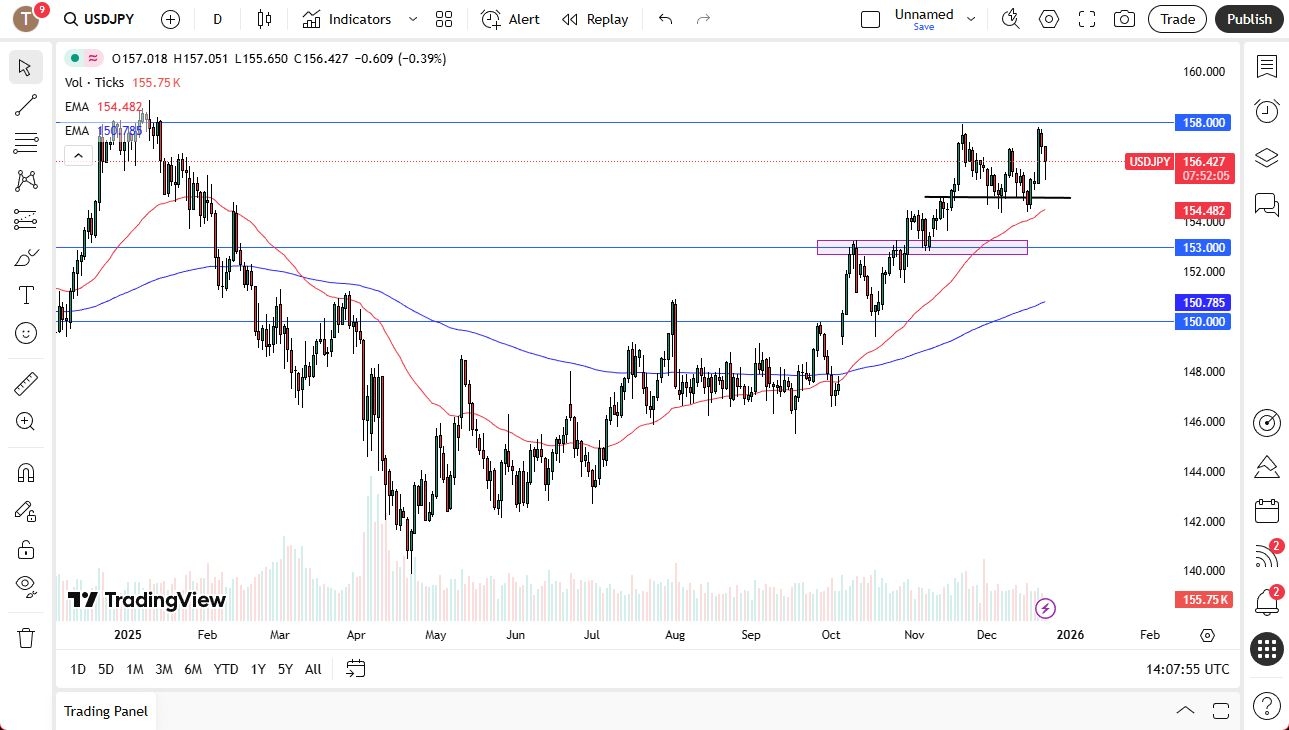
The 154 yen level seems to be massive support, while the 158 yen level seems to be a significant resistance barrier. All things being equal, this is a market that I think is trying to determine what is going to happen with central banks, especially with the Federal Reserve, as traders are starting to bet on more interest rate cuts going into the future.

But at the same time, the Bank of Japan is trying to normalize rates. Whether or not that actually ends up being the case and whether or not they can actually do it to any significant amount remains a question to be answered, but I think we have to look through the prism of a market where you are seeing a positive swap at the end of every day if you’re long.
I think that’s part of what we’ve seen during the trading session on Tuesday as we head towards North America. Traders are trying to turn things around and reach back towards the 158 yen level. Over the next couple of days, I think we will stay well within this 400-point range because volume will start to dissipate, and several central banks are not only going to be closing down the banking system on Thursday for Christmas, but you will also see the Friday session being a major holiday in most of the larger countries as well. After that, you have the week of New Year’s, and that really is kind of messy as well. So I think you’re looking at a 400-point range between now and next year when traders start to throw more liquidity in.
Want to trade our USD/JPY forex analysis and predictions? Here’s a list of forex brokers in Japan to check out.
Christopher Lewis has been trading Forex and has over 20 years experience in financial markets. Chris has been a regular contributor to Daily Forex since the early days of the site. He writes about Forex for several online publications, including FX Empire, Investing.com, and his own site, aptly named The Trader Guy. Chris favours technical analysis methods to identify his trades and likes to trade equity indices and commodities as well as Forex. He favours a longer-term trading style, and his trades often last for days or weeks.
The global probiotic strains market is projected to witness robust growth over the next decade, rising from an estimated USD 3,781.2 million in 2025 to USD 8,013.4 million by 2035, reflecting a CAGR of 7.8% during the forecast period. This upward trajectory is fueled by increasing consumer awareness of gut health, growing interest in preventive healthcare, and the integration of probiotics into functional foods and dietary supplements.
The rising importance of gut health has been central to market growth. Research highlights the role of the gut microbiome in supporting digestion, immunity, metabolism, and even mental health. As a result, consumers are increasingly turning to probiotic-enriched products and functional foods to maintain overall well-being.
Get Exclusive Access To Data Tables, Market Sizing Dashboards, And Analyst Insights. Request Sample Report! https://www.futuremarketinsights.com/reports/sample/rep-gb-9632
Geographically, the market demonstrates significant variation. The United States remains a dominant player due to its focus on preventive healthcare, high incidence of gastrointestinal disorders, and consumer willingness to adopt probiotic products. Meanwhile, the North Pacific region, though smaller in market size, is expected to experience rapid growth thanks to rising middle-class populations and increasing consumption of fermented foods.
The probiotic product landscape continues to expand with innovative product launches. Manufacturers are introducing strain-specific probiotics targeting immune support, brain health, and women’s wellness. The inclusion of probiotics in everyday products like yogurt, kefir, juices, and snacks has further broadened accessibility and consumer recognition of probiotic strains.
The market’s growth trajectory remains closely tied to strategic collaborations, mergers and acquisitions, and investments in research and development. Companies that innovate with evidence-based, targeted probiotic solutions are likely to gain a competitive edge.
Key Industry Highlights:
• Gut-Brain Axis Supplements: Innovations targeting mental health and stress management are shaping the cognitive wellness segment. Probiotic formulas are being developed to positively influence mood, brain neuropeptides, and gut hormones.
• Immune-Boosting Probiotics: Strains such as Lactobacillus and Bifidobacterium are increasingly used for immune modulation, inflammation control, and supporting natural defense mechanisms.
• Personalized Probiotic Solutions: AI-driven microbiome testing enables tailored probiotic recommendations, allowing consumers to manage gut health based on their individual profiles.
• Postbiotic Innovation: The combination of probiotics and postbiotics is creating holistic solutions that enhance gut barrier integrity and immune health.
• Probiotic-Infused Foods & Beverages: Probiotics are being incorporated into everyday products, from juices and smoothies to snacks and baked goods, making gut-friendly nutrition convenient and accessible.
• Targeted Strains for Specific Conditions: Products designed for IBS, women’s health, and skin health are expanding the market for precision probiotic supplements.
Country-Wise Insights:
The United States is leveraging advanced microbiome mapping and personalized probiotics to meet rising consumer demand. In China, the market is blending Traditional Chinese Medicine-inspired ingredients with modern probiotic science, creating unique formulations that appeal to holistic health approaches. Japan, with one of the longest-living populations, focuses on probiotics that promote longevity, cognitive health, and immune support.
Category Insights:
Lactobacillus strains dominate the market, accounting for a significant share across functional foods and supplements, with species such as L. acidophilus, L. rhamnosus, and L. plantarum leading the space. Dietary supplements are the fastest-growing application segment, reflecting the increasing consumer preference for convenient, daily probiotic intake.
The probiotic industry is marked by a mix of organized and unorganized players. Global leaders such as Chr Hansen, DuPont, Lallemand, and Probi dominate with advanced R&D and distribution networks, while local manufacturers contribute to regional innovation, often producing traditional fermented foods tailored to local tastes.
As consumer knowledge of gut health grows and the demand for natural, preventive healthcare rises, the probiotic market is poised to continue its upward trajectory. Companies that strategically invest in innovation, partnerships, and personalized solutions will lead the sector in the coming decade.
Subscribe for Year-Round Insights → Stay ahead with quarterly and annual data updates. https://www.futuremarketinsights.com/reports/probiotic-strains-market
Leading Manufacturers: Chr Hansen A/S, DuPont Nutrition & Biosciences, Lallemand Health Solutions, Probi, Morinaga Milk Industry, Ganeden Biotech, Sabinsa Corporation, Unique Biotech, Synbio Tech
Why FMI: https://www.futuremarketinsights.com/why-fmi
Browse Related Insights
UK Probiotic Strains Market: https://www.futuremarketinsights.com/reports/united-kingdom-probiotic-strains-market
USA Probiotic Strains Market: https://www.futuremarketinsights.com/reports/united-states-probiotic-strains-market
ASEAN Probiotic Strains Market: https://www.futuremarketinsights.com/reports/asean-probiotic-strains-market
Contact Us:
Future Market Insights Inc.
Christiana Corporate, 200 Continental Drive,
Suite 401, Newark, Delaware – 19713, USA
T: +1-347-918-3531
Website: https://www.futuremarketinsights.com
About Future Market Insights (FMI)
Future Market Insights, Inc. (ESOMAR certified, recipient of the Stevie Award, and a member of the Greater New York Chamber of Commerce) offers profound insights into the driving factors that are boosting demand in the market. FMI stands as the leading global provider of market intelligence, advisory services, consulting, and events for the Packaging, Food and Beverage, Consumer Technology, Healthcare, Industrial, and Chemicals markets. With a vast team of over 400 analysts worldwide, FMI provides global, regional, and local expertise on diverse domains and industry trends across more than 110 countries.
This release was published on openPR.
Darius Baruo
Dec 24, 2025 06:24
MATIC price prediction suggests a potential 18-32% rally to $0.45-$0.50 in the coming weeks as Polygon tests critical resistance levels near $0.42.
Polygon’s MATIC token is positioning for a potential technical bounce after finding support near its 52-week low of $0.37. With the current price at $0.38, our MATIC price prediction analysis suggests the token could rally 18-32% to test resistance levels between $0.45-$0.50 over the next 4-6 weeks.
• MATIC short-term target (1 week): $0.42 (+11%)
• Polygon medium-term forecast (1 month): $0.45-$0.50 range
• Key level to break for bullish continuation: $0.43 (SMA 20)
• Critical support if bearish: $0.35, then $0.33
Recent analyst coverage has shown growing optimism for Polygon’s near-term prospects. Blockchain.News issued a MATIC price prediction with targets between $0.42-$0.50 for the medium term, citing technical indicators suggesting a potential recovery. Their analysis identifies immediate resistance at $0.42 and critical support at $0.35, aligning closely with our technical assessment.
Benzinga’s longer-term Polygon forecast projects MATIC reaching $0.717 by 2030, implying a 9.61% annualized return from current levels. While this represents modest growth expectations, it suggests analysts view the current price as near a cyclical bottom.
The market consensus indicates a cautious but optimistic outlook, with most MATIC price prediction models targeting the $0.42-$0.50 range as the next significant resistance zone.
The Polygon technical analysis reveals several encouraging signs for a potential reversal. MATIC’s RSI of 38.00 sits in neutral territory, providing room for upward movement without being overbought. The token’s position at 0.29 within the Bollinger Bands suggests it’s trading in the lower portion of its recent range, often a precursor to mean reversion.
However, the MACD histogram at -0.0045 indicates bearish momentum remains intact, though the reading is relatively shallow compared to previous sell-offs. The key inflection point lies at the 20-day SMA of $0.43, which has acted as dynamic resistance throughout December.
Volume analysis shows relatively light trading at $1.07 million on Binance, suggesting the current consolidation phase lacks strong conviction from either bulls or bears. A volume surge above 150% of the recent average would provide confirmation of any breakout attempt.
Our primary MATIC price target focuses on the $0.45-$0.50 resistance zone, representing the convergence of the 50-day SMA ($0.45) and previous support-turned-resistance levels. A sustained break above $0.43 would trigger this bullish scenario, with an initial target at $0.45 (+18%) followed by $0.50 (+32%).
The bullish case strengthens if MATIC can reclaim the 20-day SMA at $0.43 with accompanying volume expansion. This Polygon forecast requires RSI to push above 50 and MACD to generate a bullish crossover, both technically achievable given current positioning.
Downside risk materializes if MATIC fails to hold the $0.35 support level identified by recent analyst predictions. A break below this level would target the strong support at $0.33, representing a 13% decline from current levels.
The bearish scenario gains momentum if the RSI drops below 30 and daily ATR expands beyond $0.04, indicating increased volatility to the downside. Traders should monitor the $0.35 level closely as it represents the final defense before a more significant correction.
Based on our MATIC price prediction analysis, a layered entry approach offers the best risk-adjusted opportunity. Primary accumulation should occur between $0.37-$0.39, with additional purchases on any dip toward $0.35.
For active traders, a breakout play above $0.43 offers a more aggressive entry with a stop-loss at $0.40. This strategy targets the $0.45-$0.50 resistance zone while limiting downside to approximately 10%.
Position sizing should reflect MATIC’s elevated volatility, with the daily ATR of $0.03 suggesting 8% daily moves remain common. Conservative investors should limit MATIC exposure to 2-3% of portfolio value given the technical uncertainty.
Our MATIC price prediction anticipates a recovery to the $0.45-$0.50 range over the next 4-6 weeks, representing potential gains of 18-32% from current levels. This Polygon forecast carries a medium confidence level given the mixed technical signals and need for volume confirmation.
Key indicators to watch include a sustained break above the 20-day SMA at $0.43, RSI reclaiming 50, and daily volume exceeding $1.5 million. Failure to hold $0.35 support would invalidate the bullish thesis and trigger our bearish scenario targeting $0.33.
The timeline for this prediction extends through January 2025, with the critical inflection point expected within the next 7-10 trading days as MATIC approaches the $0.42-$0.43 resistance cluster.
Image source: Shutterstock
Copper price activated with the main indicators again, surpassing the barrier at $5.5000, announcing its readiness to achieve extra gains on a near-term basis, therefore, we will keep our bullish expectations, reminding you that the extra target near $5.6300 and $5.7400 level.
Note that the price stability below the current barrier might force it to form mixed trading, and there is a chance of testing the support at $5.1500.
The expected trading range for today is between $5.3900 and $5.6300
Trend forecast: Bullish
Coffee price surrendered to the negative pressures, forcing it to suffer several losses towards 339.20, facing a strong support base as appears in the above image.
The price stability above this support and stochastic attempt to exit the oversold level might provide a chance to recover several losses by its rally towards 359.80, then wait for facing the moving average 55 near 368.50.
The expected trading range for today is between 338.00 and 359.80
Trend forecast: Bullish
Coffee vs. tea is a debate as old as time. While drinking your morning wake-up beverage, have you ever wondered which has more caffeine, or which one is better for you? The good news is that both beverages—coffee and tea—have proven health benefits (including helping to energize you and boosting immunity), but just like with everything else, you may want to consume them in moderation. Here’s a breakdown of the pros and cons of each, according to a nutrition expert.
“One can argue that both coffee and tea have potential health benefits, but the overall benefits of each depend on factors such as the type of coffee or tea, how it was grown, the brewing method, and the amount consumed,” says Ilana Muhlstein, RDN. Here’s a look at each.
Drinking coffee has been proven to have multiple benefits, including reducing inflammation and supporting heart and gut health. “Coffee contains caffeine, which has been shown to help improve focus and cognitive function,” Muhlstein says.
“Drinking coffee has also been associated with a lower risk of heart disease and diabetes. A study published in the American Journal of Clinical Nutrition found that regular coffee consumption was associated with a lower risk of coronary heart disease. A meta-analysis of studies published in the journal Diabetes Care found that moderate coffee consumption was associated with a lower risk of type 2 diabetes.”
For those who want a quick caffeine boost and added energy, coffee is a solid choice since it typically has more caffeine than tea. But beware if you have anxiety or insomnia since coffee can trigger anxiety or disrupt sleep in sensitive individuals.
“While tea also contains caffeine and has been shown to improve cognitive function and alertness, the addition of theanine, an amino acid, gives tea the added benefit of reducing stress,” Muhlstein says. If you’re about to embark on a major project or need a laser level of focus, black or green tea may be your ideal go-to beverage—no caffeine trembles and reduced stress will help you make it to the project finish line.
“Green tea is one of the richest sources of powerful antioxidants, called polyphenols, that have been shown to have the potential for reducing the risk of cardiovascular disease and certain cancers,” Muhlstein says. “You can find caffeine-free green tea or herbal tea for those who are sensitive to caffeine but want the other health benefits associated with tea.”
Tea is ideal for those who are sensitive to caffeine or struggle with anxiety or sleep conditions. Some types of tea can even help promote sleep and have calming effects. If you don’t like the taste of coffee, tea may also be for you.
Antioxidants are compounds that protect cells from oxidative stress and damage caused by free radicals (unstable molecules). Antioxidants help neutralize these free radicals, thereby reducing the risk of chronic diseases and promoting overall health.
Coffee and tea both contain caffeine. A standard 8-ounce cup of coffee contains about 95 milligrams of caffeine, while a cup of black tea has about 50 milligrams, and green tea has about 30 milligrams. That means coffee has twice as much caffeine as the same amount of black tea, and over three times the amount of caffeine as green tea.
But be careful how much caffeine you consume. The Food and Drug Administration (FDA) suggests having no more than 400 milligrams of caffeine in a day. That’s about four cups of coffee, eight cups of black tea, or approximately 13 cups of green tea per day.
| Type | Size | Caffeine |
| Coffee | 8 ounces | 95 milligrams |
| Espresso | 1.5 ounces | 150 milligrams |
| Green Tea | 8 ounces | 30 milligrams |
| Black Tea | 8 ounces | 50 milligrams |
If you over-caffeinate, you may begin to feel adverse effects. “Too much caffeine consumed in coffee can lead to increased anxiety, insomnia, and elevated heart rate and blood pressure,” Muhlstein adds. “Coffee is also acidic and needs to be avoided by many people who experience acid reflux and gastrointestinal issues.”
Here are some other symptoms that might show up if you’ve had too much caffeine:
Decaffeinated coffee and tea have little to no caffeine in them, and herbal teas (think chamomile, peppermint, or rooibos) are naturally caffeine-free. Just be mindful that a cup of “decaf” coffee or tea still tends to have about two milligrams of caffeine; the process of decaffeination removes about 97% (or more) of the caffeine from the coffee beans.
Additives like milk, sugar, and whipped cream are common in both coffee and tea, but they can take away from the benefits by adding extra calories, fat, and sugars that can contribute to health issues. For example, high-fat additives like fatty milk options or whipped cream can increase bad cholesterol levels, while too much sugar could increase the risk of diabetes and heart disease.
Keeping coffee and tea simple, without excessive ingredients, allows you to enjoy their natural benefits. But if you want to add more flavor to your coffee or tea (or thicken its consistency), opt for a low-fat, unsweetened option. Low-fat milk or unsweetened milk alternatives like almond milk can add flavor and thickness without all the added fats and sugar.
There are also sugar-free creamers and artificial sweeteners that you can try, but be sure to check the ingredient labels. The jury is still out on whether or not artificial sweeteners are actually better for you. “If you would like to add sweetness to your coffee or tea, a natural sweetener, such as honey or coconut sugar, can also be used when mindful of portions,” Mulhstein adds.
BitcoinWorld
Cardano Price Prediction 2026-2030: The Ultimate Guide to ADA’s $2 Breakthrough Potential
Will Cardano’s ADA token finally break the $2 barrier that has eluded it for years? As one of the most researched and fundamentally sound blockchain projects, Cardano continues to capture investor attention despite market volatility. This comprehensive analysis examines ADA’s price trajectory from 2026 through 2030, combining technical analysis, fundamental developments, and expert insights to answer the burning question: Can Cardano reach $2 and beyond?
Cardano stands as a third-generation blockchain platform founded by Charles Hoskinson, co-founder of Ethereum. Unlike many cryptocurrencies that prioritize speed over security, Cardano employs a research-first approach, with every upgrade undergoing rigorous academic peer review. This methodology has created one of the most secure and scalable blockchain networks, but it has also meant slower development compared to competitors.
As of current market conditions, ADA trades significantly below its all-time high of $3.10 reached in September 2021. The cryptocurrency has faced several challenges:
Despite these challenges, Cardano maintains a strong community and continues to deliver on its roadmap. The successful implementation of smart contracts through the Alonzo upgrade marked a significant milestone, opening the door for decentralized applications and DeFi protocols on the network.
By 2026, Cardano’s ecosystem should be substantially more mature. Several key developments are expected to influence ADA’s price:
| Factor | Potential Impact | Price Range Estimate |
|---|---|---|
| Full Hydra implementation | High scalability (1M+ TPS) | $0.85 – $1.40 |
| DApp ecosystem growth | Increased utility and demand | +30-50% from baseline |
| Regulatory clarity | Institutional adoption | Variable based on jurisdiction |
The cryptocurrency forecast for 2026 depends heavily on broader market conditions. If the crypto market enters another bull cycle, ADA could test the $1.40 resistance level. However, conservative estimates place ADA between $0.85 and $1.20, assuming moderate ecosystem growth and stable market conditions.
2027 represents a critical year for Cardano’s long-term valuation. By this time, the network should have fully implemented its scaling solutions, particularly Hydra, which promises to make Cardano one of the fastest and most efficient blockchains. This technical superiority could drive significant adoption.
Key factors influencing the ADA price in 2027:
Our analysis suggests that if Cardano captures even 5-7% of the total DeFi market by 2027, ADA could reach between $1.50 and $1.80. The $2 target becomes plausible if multiple positive catalysts align, including major partnership announcements and successful implementation of all scaling solutions.
Looking toward 2030 requires considering macro trends in blockchain adoption. By this decade’s end, blockchain technology should be integrated into numerous industries, from finance to healthcare to governance. Cardano’s focus on sustainability, security, and peer-reviewed development positions it well for institutional adoption.
Several scenarios could unfold for Cardano by 2030:
The most likely scenario involves Cardano maintaining its position as a premium blockchain solution for specific use cases, particularly in developing nations through partnerships like those in Africa. This targeted adoption could drive steady, sustainable growth rather than explosive price movements.
The $2 question dominates Cardano discussions. Reaching this milestone requires several conditions:
First, Cardano must demonstrate real-world utility beyond speculation. The growing ecosystem of decentralized applications needs to attract substantial user bases. Second, the network must maintain its security and decentralization advantages while achieving competitive transaction speeds and costs. Third, broader cryptocurrency adoption must continue, increasing total market capitalization.
Technical analysis of ADA’s price history reveals that $2 represents both a psychological barrier and a key resistance level. Breaking through this level would require:
| Requirement | Current Status | 2030 Projection |
|---|---|---|
| Daily Active Addresses | ~100,000 | 500,000+ |
| Total Value Locked (DeFi) | ~$200M | $5B+ |
| Network Revenue | Minimal | Sustainable |
Based on current growth trajectories and planned developments, our cryptocurrency forecast suggests ADA has a 60-70% probability of reaching $2 between 2027 and 2029. The exact timing depends largely on market cycles and specific catalyst events.
No price prediction is complete without considering potential obstacles. For Cardano, several risks could impact its trajectory:
Investors should monitor these factors alongside Cardano’s development progress. The project’s transparency through regular updates from Charles Hoskinson and the development team provides valuable insights into addressing these challenges.
Given the volatility of cryptocurrency markets, consider these approaches to ADA investment:
Remember that all cryptocurrency investments carry substantial risk. Only invest what you can afford to lose, and consider your investment horizon. For long-term believers in Cardano’s vision, the 2026-2030 period represents a significant opportunity, but short-term traders may face considerable volatility.
Cardano’s journey toward $2 and beyond represents more than just price speculation—it reflects the maturation of a fundamentally different approach to blockchain development. While the path contains uncertainties and challenges, Cardano’s commitment to research, security, and sustainable growth provides a solid foundation for long-term value creation.
The coming years will test whether Cardano’s methodical approach can compete in an increasingly fast-paced cryptocurrency landscape. Success depends not just on technological achievements but on real-world adoption and utility. For investors, the key is balancing optimism about Cardano’s potential with realistic expectations about timeline and market conditions.
As we look toward 2030, Cardano remains one of the most intriguing projects in cryptocurrency, with the potential to redefine how blockchain technology integrates with global systems. Whether ADA reaches $2 becomes less important than whether Cardano achieves its vision of creating a more secure, transparent, and equitable global financial system.
Cardano’s primary advantage is its research-driven, peer-reviewed development approach. Founded by Charles Hoskinson, this methodology prioritizes security and formal verification, making it particularly suitable for applications requiring high assurance, such as financial systems and identity solutions.
Cardano uses Ouroboros, a provably secure proof-of-stake protocol developed through academic research. Unlike many proof-of-stake systems, Ouroboros has mathematically proven security properties similar to Bitcoin’s proof-of-work, but with significantly lower energy consumption.
The Cardano roadmap includes several key upgrades: Hydra for layer-2 scaling, Mithril for lightweight client verification, and ongoing improvements to smart contract capabilities. The development is led by Input Output Global (IOG), with regular updates published through their research portal.
Investment suitability depends on individual risk tolerance and investment horizon. Cardano presents a unique value proposition focused on security and sustainability, but like all cryptocurrencies, it carries significant volatility risk. Consider consulting with a financial advisor and conducting thorough research before investing.
ADA holders can delegate their tokens to stake pools through compatible wallets like Daedalus or Yoroi. Staking helps secure the network while earning rewards, typically around 4-5% annually. The process is designed to be accessible while maintaining decentralization.
To learn more about the latest cryptocurrency markets trends, explore our article on key developments shaping blockchain adoption and institutional investment in digital assets.
This post Cardano Price Prediction 2026-2030: The Ultimate Guide to ADA’s $2 Breakthrough Potential first appeared on BitcoinWorld.
Silver price (XAG/USD) rallies further to near $72.70 during the early European trading session on Wednesday. The white metal extends its bull run as Federal Reserve (Fed) dovish expectations for 2026 remain broadly firm, even as the United States (US) Q3 Gross Domestic Product (GDP) came in surprisingly higher.
According to the CME FedWatch tool, traders see a 70.6% that the Fed will reduce interest rates by at least 50 bps in 2026, signaling a higher scope of interest rate cuts than the Fed’s projections in its dot plot last week. The Fed’s dot plot showed that policymakers collectively see the Federal Funds Rate heading to 3.4% by the end of 2026, indicating that there won’t be more than one interest rate cut.
Theoretically, lower interest rates by the Fed bode well for non-yielding assets, such as Silver.
On Tuesday, the US GDP data showed that the economy grew at a robust pace of 4.3% year-on-year (YoY). Economists expect the US GDP growth to come in lower at 3.3% from 3.8% recorded in the second quarter of the year.
In Wednesday’s session, investors will focus on Initial Jobless Claims data, which will be published at 13:30 GMT. Individuals claiming jobless benefits for the first time are expected to have remained steady at 223K.
In the daily chart, XAG/USD trades at $72.19. The 20-day exponential moving average is ascending, and price holds well above it, reinforcing a firm bullish bias. The average’s positive slope continues to support the advance. RSI (14) at 80.95 is overbought, signaling stretched momentum that could precede consolidation.
Should momentum cool, pullbacks could find support at the 20-day EMA around $63.07. The uptrend would remain intact while above this dynamic floor, whereas a loss of that level would expose a deeper retracement as overbought conditions unwind.
(The technical analysis of this story was written with the help of an AI tool.)
Silver is a precious metal highly traded among investors. It has been historically used as a store of value and a medium of exchange. Although less popular than Gold, traders may turn to Silver to diversify their investment portfolio, for its intrinsic value or as a potential hedge during high-inflation periods. Investors can buy physical Silver, in coins or in bars, or trade it through vehicles such as Exchange Traded Funds, which track its price on international markets.
Silver prices can move due to a wide range of factors. Geopolitical instability or fears of a deep recession can make Silver price escalate due to its safe-haven status, although to a lesser extent than Gold’s. As a yieldless asset, Silver tends to rise with lower interest rates. Its moves also depend on how the US Dollar (USD) behaves as the asset is priced in dollars (XAG/USD). A strong Dollar tends to keep the price of Silver at bay, whereas a weaker Dollar is likely to propel prices up. Other factors such as investment demand, mining supply – Silver is much more abundant than Gold – and recycling rates can also affect prices.
Silver is widely used in industry, particularly in sectors such as electronics or solar energy, as it has one of the highest electric conductivity of all metals – more than Copper and Gold. A surge in demand can increase prices, while a decline tends to lower them. Dynamics in the US, Chinese and Indian economies can also contribute to price swings: for the US and particularly China, their big industrial sectors use Silver in various processes; in India, consumers’ demand for the precious metal for jewellery also plays a key role in setting prices.
Silver prices tend to follow Gold’s moves. When Gold prices rise, Silver typically follows suit, as their status as safe-haven assets is similar. The Gold/Silver ratio, which shows the number of ounces of Silver needed to equal the value of one ounce of Gold, may help to determine the relative valuation between both metals. Some investors may consider a high ratio as an indicator that Silver is undervalued, or Gold is overvalued. On the contrary, a low ratio might suggest that Gold is undervalued relative to Silver.



:max_bytes(150000):strip_icc()/coffee-vs-tea-GettyImages-1327091626-5b144a37d98b4de7b5421d9b724f7e12.jpg "Coffee vs. Tea—Which One Is Actually Better for Your Health, According to Nutrition Experts")