The main category of All News Articles.
You can use the search box below to find what you need.
[wd_asp id=1]
The main category of All News Articles.
You can use the search box below to find what you need.
[wd_asp id=1]
The EUR/USD forecast remains slightly up on Monday, as renewed odds of a December Fed rate cut have pressured the US dollar. The pair stays steady above the 1.1500 level as the Dollar Index pulls back while the ECB’s interest rate outlook remains stable.
-Are you looking for the best AI Trading Brokers? Check our detailed guide-
The New York Fed President William’s comments suggested that labor market risks outweigh concerns about inflation. This pushes rate cut expectations, with markets reacting swiftly. The CME FedWatch tool now shows a 70% probability of a rate cut, up from 30% last week.
Still, the Fed’s outlook remains mixed, with other officials, such as Lorie Logan and Susan Collins, cautioning against premature easing. These comments have limited dollar selling, but the broader narrative tilts toward policy loosening.
On the European side, the ECB is widely expected to keep interest rates unchanged in December, supported by stable inflation at around 2% and resilient labor markets. This has kept the EUR/USD safe from downside shocks.
Markets now focus on Germany’s IFO Business Climate Survey, projected to tick up to 88.5. Before the data release, the pair appears to be supported by a firm ECB, reigniting speculation about Fed rate cuts.
Strategists maintain a positive medium-term outlook for the euro, as Danske Bank expects the pair to move to 1.2200 over the next 12 months, as rate differentials narrow. Meanwhile, Morgan Stanley forecasts 1.23 by mid-2026 but anticipates a subsequent pullback.

The EUR/USD 4-hour chart shows a mild bearish tilt as the price remains below the 20-period MA but is supported by the 1.1500 level ahead of swing low support near 1.1470. The RSI staying below the 50.0 mark, pointing south, suggests more weakness.
-Are you looking for the best MT5 Brokers? Check our detailed guide-
However, the overall trend remains one of consolidation, looking for a catalyst to trigger a breakout. If a bullish surprise occurs, the price could test the ultimate resistance near the 200-period MA at 1.1590.
Looking to trade forex now? Invest at eToro!
75% of retail investor accounts lose money when trading CFDs with this provider. You should consider whether you can afford to take the high risk of losing your money.
Dogecoin trades near $0.1478, showing a one-month drop of 25.69% and a weekly decline of 8.3%. The timing is interesting because DOGE enters a major catalyst window as Grayscale prepares to launch the GDOG ETF on the New York Stock Exchange. ETFs often shift market psychology fast, and traders are watching to see whether DOGE reacts like Bitcoin did during its ETF debut or takes a more gradual path.
The setup raises a simple question: Is DOGE preparing for its next major trend?
Grayscale’s new DOGE and XRP ETFs arrive at a time when the market is warming up to regulated crypto products. GDOG will become one of the first Dogecoin-linked ETFs available to U.S. investors, and the fund uses spot DOGE as its underlying asset.
Some elements in this launch stand out:
GDOG converts from an existing private trust
Coinbase handles custody
NYSE Arca provides the listing venue
This combo signals strong compliance alignment. It also gives DOGE a direct pipeline into traditional portfolios. Many observers expect GDOG to attract meaningful attention, especially with analyst Eric Balchunas projecting up to $11 million in first-day volume. It’s rare for a meme coin to gain institutional framing like this. DOGE now stands beside BTC, ETH, and XRP in ETF-ready status.
A key driver of these ETF approvals comes from SEC Chairman Paul Atkins. He shifted the agency’s stance from restrictive enforcement to transparency-based oversight. His “Project Crypto” approach encourages compliant issuers to enter regulated markets.
This creates a healthier environment for DOGE. Even better, GDOG arrives alongside GXRP, forming a broader wave of non-BTC, non-ETH ETFs. If institutions diversify into alternative assets, DOGE may benefit more than expected.
ETF inflows often behave as accelerators. If GDOG follows historical patterns, traders may see an influx of both institutional flows and retail interest. Consider why this matters:
Retail participation rises when access becomes easier
Institutions prefer regulated, custodied exposure
Meme-driven assets benefit from momentum cycles
DOGE has always thrived on narrative shifts. With ETF approval, the narrative gains a new angle: “compliance premium.”
Source: X
The launch of the 21Shares 2x Long DOGE ETF (TXXD) introduces a high-intensity product built for short-term traders. The leveraged nature makes DOGE more visible to traders seeking amplified exposure. It also hints at increased intraday volatility.
This fund tracks DOGE’s daily performance with double sensitivity, which raises an interesting question: Will this increase market depth or exaggerate short-term liquidation events? Or should we treat TXXD with caution due to its compounding effects.
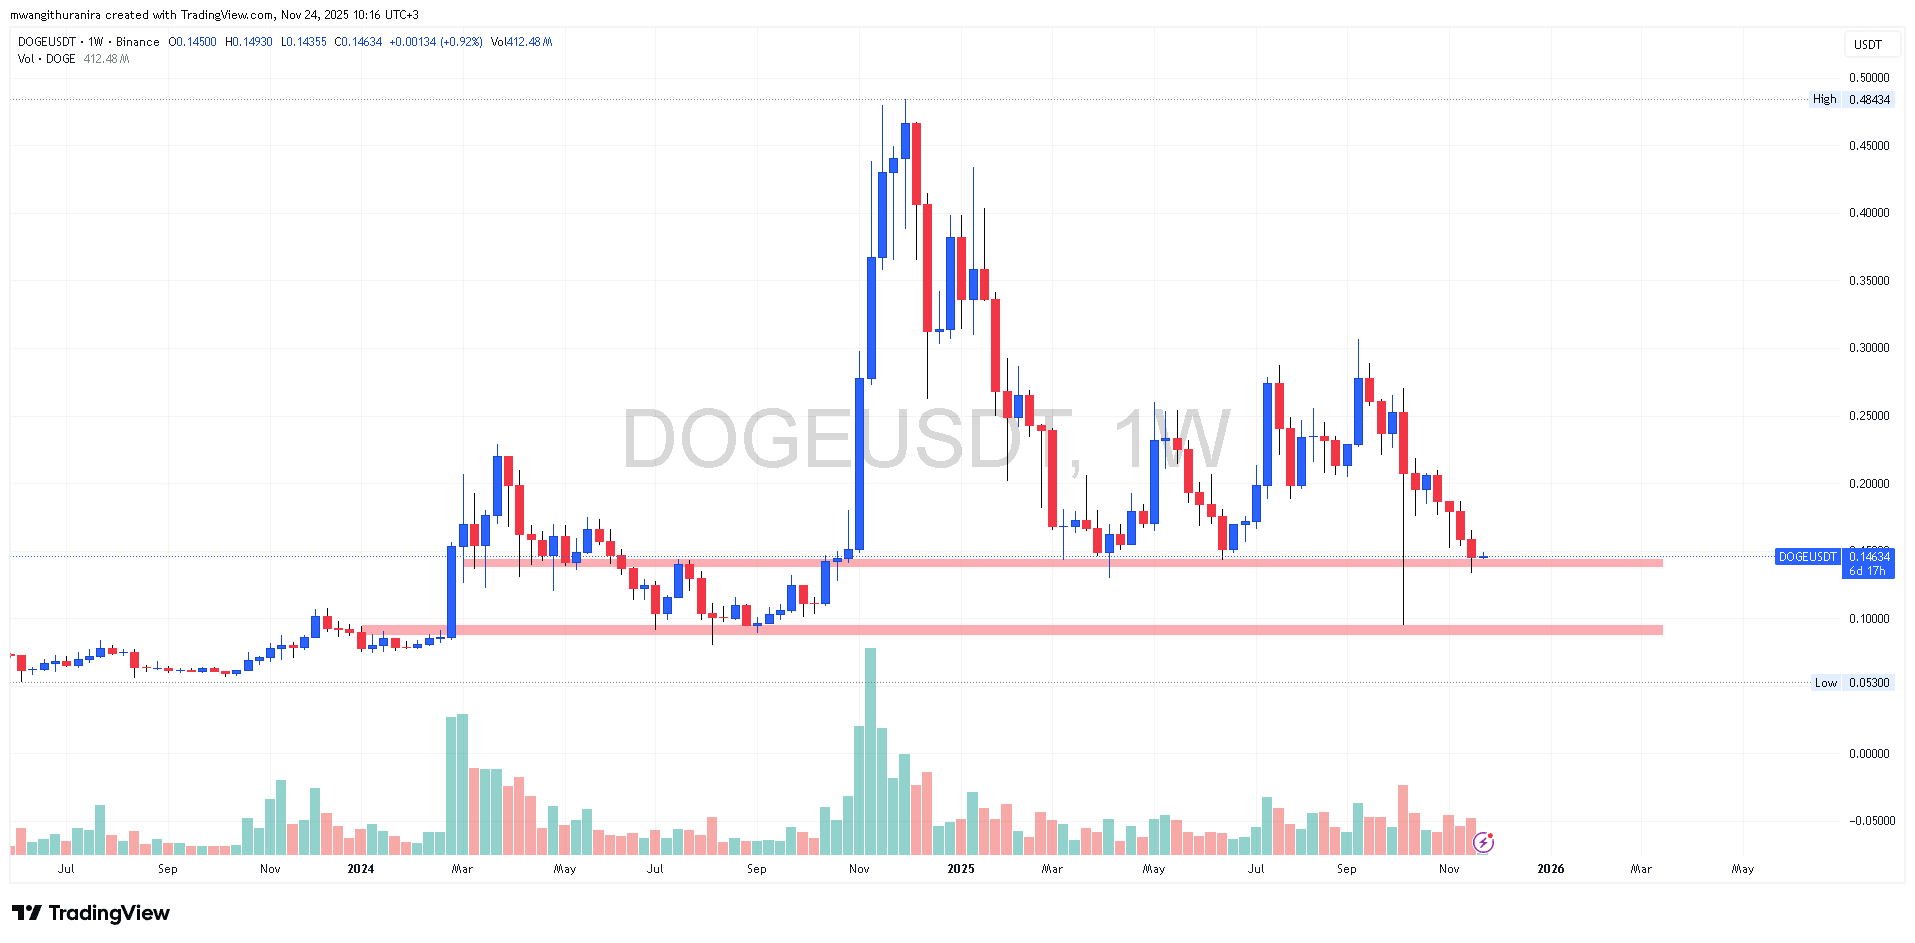
DOGE trades around $0.1466, holding a mid-range position. The structure shows consolidation and weakness, with room for a dip toward $0.09270, a strong historical support area. Many watch that zone closely, if the current one breaks, since it marks a key reaction area.
Source: X
If buyers defend current levels, price may push toward resistance at $0.30 and $0.48. A break and close above those levels would signal a stronger shift toward bullish territory. For now, DOGE remains in a neutral-to-bearish setup while holding potential for a sharp recovery if ETF momentum supports inflows.
| 2025 | $0.11 | $0.19 | $0.42 |
| November 2025 | $0.12 | $0.15 | $0.21 |
| December 2025 | $0.13 | $0.17 | $0.24 |
DOGE’s ecosystem enters a new phase as ETF products strengthen its legitimacy and broaden investor access. The combination of GDOG, TXXD, and improved regulatory clarity gives DOGE fresh catalysts heading into the final months of 2025.
While risks exist, the landscape now favors structured institutional participation. DOGE’s 2025 outlook hinges on whether buyers defend key levels and whether ETF inflows activate the next bullish cycle.
The EURNZD price is forced to form mixed trading, despite its stability within the bullish channel’s levels, affected by the strength of the barrier of 2.0635, fluctuating near 2.0550 level, taking advantage of the continuation of the support stability at 2.0410, increasing the chances of gathering the required bullish momentum of resuming the bullish attack.
Stochastic fluctuation below 80 level confirms the effect of the temporary sideways bias dominance, to keep waiting for gathering bullish momentum to ease the mission of surpassing the barrier at 2.0635, to begin targeting the extra stations near 2.0700 and 2.0760.
The expected trading range for today is between 2.0475 and 2.0635
Trend forecast: Bullish
The GBPJPY pair ended its last bullish rally by recording the target at 206.90, facing strong barriers to push it to activate the attempts of gathering the gains by reaching 204.30, to provide some sideways trading by its fluctuation near %2.00 Fibonacci extension level at 205.20.
Note that stochastic exit from the overbought level might force the price to resume the bearish corrective attempts, to renew the pressure on 204.20 level, then wait for testing extra support at 203.75.
The expected trading range for today is between 204.30 and 205.70
Trend forecast: Bearish
ADA starts to recover near $0.40 as AlphaPepe’s high-conviction presale emerges as the favoured side-bet.
Cardano has spent much of the past month on the defensive. After trading comfortably above 0.50-0.60 USD in October, ADA slid hard through November, dropping roughly 30% and briefly threatening a deeper breakdown. That drawdown pushed it into what several on-chain and technical models describe as an “extreme buy” zone, with valuation metrics flashing undervaluation even as price continued to bleed.
Now, ADA is starting to fight back. Recent data shows Cardano trading near 0.40 USD https://coinmarketcap.com/currencies/cardano/, with some exchanges marking it around 0.40-0.42 USD after a bounce from the low 0.30s. Network headlines are turning positive again: the chain just surpassed 116 million transactions, recent governance stress tests have been digested, and analysts are beginning to talk about recovery rather than capitulation.
Alongside this emerging rebound story, a new side-bet is gaining traction among traders: AlphaPepe (ALPE) https://alphapepe.io/, a meme-coin presale on BNB Chain that kept growing even during the harshest part of the bear. As ADA reclaims lost ground, AlphaPepe is becoming a popular complement for investors seeking a more aggressive edge.
ADA Reclaims Support After a Punishing Drop
Over the last 30 days, Cardano’s price action has been brutal but instructive. ADA fell from the mid-0.50s toward the low 0.30s, wiping out weeks of gains and flipping prior support levels into resistance almost overnight. A network incident that temporarily slowed block production added short-term anxiety, but price ultimately held above the critical 0.30 USD zone that many analysts flagged as make-or-break support.
Following that flush, ADA began to stabilise. Today’s trading near 0.40 USD suggests buyers have stepped back in around that area, treating it as a reasonable entry zone rather than abandoning the asset. On-chain data backs this up: market value to realised value (MVRV) ratios and other cycle indicators show ADA in an historically attractive band, even as some technical signals still point to lingering downside risk.
At the same time, Cardano’s fundamental story has not gone away. The network just crossed more than 116 million lifetime transactions, conference coverage from Cardano Summit 2025 highlighted progress on governance, layer-2s and identity, and the Cardano Foundation has publicly discussed the roadmap toward a potential spot ADA ETF in the coming year. The result is a curious mix: price weakness, but growing confidence that the long-term thesis is intact.
Cardano Price Prediction: Recovery Path with Conditions
Short-term ADA forecasts now revolve around one core question: can the 0.30-0.35 USD region remain a durable floor? Most serious analysis agrees that holding above this band keeps a bullish recovery scenario alive. If that zone fails decisively, more bearish targets in the low 0.20s come into focus.
Assuming support holds, there is a growing consensus that ADA can grind higher over the coming weeks. Several projection models published in November see average prices around the low 0.40s for the remainder of the month, with potential to reach the mid-0.50s if market conditions improve into December. One widely cited forecast suggests ADA could trade in a 0.41-0.60 USD channel through late 2025, with the upper end representing roughly a 40-45% gain from current levels if everything breaks in its favour.
Over a longer horizon, into 2026-2030, the range of predictions widens dramatically. Some models cap upside around 1 USD, others see room for a return to prior cycle highs in the 2-3 USD area, and a few outliers call for even higher valuations. The common thread is that Cardano’s future path depends on adoption of its DeFi stack, real-world tokenisation, scaling progress and whether it can convert its research-first reputation into dominant user share.
For now, the near-term story is simpler: ADA has reclaimed some lost ground and is trying to turn a bruising drawdown into a base-building phase.
AlphaPepe: The Side-Bet That Survived the Bear
While Cardano fought to hold the 0.30 USD line, AlphaPepe https://alphapepe.io/ was quietly sending a very different signal. As majors bled and sentiment soured, AlphaPepe’s presale was still onboarding more than 100 new holders per day. That kind of growth in the middle of a risk-off environment is unusual. It suggests that even while traders were de-risking from large caps, they were still willing to allocate fresh capital to a presale they considered unusually trustworthy.
Now that markets are stabilising and Bitcoin is back above 85,000 USD, that trickle has become a stronger current. AlphaPepe’s holder count has pushed past 3,700, the presale total is closing in on the 450,000 USD mark, and mentions of ALPE are spreading across presale roundups and meme-coin watchlists. In other words, the project that grew through the bear is now accelerating into the recovery.
At the heart of this confidence is how AlphaPepe has been structured. Tokens are delivered instantly to investors as they buy – no waiting for a claim portal, no uncertain unlock schedule. That instant delivery has become one of the project’s strongest trust signals, especially for traders scarred by presales that locked funds for months. Staking is live during the presale, letting buyers put their ALPE to work immediately, and multiple USDT reward rounds have already been paid out to participants, proving that the rewards model is more than marketing.
The $1,000 AlphaPepe Scenario and Structural Hype
Investors are not just attracted to mechanics; they are running the numbers. At a presale price around 0.00743 USD, a 1,000 USD allocation buys roughly 134,500 ALPE tokens.
If, after listing and price discovery, AlphaPepe were to trade at around 0.075 USD – ten times the presale level – that 1,000 USD entry would be worth roughly 10,000 USD. This is purely hypothetical and not a promise, but it illustrates why traders are willing to treat AlphaPepe as a high-upside complement to more conservative ADA exposure. The asymmetry simply does not exist in a large-cap like Cardano at current valuations.
AlphaPepe’s presale is also designed around structural price momentum. Every stage of the sale runs on a schedule of regular price increases, typically weekly. As each stage closes, the token price edges higher, ensuring that earlier buyers enjoy the lowest cost basis and reinforcing a sense of urgency among new entrants. This structural step-up model is feeding hype organically: each time the price ticks up, more traders realise that waiting simply means paying more later.
Early Callers Are Doubling Down
Part of what is driving the narrative now is that several analysts, YouTubers and presale commentators flagged AlphaPepe early, before it had mainstream attention. They pointed to features that are still rare in meme-coin presales: instant token delivery, live staking, a 10/10 audit score, locked liquidity and genuine reward payouts.
Those same voices are not quietly walking away now that AlphaPepe has gained traction; they are doing the opposite. Many have publicly stated that they are increasing their exposure, arguing that the original thesis – a meme coin with real mechanics and strong community growth – is being validated in real time. That consistency between early conviction and current positioning is driving a second wave of interest, as newer traders tend to pay attention to projects where early advocates are still clearly committed.
ADA and AlphaPepe: A Two-Layer Strategy
For investors, the emerging strategy is not to choose between Cardano and AlphaPepe, but to use them together. ADA provides the fundamentals-based layer: a research-driven, proof-of-stake chain with a deep development roadmap, growing transaction volume and improving institutional narratives, including talk of a future ADA ETF. Its job in a portfolio is to act as a core smart-contract allocation, potentially benefiting from broader market recovery and continued on-chain growth.
AlphaPepe is the speculative overlay: a high-beta meme-coin presale with credible delivery and clear upside scenarios, powered by instant token access, staking, reward pools and a structurally rising presale price. Its role is to provide the asymmetric return potential that large caps like ADA cannot realistically offer from current levels.
In a recovering market, that combination is compelling. ADA can regain lost ground as sentiment improves; AlphaPepe can amplify upside if meme-coin risk appetite returns.
Website: https://alphapepe.io/
Telegram: https://t.me/alphapepejoin
X: https://x.com/alphapepebsc
FAQs
Where is Cardano trading now and what has changed recently?
Cardano is trading near 0.40 USD after falling from the mid-0.50s. It has bounced from support around the low 0.30s and is now trying to build a base above that zone, with on-chain metrics suggesting undervaluation relative to recent history.
What do analysts see for ADA in the near term?
Most short-term projections see ADA oscillating in a 0.40-0.55 USD range if support holds, with the potential to approach 0.60 USD in a more optimistic recovery scenario. Losing the 0.30-0.34 USD region would weaken that view significantly.
Why is AlphaPepe being mentioned alongside Cardano?
Because ADA is a fundamentally strong but slower-moving large-cap, while AlphaPepe offers high-beta, early-stage upside. Many investors are using ADA as a core holding and AlphaPepe as a speculative side-bet.
How did AlphaPepe perform during the bear phase?
Even in the most bearish stretch, more than 100 new holders were joining AlphaPepe’s presale each day, showing consistent confidence despite wider market fear. That growth has accelerated as conditions improved.
What could 1,000 USD in AlphaPepe become?
At a presale price of about 0.00743 USD, 1,000 USD buys around 134,500 ALPE. If ALPE were to trade at 0.075 USD after listing, that position would be worth roughly 10,000 USD. This is a scenario, not a guarantee, but it illustrates the kind of asymmetry that draws traders in.
AFFILIATE AVENUE LTD
128 City Road, London, England, EC1V 2NX
cs@coinfunnel.io
Jack Duffy
At CoinFunnel, we help blockchain projects and crypto startups grow their audience, increase adoption, and build community through strategic marketing.
This release was published on openPR.
The
Aave
(AAVE) ecosystem is currently experiencing increased speculative activity, as both on-chain metrics and market trends indicate the possibility of heightened short-term fluctuations. Market participants are paying close attention to the token’s price action around the 0.57 support mark—a pivotal level that, if lost, could prompt additional selling. Recent whale transactions and leveraged trades have brought further attention to the mounting risks associated with the DeFi lending protocol’s native asset.
A prominent Aave whale has recently increased their holdings, acquiring 24,000 AAVE tokens and bringing their total to 276,000 AAVE at an average entry price of $165 each. This accumulation,
according to COINOTAG News
, demonstrates that large investors continue to show interest despite the token’s history of price swings. Nevertheless, this whale’s position remains exposed to potential downturns, as seen during the October 11 flash crash when part of their leveraged holdings was liquidated at $101, resulting in a loss of 32,000 AAVE.
At the same time,
another Aave participant has started to reduce leverage
on an $80 million long bet in
wrapped Bitcoin
(WBTC), reflecting a more cautious stance as the position approaches a $65,436 liquidation point. This position, open since May 2025, consists of 550.2
WBTC
supplied to Aave and $28.09 million in stablecoin liabilities. Should the price fall to the critical threshold, forced liquidations could occur, potentially intensifying downward momentum for both WBTC and AAVE.
These risks are further magnified by Aave’s growing footprint within the DeFi sector.
Tangem has just introduced a new feature
that enables users to earn real-time returns on stablecoins through Aave’s platform. While this development highlights Aave’s foundational role in decentralized finance, it also brings up questions about liquidity management and the risks associated with concentrated leverage.
Technical analysis points to a fragile outlook for the AAVE token. Both traders and analysts are watching the 0.57 Fibonacci retracement as a crucial psychological level. A breach could lead to a wider selloff, especially if liquidations pick up pace. “The market is on the verge of a correction,” commented one DeFi strategist, emphasizing that the actions of major holders and leveraged traders often serve as early warnings of broader market stress.
At present, Aave’s ecosystem presents both opportunities and risks: while innovation and user growth are accelerating, the same factors that drive expansion could also introduce volatility if not carefully managed.
Platinum price faced a key support extension in its last negative attempts near$1488.00, which forces it to delay the bearish corrective scenario and begin providing sideways trading, fluctuating near $1530.00.
Providing bullish momentum by the main indicators, especially with stochastic exit from the oversold level that might help it to provide new chance for achieving some gains by its rally towards $1575.00 then repeating the pressure on the barrier at $1605.00.
The expected trading range for today is between $1500.00 and $1575.00
Trend forecast: Bullish
The EURJPY pair confirmed its surrender to the bearish corrective bias dominance by providing several negative closes below 181.75 barrier, forming some corrective trading by targeting 179.75 level.
Despite the main stability within the bullish channel’s levels, the stability below the previously mentioned barrier and stochastic attempt to provide negative momentum support the dominance of the corrective bias, to target the initial support at 179.30 and breaking it might extend the trading towards 178.60, forming the main target of the current trading.
The expected trading range for today is between 179.30 and 181.10
Trend forecast: Bearish
Jakarta, Pintu News – Dogecoin has experienced a drop in value in recent days, in line with the bearish sentiment sweeping the crypto market at large. Despite the decline, Dogecoin is currently overvalued due to heightened speculation ahead of the launch of the Dogecoin ETF by Grayscale (GDOG). This coming Monday could be a significant turning point for Dogecoin’s future.
Dogecoin’s (DOGE) NVT ratio experienced a sharp spike, indicating a mismatch between valuation and on-chain activity. This ratio compares market capitalization to transaction volume, and spikes usually indicate limited transactional utility compared to price. Although Dogecoin gained a lot of social attention and widespread support, its actual transaction rate did not follow suit.
This mismatch often leads to overvaluation, which in bearish conditions can trigger a decline. However, this spike coincides with the anticipated launch of the Dogecoin ETF by Grayscale. This ETF is expected to attract significant capital flows, which could reset the NVT Ratio and restore balance between price and on-chain activity.
Also Read: Robert Kiyosaki Sells Bitcoin at $90,000: From $250K Target to Real Business, Here’s Why!
 Surge? Keep an eye out for its latest ETF launch!")
Currently, Dogecoin is trading at $0.143 and is holding near the $0.142 support level. The meme coin is stuck under a month-long downtrend that it has repeatedly failed to break. The current bearish conditions make recovery difficult in the absence of significant catalysts.
The launch of the DOGE ETF could be that catalyst. A successful debut could lift DOGE above $0.151, paving the way towards $0.165. A move of this scale would invalidate the downtrend and signal a shift in momentum supported by fresh inflows.
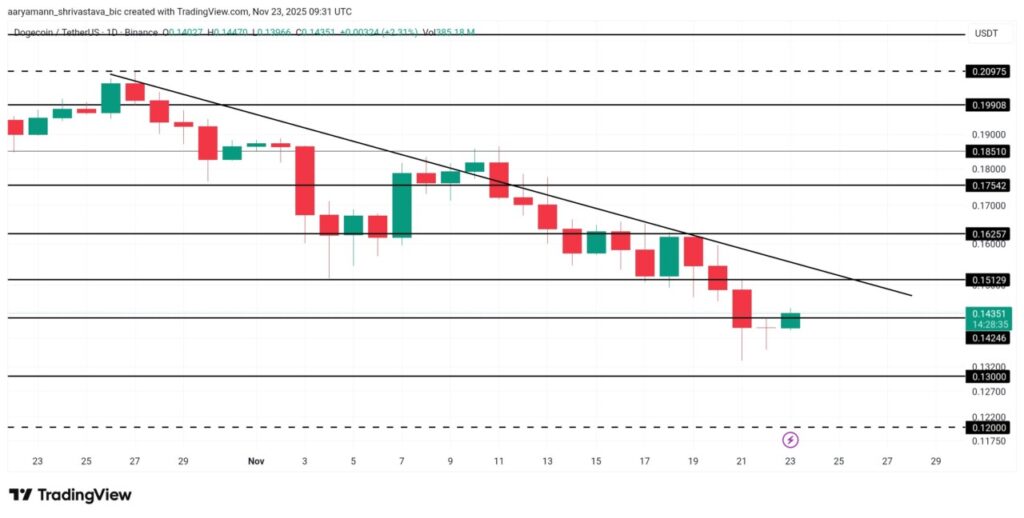
If the ETF hype does not turn into buying pressure, Dogecoin could extend its decline. A drop towards $0.130 remains possible. However, if DOGE does not experience this sharp decline, it will likely continue to struggle below the $0.151 resistance, extending its ongoing downtrend.
With the launch of the Dogecoin ETF by Grayscale, investors and market watchers should keep an eye on Dogecoin’s price dynamics which could change significantly. Next Monday may be a crucial day for Dogecoin’s future, especially in determining whether the coin will continue to decline or start a new upward trend.
Also Read: Cardano Predicted to Drop Out of Top 20 by 2026, Nansen CEO Mentions ‘Ghost Chain’
Follow us on Google News to get the latest information about crypto and blockchain technology. Check Bitcoin price today, Solana price today, Pepe coin and other crypto asset prices through Pintu Market.
Enjoy an easy and secure crypto trading experience by downloading Pintu crypto app via Google Play Store or App Store now. Also, get a web trading experience with various advanced trading tools such as pro charting, various types of order types, and portfolio tracker only at Pintu Pro.
*Disclaimer
This content aims to enrich readers’ information. Pintu collects this information from various relevant sources and is not influenced by outside parties. Note that an asset’s past performance does not determine its projected future performance. Crypto trading activities are subject to high risk and volatility, always do your own research and use cold hard cash before investing. All activities of buying andselling Bitcoin and other crypto asset investments are the responsibility of the reader.
A1: Dogecoin (DOGE) is a cryptocurrency that was originally created as a joke but has grown into an asset with huge community support and a significant market capitalization.
A2: The Dogecoin ETF by Grayscale is a fund that aims to give investors exposure to Dogecoin without the need for them to hold the coin directly, easing investment in this crypto asset.
A3: The launch of the Dogecoin ETF by Grayscale is anticipated to happen this coming Monday, although the exact date has not been officially announced.
A4: The NVT ratio is a metric that compares the market capitalization of a crypto to its on-chain transaction volume. For Dogecoin, the spike in this ratio suggests that the current price may not be supported by enough transactional activity.
A5: The launch of the Dogecoin ETF could potentially boost the price of DOGE if it manages to attract new capital flows into the asset, but failure to attract buyers could lead to further declines.
A common hot beverage costing a mere 4p could “mimic” the effects of weight loss medication, suggests recent findings. Researchers have identified certain natural compounds present in our diets that could potentially mirror the effects of GLP-1 injections.
GLP-1 (glucagon-like peptide-1) is a hormone generated in the gut that aids in regulating blood sugar and appetite. Treatments known as GLP-1 inhibitors have seen increased usage in recent years due to their effectiveness in managing blood sugar levels among diabetic patients and aiding weight loss.
These medications are available as injections and can be obtained through the NHS for eligible patients. However, the new findings suggest that specific foods and drinks could produce similar effects to GLP-1 inhibitors.
Researchers from Heliopolis University in Cairo recently published a review of the existing evidence in the journal Toxicology Reports, suggesting that GLP-1 might be influenced by natural compounds from diet.
The team highlighted that one of the reasons they are exploring natural alternatives to the GLP-1 injections is due to the cost and accessibility of the medications. This could also help avoid any potential side effects of the jabs, which can include vomiting, diarrhoea, and cramps.
In the study, researchers stated: “It’s about increasing treatment options and personalising it to each patient’s preferences and needs.”
As reported by Medical News Today, green tea was found to be among the foods and drinks that could affect GLP-1.
Others included:
However, bariatric surgeon and medical director of MemorialCare Surgical Weight Loss Centre, Mir Ali, who wasn’t part of the research, emphasised that these ingredients shouldn’t be viewed as “alternatives” to weight loss injections. He told Medical News Today: “Natural ingredients may help boost metabolism.
“However, it is a mild effect. These [compounds] should not be considered an alternative to the GLP-1 medications.”
He clarified that these natural ingredients function through various mechanisms, “either by stimulating the central nervous system to boost metabolism (caffeine), promote fat burning (green tea extract, capsaicin), or activating other enzymes (berberine)”.
Earlier studies have connected green tea consumption with shedding pounds. One study, featured in the Journal of Functional Foods, recommended drinking catechin-enriched green tea for precisely this purpose.
The research team stated: “Average visceral fat area, body weight, and body fat were reduced significantly by catechin-enriched green tea treatment but these effects were not seen in the control group with per-protocol sets analysis.
“The decrease at week 12 in the visceral fat area in the catechin group was greater than that in the control group. Thus, consumption of the catechin-enriched green tea beverage for 12 weeks induced visceral fat loss in Chinese adults with a high proportion of abdominal visceral fat.”
The study built upon previous research that suggested the weight loss benefits of green tea. “In recent years, there have been many studies on the beneficial effects of green tea in treating obesity and improving glucose and lipid metabolism,” the authors stated.
At the time of writing, a pack of 20 green tea bags could be purchased from Tesco for 80p, which works out at 4p per cup.