The main category of All News Articles.
You can use the search box below to find what you need.
[wd_asp id=1]
The main category of All News Articles.
You can use the search box below to find what you need.
[wd_asp id=1]
GLP-1 style treatments like Ozempic and Mounjaro are doing wonders when it comes to helping people lose unwanted bodyfat, but research indicates that lean mass could also fall thanks to GLP-1, leading to an almost 40% drop in skeletal muscle in some cases. That’s why news of a new drug that can burn fat while preserving muscle could be a game changer, even complimenting existing treatments.
Encouraging results from a study on the new drug, known technically as a “GRK-biased adrenergic agonist,” have been extremely promising. Firstly, it’s available as an oral pill, meaning no nasty needles, and secondly, this compound doesn’t act on hunger levels. GRK-biased drugs boost metabolic activity within the muscle instead of encouraging appetite loss.
Results from an important study that came as a result of work by the Karolinska Institutet and Stockholm University, both in Sweden, were recently published in the Cell Press journal, and come from an important phase I clinical trial involving 48 healthy volunteers alongside 25 individuals with type 2 diabetes, showing that it could lower blood pressure and increase fat burning capabilities within the body, leading to longer lives.
The active substance in this novel drug is a lab developed compound dubbed “Compound 15,” that benefits muscle function but doesn’t overstimulate the heart. “Our results point to a future where we can improve metabolic health without losing muscle mass,” explained Tore Bengtsson, who is professor at the Department of Molecular Bioscience, Wenner-Gren Institute, Stockholm University. And that’s important, because “muscle mass is also directly correlated with life expectancy,” he added.
Because Compound 15 works via a different pathway to GLP-1 treatments, it may be effective as a standalone drug or paired with others like Ozempic or Mounjaro for supercharged results. So, for those who have shunned GLP-1s because of needles and the potential effects on muscle mass, this is seriously great news. “This drug represents a completely new type of treatment and has the potential to be of great importance for patients with type 2 diabetes and obesity,” said Shane C. Wright, who is an assistant professor at the Department of Physiology and Pharmacology at Karolinska Institutet. “Our substance appears to promote healthy weight loss, and, in addition, patients do not have to take injections.”
Experts say the next phase in rolling out the miracle drug will depend on a larger, phase II clinical trial, but medical practitioners and those who like to stay in shape are already excited for the prospect of an obesity or type 2 diabetes drug that can protect muscle, especially concerning the recent news that Metformin, another popular type 2 diabetes treatment, can potentially undermine the benefits of exercise.
Solana just launched a quantum-resistant testnet with Project Eleven, aiming to future-proof its blockchain against quantum threats. While the tech is impressive, the market didn’t seem to care as Solana’s price barely moved.
That’s because investors have their eyes elsewhere. DeepSnitch AI’s presale is gaining attention with $825K+ raised, and actual AI tools live before launch. Regardless of Dogecoin price predictions, DeepSnitch AI might be the next altcoin to hit $1 in 2026.
The Solana Foundation has partnered with security firm Project Eleven to test quantum-resistant cryptography on a dedicated Solana testnet. The pilot uses post-quantum digital signatures to complete fully on-chain transactions.
The move comes amid growing concern over the long-term threat of quantum computers breaking current cryptographic standards. While some experts like Vitalik Buterin suggest this could happen by 2030, others argue it’s still decades away.
Solana’s testnet is part of its broader mission to future-proof its blockchain, though it has not confirmed which encryption standard was used.
DeepSnitch AI was made for traders who are tired of being the exit liquidity. If you’ve ever felt like you were two steps behind the big players, DeepSnitch AI is your way to catch up, and maybe even beat them.

That edge could be critical heading into 2026. With the FED cutting rates in October and December, the stage is set for a massive crypto rally. And it’s pretty clear that the AI + crypto sector is going to lead it. Gartner’s $1.5 trillion forecast for AI spending in 2025 says it all.
Three of its five planned AI agents are already working in the background. SnitchScan checks contracts for hidden traps. SnitchFeed watches whale wallets and alerts you when they move. SnitchGPT gives you market answers with a simple text prompt.
With a current presale price of just $0.02846, DSNT is capable of outperforming any Dogecoin price prediction. More than $825,000 has already been raised, over 20 million tokens are staked, and Tier 1 listing rumors are swirling ahead of the January launch. Now is the last time you can catch DSNT at an early valuation.
Dogecoin was sitting at around $0.13 on December 17. Support at $0.128 is holding, but momentum is fading. According to a popular Dogecoin price prediction, if that level breaks, the price may drop toward $0.10. A move above $0.15 could flip sentiment bullish again.
But there’s a problem: DOGE spot ETFs are failing to impress. Since launching on November 30, they’ve pulled in just $2.16M, only 0.03% of DOGE’s market cap. On December 16, they had zero inflows, while Solana brought in $3.64M and Chainlink $1.38M. Daily volumes hover around $49K. Traditional investors aren’t investing in meme coins; they prefer tokens with utility.
That’s why the Dogecoin price predictions remain flat while DeepSnitch AI is aiming for the 100x returns. The AI protocol is offering something nobody could have before: an intelligence layer that can offer retail traders the same insights institutions have.
SOL was holding near $127 on December 17, a strong support zone. Buyers are stepping back in, and a cup-and-handle pattern is forming. A breakout above $128 could send SOL toward $135 or even $200 if momentum builds.
Charles Schwab added SOL futures to its platform, giving institutional players a way to trade Solana without touching the token itself. This move mirrors what happened with Bitcoin in 2017 and Ethereum in 2021, the moment they became part of traditional finance.
With Schwab in the game, hedge funds and asset managers can now join in without custody risks. That brings more capital and changes how SOL trades. It’s no longer just about spot demand.
The Dogecoin price prediction might still look bullish on the surface, but the meme magic is wearing thin. ETF flows are weak, and investors are shifting toward tokens with genuine utility. That’s exactly where DeepSnitch AI comes in.
With three live AI agents and over $825K already raised, DSNT is creating a new trend. Whales are already stacking at $0.02846, and now’s your chance to get in early, with DSNTVIP50 or DSNTVIP100 unlocking up to 100% bonus tokens.
Visit the official DeepSnitch AI website, join Telegram, and follow on X (Twitter) for the latest updates.
Yes. While the DOGE future projection looks uncertain due to weak ETF flows, DeepSnitch AI is offering stronger fundamentals and higher upside going into 2026.
Absolutely. Dogecoin bullish momentum is slowing, but DeepSnitch AI is positioned to outperform DOGE in both utility and price growth.
Right now, DeepSnitch AI shows clearer adoption signals. DOGE ETF inflows remain low, while DSNT has over $825K raised and a working AI dashboard already live.
Today’s bearish behavior adds to the likelihood that the next lower key support zone may be reached before the current retracement completes. The 61.8% Fibonacci retracement at $3.89 defined this week’s support zone. The reaction of price resistance represented by the 50-day line and a top channel line has shown the sellers remaining in charge. The two indicators show a similar price area for resistance and today’s bearish reaction confirms it. Once prior key support is shown as resistance, the downtrend may be ready to proceed. However, a drop below and daily close below this week’s low of $3.84 is still needed for a bearish continuation signal.
If natural gas fails to take out today’s high before a new trend low, then the next lower target looks likely to be reached. The 200-day average at $3.58 anchors the next lower price zone, along with a long-term uptrend line and a horizontal level around $3.59. That price area was shown as both clear support and resistance in the past. Most recently with the October high at $3.59.
More significantly, the 2023 peak was at $3.64. If that zone fails to reverse price, then the 78.6% Fibonacci retracement at $3.45 becomes a target. There is also confirmation for the 200-day price zone in the weekly chart as the 50-week and 20-week averages are at $3.63 and $3.61, respectively.
On the upside, a decisive breakout above today’s high would be needed for a bullish reversal. That would put natural gas in a position to challenge resistance near the 20-day average, now at $4.55 and falling.
Natural gas’s bounce has stalled exactly at flipped support with a bearish engulfing pattern, reinforcing seller dominance and raising odds of a confirmed break below $3.84. Hold above today’s high to keep countertrend hopes alive; failure opens acceleration toward the powerful 200-day confluence at $3.58–$3.64 and potentially $3.45 if that breaks.
The GBPUSD pair has transformed into a technical battleground as the trading week nears its close. A combination of a divided Bank of England (BoE) and a cooling US inflation report has created a “whipsaw” environment, leaving the price resting precariously on a significant layer of technical support.
The BoE Catalyst: A narrow 5-4 vote for a “hawkish cut” by the Bank of England initially sparked Sterling strength, signaling that the path to future rate cuts remains steep.
The CPI Whipsaw: A soft US CPI print (2.7%) sent the pair to a multi-week high of 1.3446 before a massive retracement saw the pair surrender all daily gains.
The Technical Floor: The price is currently testing a “cluster” of four major moving averages between 1.3348 and 1.3380, a zone that will define the trend for the Friday close.
The initial leg of the GBPUSD rally was fundamentally driven. The Bank of England’s decision to cut rates—but with a clear 5-4 split—indicated to the markets that the BoE is not in a rush to ease aggressively. This “hawkish lean” gave the British Pound a head start against a softening Greenback.
Later, the US Consumer Price Index (CPI) added fuel to the fire. The weaker-than-expected inflation data triggered a sharp sell-off in the US Dollar, propelling the “Cable” above a series of key daily and hourly moving averages. This move saw the pair challenge the highs of the last two weeks, specifically testing the Tuesday peak near 1.3455.
Despite the breakout, momentum failed to hold. The pair has retraced back into a dense zone where four critical moving averages are currently overlapping. This “cluster” acts as a massive technical pivot point:
As long as the price remains within or above this zone, the “Up and Down” volatility theme persists. The price action today reached as low as 1.3370 before stabilizing slightly, keeping the market in a state of high suspense.
As we transition into the final session of the week, the cluster of moving averages will serve as the primary barometer for directional bias.
For the buyers to reclaim the driver’s seat, they must keep the price sustained above the 1.33804 (100-hour MA). A push above the 1.3405 swing area is required to confirm that the bears have been flushed out. If successful, the door opens for another run toward the recent highs at 1.34526.
If the sellers gain enough traction to break below the bottom of the cluster at 1.33488 (200-day MA), the technical picture turns decidedly bearish. A break here would likely trigger a retest of the weekly low at 1.33118, with a secondary target at last week’s low and the key 38.2% Fibonacci retracement level of 1.32833.
In the video above, Greg Michalowski, author ofAttacking Currency Trends, provides a deep dive into these GBPUSD technical levels. He breaks down the real-time price action, helps you define the bias, the risk, and the specific targets that will matter most today and going forward.
Be aware. Be prepared.
Synaptigen Review: An In-Depth Look at the Ingredients, Intended Benefits, and Who It May Be For
This article is provided for educational and informational purposes only and is not intended to replace individualized medical, nutritional, or professional advice. Many factors, including age, genetics, lifestyle, medications, and underlying health conditions can influence cognitive health. Readers are encouraged to consult a qualified healthcare professional before starting any new dietary supplement, especially if they are pregnant, nursing, taking medication, or managing a medical condition.
Synaptigen is a dietary supplement, not a medication. Statements about ingredients discussed in this article are based on publicly available research and are presented for general educational context only. Synaptigen as a finished product has not been clinically evaluated by the FDA, and individual results may vary.
Throughout this report, all product features, pricing, guarantees, and policies are attributed directly to the company’s official website as of publication and are subject to change. Readers are encouraged to verify details directly with the brand before making any purchase decisions.
Disclosure: If you register through this link, a commission may be earned at no additional cost to you.
Why Cognitive Changes Feel So Frustrating — And Why Many People Start Looking for Support
For many people, changes in memory, focus, or mental sharpness don’t happen all at once. They tend to show up quietly — a forgotten name here, a moment of mental fog there, or a growing sense that staying mentally sharp now takes more effort than it used to.
What often makes this experience frustrating isn’t just the change itself, but the uncertainty around it. Is this simply part of normal aging? Is it related to stress, sleep, nutrition, or daily habits? Or is it something that could potentially be supported with the right lifestyle adjustments and nutritional choices?
For readers actively searching for answers, the challenge isn’t a lack of options — it’s too many conflicting claims. Some products promise dramatic outcomes. Others lean heavily on scientific jargon without explaining what it actually means for everyday cognitive function. And many leave readers unsure where ingredient research ends and marketing language begins.
That gap is exactly where interest in cognitive-support supplements like Synaptigen tends to emerge.
Rather than positioning itself as a quick fix, Synaptigen is presented by the company as a daily brain-support formula designed to help maintain memory, focus, and mental clarity over time. The brand’s messaging emphasizes support, nourishment, and long-term cognitive maintenance — concepts that resonate with people who want to stay proactive about brain health without jumping to extreme solutions.
What Is Synaptigen? A Brand-Positioned Overview
Synaptigen is a dietary supplement marketed by its manufacturer as a daily cognitive support formula intended to help maintain memory, focus, and overall mental clarity as part of a long-term wellness routine.
According to the company, Synaptigen is designed for adults who are interested in supporting normal brain function through nutrition rather than relying solely on stimulants or short-term cognitive enhancers. The product is positioned around the idea that brain health, like physical health, benefits from consistent nutritional support over time, especially as natural changes occur with age.
The brand states that Synaptigen’s formula combines probiotics, prebiotics, and plant-derived nutrients in a single, easy-to-use tablet. Rather than focusing on immediate stimulation, the company frames its approach around supporting the internal environment in which brain cells function, with an emphasis on nourishment and maintenance.
Importantly, Synaptigen is presented as a dietary supplement, not a medication. The company does not describe it as a treatment, therapy, or cure for any medical condition. Instead, it is intended to complement healthy lifestyle habits such as balanced nutrition, adequate sleep, physical activity, and stress management.
From a formulation standpoint, the brand highlights several characteristics that may appeal to certain consumers, including:
As with any supplement, whether Synaptigen is an appropriate choice depends on individual needs, expectations, and health considerations. Understanding how the company says the formula is structured — and how its ingredients are intended to play a role — is a necessary next step before evaluating fit.
A Closer Look at the Ingredients in Synaptigen
To evaluate any cognitive support supplement responsibly, it’s important to separate ingredient research from product-level claims. What follows is a high-level overview of the individual ingredients listed by the company, along with context on how these ingredients are generally discussed in scientific and nutritional literature.
This section is intended for educational purposes only. While certain ingredients have been studied independently, Synaptigen as a finished product has not been clinically studied, and outcomes can vary from person to person.
Probiotic Strains
According to the company, Synaptigen includes several probiotic strains selected for their potential role in supporting gut health, which some research suggests may be connected to broader neurological and cognitive processes through the gut–brain axis.
Lactobacillus paracasei
This probiotic strain is commonly studied for its role in digestive balance and immune system interaction. In ingredient-level research, Lactobacillus paracasei has been explored for how gut microbiota may influence inflammation and metabolic signaling — factors that researchers believe can indirectly affect overall brain function.
Lactobacillus reuteri
Lactobacillus reuteri is another well-researched probiotic strain. Ingredient studies often examine its role in maintaining gut lining integrity and supporting balanced microbial populations. Some researchers have investigated how these functions may contribute to general neurological signaling through gut–brain communication pathways, though these effects are not specific to any single supplement.
Bifidobacterium lactis BL-04
This strain is frequently included in probiotic formulations and is typically studied for immune support and digestive comfort. Ingredient-level literature suggests that balanced gut bacteria may play a role in how the body manages stress responses and inflammatory markers, which are areas of interest in broader cognitive health research.
Prebiotic Support
Inulin
Inulin is a naturally occurring prebiotic fiber that serves as a food source for beneficial gut bacteria. Research at the ingredient level shows that prebiotics like inulin can help support the growth and activity of probiotics, potentially enhancing their ability to contribute to overall gut balance. A healthier gut environment is often discussed in research as one factor that may influence mental clarity and overall wellness.
Mineral and Plant-Based Components
Tricalcium Phosphate
Tricalcium phosphate is commonly used in supplements as a source of calcium and as a stabilizing or anti-caking agent. Calcium plays a recognized role in normal nerve signaling and cellular communication, though its inclusion in supplements is generally intended to support overall nutritional balance rather than produce targeted cognitive effects.
Strawberry Extract
Plant extracts like strawberry extract are often included for their naturally occurring phytonutrients and antioxidant compounds. Ingredient research into berries frequently focuses on how antioxidants may help protect cells from oxidative stress, a process that is widely studied in relation to aging and general brain health.
Peppermint Extract
Peppermint extract is traditionally associated with digestive comfort and sensory alertness. Some ingredient-level studies explore peppermint’s aromatic and phytochemical properties in relation to mental alertness and perceived clarity, although effects can be subjective and vary between individuals.
Important Context for Readers
While each of these ingredients has been studied individually in different contexts, it’s important to emphasize that ingredient research does not automatically translate to product-specific outcomes. The way ingredients interact within a proprietary blend, individual biology, dosage, and consistency of use all influence how a supplement may be experienced.
This is why responsible evaluation goes beyond ingredient lists alone. Understanding how the brand positions the overall formula, how it is intended to be used, and who it may or may not be appropriate for is just as important as reviewing the components themselves.
Read More: Gut-Brain Probiotic Supplement for Digestive Comfort, Mental Clarity, and Long-Term Wellness
How Synaptigen Is Designed to Be Used
According to the company, Synaptigen is intended to be used as a once-daily cognitive support supplement, incorporated into a consistent wellness routine rather than taken on an as-needed basis.
Daily Use Format
Synaptigen comes in a melt-in-the-mouth tablet, which the brand states can either be allowed to dissolve slowly or gently chewed. This delivery format is positioned as a convenience feature, particularly for individuals who prefer not to swallow traditional capsules.
Per the official website, the recommended usage is:
The company does not promote Synaptigen as a stimulant or quick-acting cognitive enhancer. Instead, it is framed as a supplement designed to support ongoing cognitive maintenance over time when used regularly.
Setting Realistic Expectations
One of the most important considerations with any dietary supplement is understanding what it is — and what it is not.
Synaptigen is not positioned as a medication, treatment, or therapy for cognitive conditions. The brand does not state that it diagnoses, treats, cures, or prevents any disease. Rather, it is presented as a nutritional option for adults who want to be proactive about supporting memory, focus, and mental clarity as part of a broader lifestyle approach.
As with most supplements, individual experiences may vary based on factors such as:
For this reason, the company emphasizes ongoing use rather than immediate or dramatic effects. Readers evaluating Synaptigen may want to think in terms of gradual support and maintenance, not instant changes.
Who This Usage Style May Appeal To
The simplicity of a once-daily tablet may be appealing to people who:
At the same time, individuals seeking rapid or noticeable cognitive effects in the short term may find that a daily support supplement does not align with their expectations.
Who Synaptigen May Be Right For
Choosing a cognitive support supplement is a personal decision, and no single product is an ideal fit for everyone. Rather than relying on testimonials or generalized claims, a self-assessment approach can help readers decide whether Synaptigen aligns with their needs and expectations.
Synaptigen May Align Well With People Who:
Other Options May Be Preferable For People Who:
Questions to Ask Yourself Before Deciding
Taking the time to answer these questions honestly can help clarify whether Synaptigen fits your expectations — or whether another approach might be more appropriate.
Synaptigen Pricing, Bundles, and What the Company Offers
Pricing transparency is an important part of evaluating any dietary supplement, especially in high-YMYL categories like cognitive health. All pricing and bundle information below is attributed to the company’s official website and reflects how Synaptigen is presented to consumers at the time of publication.
Available Purchase Options
According to the company, Synaptigen is sold in multi-bottle packages, with pricing structured to encourage longer-term use rather than single short trials. The brand states that the following options are typically available:
The company emphasizes that pricing is per bottle, and total order cost depends on the bundle selected at checkout. Readers are encouraged to review current pricing directly on the official website, as promotions and availability may change.
For readers who want to verify current bundle options or see what is currently available, Synaptigen can be found through the company’s official checkout page.
Bonuses and Shipping
Per the official website, larger bundle purchases may include digital bonus materials at no additional charge. These bonuses are informational guides focused on topics such as sleep habits, learning strategies, and memory techniques. The company presents these as educational resources rather than medical programs.
The brand also states that:
Shipping timelines and fees vary by location and are displayed during checkout.
Refund Policy Overview
According to the company, Synaptigen purchases are covered by a 180-day refund policy. The brand states that customers who are not satisfied may request a refund within this period by returning their order in accordance with the company’s published refund instructions.
As with any purchase, readers are encouraged to review the full refund and return policy directly on the official website to understand all requirements and conditions before ordering.
Pricing Disclaimer: All prices and offers were accurate at the time of writing (December 2025) and are subject to change at the company’s discretion.
Included Bonus Materials: What the Company Says Is Offered
In addition to the supplement itself, the company states that certain Synaptigen bundle options may include digital educational materials provided at no additional charge. These bonuses are presented as general informational guides rather than medical or therapeutic programs.
Bonus #1: Deep Sleep Blueprint
According to the company, this digital guide focuses on sleep-related habits and routines intended to support better rest. The material is described as covering topics such as:
This guide is positioned as educational content, not as a treatment for sleep disorders or medical conditions.
Bonus #2: Sharp Mind in 7 Days
The company describes this bonus as an informational resource that explores learning techniques and mental habits. Topics are said to include:
Despite the title, this guide is not presented as a guarantee of results within a specific timeframe. Individual experiences with educational strategies can vary widely.
Bonus #3: 10 Proven Ways to Learn Faster and Boost Memory
Per the official website, this bonus focuses on learning and memory techniques commonly discussed in cognitive psychology and educational research. The material is described as highlighting:
As with the other bonuses, this guide is informational in nature and does not replace professional educational or medical advice.
Important Context About Bonuses
It’s important for readers to understand that:
While some readers may find these materials helpful as part of a broader learning or wellness routine, they should not be interpreted as diagnostic, therapeutic, or outcome-based tools.
Frequently Asked Questions About Synaptigen
How does Synaptigen work, according to the company?
According to the company, Synaptigen is designed as a daily dietary supplement that supports memory, focus, and mental clarity through a combination of probiotics, prebiotics, and plant-derived nutrients. The brand frames its approach around supporting internal systems that are involved in normal brain function rather than providing stimulation or acting as a treatment for any condition.
Any references to how the product is “designed to work” reflect the company’s intended formulation philosophy and should not be interpreted as guaranteed outcomes.
Is Synaptigen a medication or medical treatment?
No. Synaptigen is marketed as a dietary supplement, not a medication. The company does not position it as a treatment, therapy, or cure for any disease or medical condition. Individuals with health concerns related to cognition should consult a qualified healthcare professional before using any supplement.
How do I take Synaptigen?
Per the official website, Synaptigen is taken once per day in the form of a melt-in-the-mouth tablet. The tablet can be allowed to dissolve slowly or gently chewed. Consistent daily use is emphasized by the company as part of a long-term wellness routine.
How long does it take to notice changes?
The company does not provide a specific timeline for when individuals may notice changes. As with most dietary supplements, individual experiences can vary based on factors such as age, diet, lifestyle, and consistency of use. Readers are encouraged to approach Synaptigen with realistic expectations and to avoid assuming immediate effects.
Does Synaptigen contain stimulants?
According to the company, Synaptigen does not contain added stimulants. This may be relevant for individuals who prefer cognitive support options that do not rely on caffeine or similar compounds.
Is Synaptigen a subscription or recurring charge?
The company states that Synaptigen is offered as a one-time purchase, not an automatic subscription. Customers are encouraged to review checkout details carefully to confirm current purchase terms before completing an order.
What is the refund policy?
According to the company, Synaptigen purchases are covered by a 180-day refund policy, subject to the brand’s published return requirements. Readers should review the full refund policy on the official website to understand eligibility, timelines, and return procedures.
Where can I purchase Synaptigen?
Synaptigen is sold directly through the company’s official website. For those who want to review current offers or verify availability, the product can be accessed through the official Synaptigen ordering page.
Final Verdict: A Measured Look at Synaptigen
Synaptigen is positioned by its manufacturer as a daily cognitive support supplement intended for adults who want to take a proactive, nutrition-based approach to maintaining memory, focus, and mental clarity over time.
Rather than emphasizing stimulation or rapid effects, the company frames Synaptigen around long-term support and consistency, using a blend of probiotics, prebiotics, and plant-derived ingredients. This approach may appeal to individuals who are interested in the broader concept of gut–brain balance and who prefer supplements that fit into everyday wellness routines without added stimulants.
At the same time, it’s important to recognize the limitations that come with any dietary supplement. While individual ingredients included in Synaptigen have been studied in various contexts, the product itself has not been clinically evaluated as a finished formulation, and individual experiences can vary significantly. Synaptigen is not intended to diagnose, treat, cure, or prevent disease, and it should not be viewed as a substitute for medical care.
From a practical standpoint, the once-daily tablet format, non-stimulant positioning, and availability of longer-term bundle options may be appealing for certain users. Others — particularly those seeking immediate cognitive changes or products backed by finished-product clinical trials — may find that alternative approaches are more appropriate.
Ultimately, Synaptigen appears best suited for readers who:
As with any wellness decision, reviewing the full product details, policies, and ingredient information directly with the company — and consulting a healthcare professional when appropriate — can help ensure that expectations align with reality.
For readers who wish to explore current offers or review the company’s full disclosures, Synaptigen is available through the official website.
Contact Information (Company-Provided)
For product-specific questions, shipping inquiries, or refund requests, the company lists the following contact details:
Important Disclaimers and Disclosures
XRP is back in focus as mounting selling pressure pushes key momentum indicators into oversold territory, raising fresh debate over whether the market is nearing a short-term turning point.
XRP is drawing renewed attention from market participants as market structure and momentum metrics indicate the asset may be approaching a critical inflection point. After a steady decline over the past week, XRP is trading near $1.88, reflecting a 1.41% daily drop, while maintaining strong liquidity with more than $3.5 billion in 24-hour trading volume.
Crypto analyst Good Evening Crypto (@AbsGMCrypto) highlighted the oversold condition in a recent post, stating, “BREAKING: $XRP WEEKLY RSI HITS 33! Could see a large bounce from these ranges…”
XRP weekly RSI hits 33, signaling a potential bounce from oversold levels. Source: @AbsGMCrypto via X
According to commonly observed TradingView market data trends, similar weekly RSI levels have marked key turning points during prior cycles. During the 2017–2018 bull run, XRP advanced from approximately $0.20 to $3.40 after extended periods of oversold conditions. A comparable setup appeared in November 2024, when subdued momentum preceded a 580% rally that peaked in early 2025.
While historical patterns can provide context, they do not guarantee similar outcomes. Nevertheless, the recurrence of these signals has kept XRP under close observation among technically focused traders.
Short-term market behavior indicates XRP is attempting to stabilize above a well-defined technical area. The asset recently dipped into the $1.83–$1.87 range, a zone that has attracted consistent buying interest in recent sessions.

XRP shows a bullish reaction from key support, with momentum favoring an upside move toward near-term technical targets. Source: ExpertTraderASK on TradingView
TradingView analyst ExpertTraderASK described the setup as constructive on lower timeframes: “Price is showing a strong bullish reaction from a critical support zone; momentum favors the upside on the 15M timeframe.”
The analyst outlined near-term technical targets at $1.8830, $1.8990, and $1.9230, while emphasizing the importance of disciplined position sizing and stop-loss management. This intraday optimism contrasts with higher-timeframe structures that continue to point toward consolidation rather than a confirmed trend reversal.
From a broader perspective, crypto strategist EGRAG CRYPTO (@egragcrypto) shared a long-term weekly chart showing XRP trading within a multi-year descending triangle that has been developing since the 2018 peak. The descending resistance trendline, referred to as the “Line of Hestia,” continues to limit upside attempts.

XRP tests key support inside a long-term descending triangle, capped by the “Line of Hestia” resistance. Source: @egragcrypto via X
The chart suggests XRP is once again testing triangle support, an area where historical probability models often favor upward resolution. According to technical pattern studies, descending triangles resolve to the upside approximately 70% of the time, although the projected resolution window in this case extends as far as 2027, drawing skepticism from parts of the trading community.
This longer-term structure highlights the contrast between short-term momentum signals and broader cyclical consolidation, underscoring the complexity of XRP’s current market position.
XRP currently sits at a pivotal juncture, where short-term technical signals suggest potential stabilization, yet broader market structure continues to warrant caution. Holding the $1.83–$1.90 support zone remains critical, as sustained defense could open the door to a modest recovery, while a breakdown may invite further downside pressure.

XRP was trading at around 1.87, down 1.41% in the last 24 hours at press time. Source: XRP price via Brave New Coin
As momentum indicators, volume trends, and overall market sentiment evolve, traders are advised to remain patient and disciplined. While oversold conditions may offer tactical opportunities, unresolved risks underscore the importance of prudent risk management. These insights reflect prevailing market dynamics and do not constitute investment advice.
Gold prices are consolidating near record territory on Thursday, December 18, 2025, as traders juggle two powerful forces pulling in opposite directions: a still-resilient U.S. dollar and the renewed case for lower U.S. interest rates after a cooler-than-expected inflation reading.
In early trading, spot gold was around the $4,330-per-ounce area, modestly lower on the day after a strong prior-session move, while U.S. gold futures were also fractionally softer. [1]
But the bigger story for bullion today is macro: U.S. CPI cooled to 2.7% year-on-year in November, under the 3.1% consensus forecast in a Reuters poll—fuel for the “rates can fall further” narrative that has helped propel gold’s historic 2025 rally. [2]
Gold’s headline price action on Dec. 18 is best described as steady-to-soft, not a collapse—more like a market taking a breath near all-time highs after an extraordinary year.
A later read from Reuters showed spot gold down 0.4% to $4,323.57/oz (as of 12:10 GMT) with U.S. futures down 0.4% to $4,356.10, underscoring the day’s “small dip” tone rather than any trend break. [5]
Investing.com, meanwhile, cited spot gold at $4,336.54/oz at 09:15 ET (14:15 GMT), with February gold futures at $4,370.30/oz—again consistent with a narrow, high-level range. [6]
One of the simplest relationships in commodities is also one of the most reliable: a stronger dollar can pressure gold, because it makes dollar-priced bullion more expensive for overseas buyers.
Reuters noted the dollar index edged up after touching a near one-week high the prior session, a factor weighing on gold as traders positioned cautiously ahead of inflation data. [7]
But CPI shifted the balance.
After the data, Reuters reported the dollar index weakened (down 0.12% to 98.25 in that update) and Treasury yields fell, an environment that typically improves gold’s appeal. [8]
The headline macro catalyst today is the CPI undershoot:
There’s an important nuance: Reuters reported the CPI release was affected by a 43-day government shutdown, and the Bureau of Labor Statistics did not publish month-to-month CPI changes because October data collection was disrupted. That “data quality caveat” is a big reason why markets may be hesitant to chase gold aggressively higher on a single print. [10]
Even so, softer inflation tends to push investors toward the view that real yields can fall, which is a structural positive for non-yielding assets like gold. [11]
Gold’s 2025 surge has been tightly linked to the belief that the U.S. is in, or nearing, a lower-rate regime. Today’s flow of Fed-related headlines reinforced that debate.
Reuters highlighted that:
For bullion investors, this mix matters because gold can react to two things at once:
Reuters’ broader gold-forecast reporting this week explicitly included worries about Fed independence among the factors analysts see supporting bullion into 2026. [15]
Dec. 18 isn’t only about the Fed. It’s also a heavyweight central-bank week globally, and those decisions feed into FX and bond-market moves that spill over into gold.
Investing.com reported:
That mix matters for gold in two ways:
Gold isn’t moving in isolation. On Dec. 18, Reuters and Investing.com both highlighted unusual strength across precious metals:
Why this matters for gold: when the whole complex runs together, positioning risk rises—profit-taking in one metal can spill into others, even if gold’s fundamentals remain bullish.
One of today’s most striking region-specific stories comes from Thailand, where policymakers are explicitly linking gold trading to currency-market stress.
Reuters reported the Thai central bank is urging the finance ministry to regulate gold trading after a surge in transactions helped push the baht higher, with the governor saying that on days of sharp baht strength, gold transactions can account for about half of the flows driving the move. [20]
For global gold readers, the takeaway is bigger than Thailand: it’s a real-time example of how active gold trading and cross-border flows can become macro-relevant, affecting currencies, policy debates, and potentially even local market access and liquidity.
Australia’s government-linked commodity outlook also underscored how gold’s high price level is reshaping the real economy.
Reuters reported Australia revised expected resource export earnings up 4% to A$383 billion for the current financial year, pointing to record gold prices as a key contributor. It also said gold is set to become Australia’s second most valuable resource export (after iron ore) in the 2025–26 financial year. [21]
Notably, that report included a forward-looking anchor: it said gold prices are likely to remain strong at around $4,000/oz over 2026 before falling in 2027 (in that outlook). [22]
That matters for the “forecast” question investors keep asking: even more cautious government-linked assumptions are now using $4,000 gold as a baseline for next year—a remarkable reset compared with the pre-2024 era.
A day before today’s CPI-driven headlines, Reuters published one of the most comprehensive roundups of the market’s 2026 gold forecasts—and the range is wide.
Key points from that Reuters analysis:
The same Reuters report laid out why strategists believe this cycle has different “supports” than older gold booms:
Even in a bullish framework, the risks are real:
Thursday’s price action fits a common late-cycle pattern in strong bull markets:
Investing.com explicitly described profit-taking after a sharp rally over the past week, while still pointing to “structural support” from central-bank buying and de-dollarisation themes. [33]
And Reuters captured the same cautious tone ahead of CPI, quoting UBS strategist Giovanni Staunovo on investors preferring not to head into the inflation report with open risk. [34]
Gold’s next decisive move is likely to come from a combination of policy confirmation and liquidity:
As of today’s 09:55 update on December 18, 2025, gold remains firmly parked near the $4,330/oz region, reflecting a market that is digesting softer U.S. inflation while still respecting short-term dollar strength and profit-taking near records. [39]
The most important shift in today’s news flow is not the day’s small price dip. It’s the macro narrative reset: with CPI at 2.7% YoY versus 3.1% expected, the case for further easing in 2026 looks stronger—exactly the environment where gold has historically done well. [40]
And with major banks now openly discussing $4,500 to $5,000 gold scenarios in 2026—alongside more conservative forecasts that still sit above $4,200—the metal enters year-end not as a fringe hedge, but as a core macro asset class that’s forcing governments, central banks, and investors to adapt. [41]
XAUUSD Gold Technical Analysis Levels Revealed
1. www.reuters.com, 2. www.reuters.com, 3. www.reuters.com, 4. www.reuters.com, 5. www.reuters.com, 6. ng.investing.com, 7. www.reuters.com, 8. www.reuters.com, 9. www.reuters.com, 10. www.reuters.com, 11. www.reuters.com, 12. www.reuters.com, 13. www.reuters.com, 14. www.reuters.com, 15. www.reuters.com, 16. ng.investing.com, 17. www.reuters.com, 18. www.reuters.com, 19. www.reuters.com, 20. www.reuters.com, 21. www.reuters.com, 22. www.reuters.com, 23. www.reuters.com, 24. www.reuters.com, 25. www.reuters.com, 26. www.reuters.com, 27. www.reuters.com, 28. www.reuters.com, 29. www.reuters.com, 30. www.reuters.com, 31. www.reuters.com, 32. www.reuters.com, 33. ng.investing.com, 34. www.reuters.com, 35. www.reuters.com, 36. www.reuters.com, 37. ng.investing.com, 38. www.reuters.com, 39. www.reuters.com, 40. www.reuters.com, 41. www.reuters.com
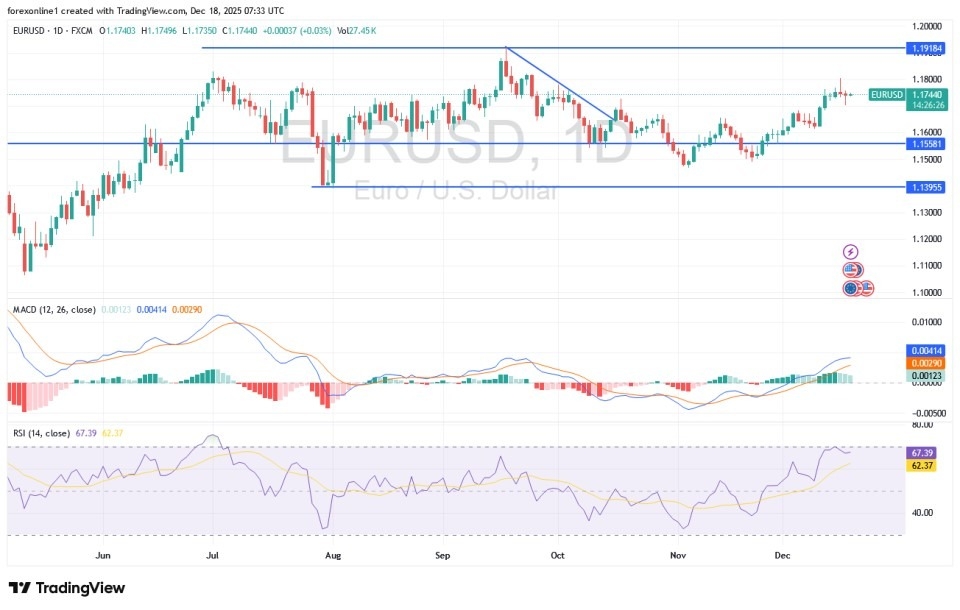
Amidst an upward technical correction, the EUR/USD pair jumped to its highest level in two months, briefly testing the psychological resistance level of 1.1800. This followed a widely expected US Federal Reserve interest rate cut, which simultaneously revealed deep internal divisions within the bank. Markets interpreted the split vote and Jerome Powell’s data-dependent remarks as bearish for the US Dollar against other major currencies, providing support for the Euro. Focus is now shifting to the Fed’s path for 2026 and the uncertainty surrounding the selection of Powell’s successor.
For his part, US Federal Reserve Chairman Jerome Powell emphasized the difficulty of formulating monetary policy in the face of high inflation and weak job prospects. He insisted that monetary policy would be data-driven. According to the latest updates, the median forecast points to a further rate cut in 2026, although there is considerable variation in expectations.

Overall, Fed policy will remain a core factor in 2026, especially as Powell’s term ends in May, adding to the climate of uncertainty.
According to reliable trading platforms and based on the daily chart, technical indicators support an upward technical correction for the EUR/USD pair. As previously mentioned, breaking the psychological resistance level of 1.1800 will be crucial for strengthening the bulls’ control and preparing for significant upward breakouts, followed by the psychological peak of 1.2000, the most prominent target for the EUR/USD in the new year. Currently, the 14-day Relative Strength Index (RSI) is near the overbought level of 70, and unless it gains new positive momentum, expect profit-taking. Simultaneously, the MACD indicator has crossed into overbought territory.
The Bearish Scenario: For the pair to return to a downward trajectory on the daily timeframe, it would require a retreat back toward the 1.1500 support level. The EUR/USD pair will be influenced today by the European Central Bank’s policy announcement, with expectations that interest rates will remain unchanged. The bank’s announcement will be at 3:15 PM Egypt time, followed by a statement from ECB President Lagarde at 3:45 PM Egypt time. On the US side, the focus will be on the weekly US jobless claims report and the Philadelphia Fed Manufacturing Index, both due at 3:30 PM Egypt time.
Be cautious. If the EUR/USD fails to break above the 1.1800 level, profit-taking may begin. Never take unnecessary risks.
According to forex trading experts, Scotiabank predicts that the EUR/USD exchange rate will rise to the 1.22 resistance level by the end of 2026, with a further increase to 1.24 the following year. In the same vein, Société Générale sees the possibility of the euro/dollar exchange rate rising to the psychological resistance level of 1.20 by early 2026, but expects a gradual decline to 1.14 by the end of 2026.
Mizuho also predicted that the EUR/USD exchange rate would reach the resistance level of 1.22 by the end of 2026, noting that “Federal Reserve cuts, German fiscal spending, and increased hedging against US dollar exchange rate risks will lead to a repeat of the 2017 scenario in 2025 and 2026, but it is difficult to predict beyond that.”
Ready to trade our Forex daily forecast? We’ve shortlisted the top forex brokers in the industry for you.
When a bad mood strikes—or when you’ve been in a slump for a few days—it’s easy to fall back on less-than-healthy habits, whether that’s scrolling, reaching for indulgent snacks, or being sassy towards loved ones. However, there are plenty of healthier activities, foods, and beverages that can help turn your bad mood on its head—and one of them is simply brewing a warm cup of tea. “The act of making tea can be as beneficial as the tea itself,” says Rachelle Robinett, registered herbalist and author of Naturally, The Herbalist’s Guide to Health and Transformation. That said, the type of tea in your mug can have positive impacts on your mood, too.
While there are several mood-boosting teas to choose from, some stand out above the rest for their accessibility and research backing. Here we’ll tease out one of the best (and a few runners-up), so the next time you’re feeling grumpy, you can reach for a warm cup of tea to elevate your mood.
But of all the tea varieties, which is the best for mood-boosting? While several will help you turn that frown upside down, green tea ranks high on the list. “Green tea is a great option to support your brain health and may even help slow down aging of the brain thanks to the stress-reducing impact of the amino acids l-theanine and arginine,” says Maxine Yeung, RD CPT NBHWC, dietitian and founder of The Wellness Whisk, LLC. “It’s loaded with antioxidant catechins, particularly EGCG (epigallocatechin gallate), which help reduce inflammation, have neuroprotective properties, and are linked with a lower risk for Alzheimer’s and Parkinson’s diseases. Green tea may also have a positive impact on gut microbiota.”
Outside of boosting brain and gut health—inadvertently supporting mood—the high concentration of EGCG in green tea also offers research-backed mood benefits. “Polyphenols, like EGCG, help to raise your mood by influencing mood-related neurotransmitters, reducing inflammation, regulating the stress response, and supporting the gut-brain axis,” Yeung adds.
The amino acid l-theanine in this popular tea has also been shown to reduce symptoms of anxiety and promote feelings of relaxation. “Additionally, some clinical trials have found that bioactive compounds in green tea may improve mood by lowering inflammation and improving sleep quality,” says registered dietitian Kerry Hackworth, MS, RD, LDN. Research has even found the aroma of green tea alone to elicit positive emotions.
However, green tea does contain caffeine, which—while providing an energy boost, potentially benefiting mood in some—isn’t ideal for those sensitive to the stimulant or those needing support during the later hours of the day or night. You can find decaffeinated green tea, but the decaffeination process may reduce its mood-boosting polyphenol content. This is where an herbal tea could be a better choice.
Just one delicious, mood-boosting option is mint—or peppermint—tea. “Mint or peppermint is a caffeine-free and calming bedtime beverage,” Hackworth says. “Mint tea and honey makes an excellent sick-day pick-me-up for me personally.”
Yeung agrees, adding, “I love reaching for mint tea when I need a little pick-me-up. The menthol aroma instantly helps wake me up, clear my mind, and boost my energy.” Research backs this, showing the brain health, relaxation, and anxiety-reduction benefits of mint tea. Robinett and these RDs also mention chamomile and lavender as equally delicious and effective mood-supportive alternatives.
So the next time you’re feeling anxious, down, or irritable, try brewing any one of these teas for a natural and comforting mood boost! While green, mint, chamomile, and lavender are all excellent options, choosing a variety you personally love can boost your mood simply because you enjoy the taste and sensory experience. “It’s worth taking a moment to consider what teas are most enjoyable for us personally,” Robinett suggests.
There are countless varieties of tea—which generally fit into two categories: tea and tisane (better known as herbal tea). “Tea is, as we know, a water-based infusion (or extract) wherein plant-based benefits seep out of herbs and into our cup, and we toss the spent remnants and sip the benefits,” Robinett says. “Technically, though, all tea isn’t tea—only infusions made from the tea plant, Camellia sinensis, are tea; everything else is a tisane.” Common Camellia sinensis teas include black, green, white, red, oolong, and yellow teas—the most popular teas nationwide. Tisane, or herbal tea, is a more unfamiliar territory for many of us, and there are countless herbs that can be brewed into tea.
Regardless of which variety you gravitate towards, tea’s far-reaching health benefits can usually be traced back to a specific type of nutrient. “Camellia sinensis and herbal teas are rich in antioxidants, particularly polyphenols and flavonoids, which promote multiple health benefits from heart health to metabolic health to brain health,” Yeung says. In fact, polyphenols in tea may help reduce the risk of cardiovascular disease, lower cholesterol and triglyceride levels, improve blood sugar control, and lower cancer risk.
These antioxidants may also boost mood and brain health, depending on the variety. Other elements of the tea-drinking experience, like boosting fluid intake, also bode well for mental health. “Tea is also a good way to hydrate, providing minimal calories in exchange for fluid and healthy compounds,” Hackworth adds. Proper hydration benefits nearly every body system—including the brain and gut—both of which have a significant impact on our mood.
Plus, the act of drinking tea alone can lift your spirits. “Simply sipping a warm cup of tea can feel incredibly calming. It’s a soothing ritual that fits perfectly into an evening wind-down routine, or even works as a quick stress relief strategy whenever you need to pause and reset,” Yeung offers.
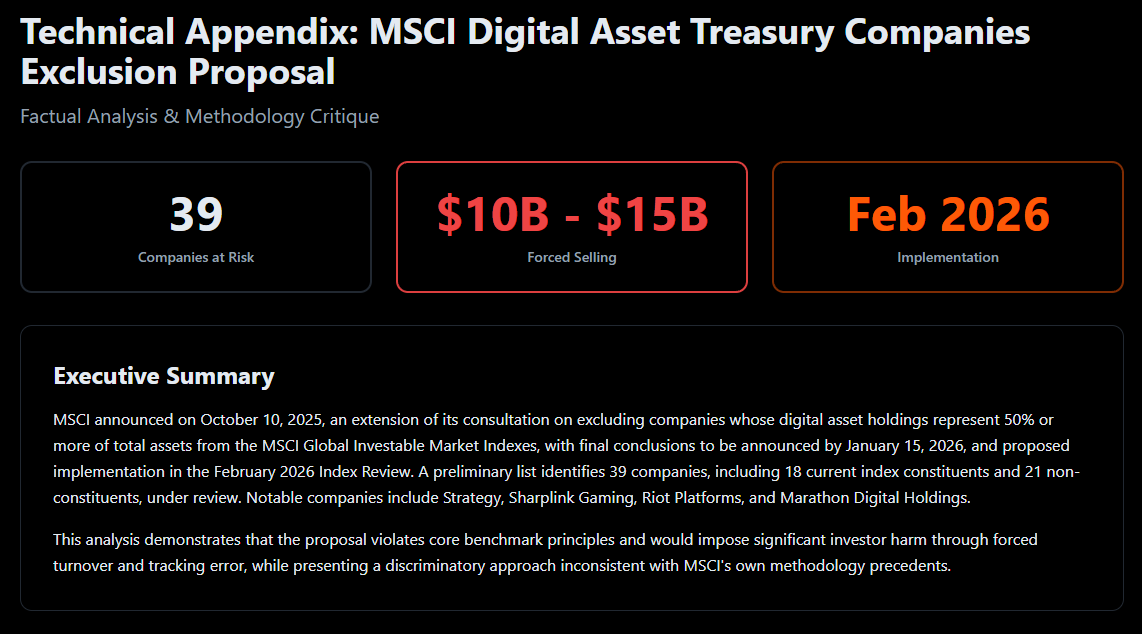
Crypto treasury companies may have to sell off $15B in cryptocurrencies if the MSCI excludes them from its index.
While the list includes 39 companies, Strategy alone could lose $2.8B.
As the “battle with the MSCI” continues, altcoins entered into a deeper correction. With the Solana price prediction entering bear territory, many traders are switching to presales to avoid some of the volatility.
DeepSnitch AI capitalized on these rotations, surging past $830K as retail investors recognized the project’s long-term potential.
Along with the entry of $0.02846 and AI agent deployment, DeepSnitch AI announced exclusive presale codes that could unlock bonuses as high as 100%.
According to the BitcoinForCorporations group, crypto treasury companies could be forced to sell off massive amounts of cryptocurrencies if they get excluded from MSCI indexes.
The group projects that the outflows could reach a figure of $15B based on the list of 39 companies that will fall under the exclusion rule.
This could put significant pressure on the market, as companies like Strategy alone could see over $2.8B in outflows.
Objections against the proposal are growing, though, as multiple large companies voice their displeasure, which, as of recently, includes Nasdaq-listed Strive.
As retail traders rally against MSCI, they are also looking at Solana price prediction as a metric of potential market recovery. Yet, as short-term prospects are uncertain for most majors, early-stage presales could provide a viable (and more rewarding) alternative.
DeepSnitch AI raised $830K by December 17, which is much more impressive when you consider that the rest of the market is in the phase of heavy correction.
The lead contributor to bullish performance is the utility itself. DeepSnitch AI is building a sophisticated analytics and prediction suite that leverages five AI agents to predict not only FUD storms, but also the tiniest sentiment shifts, among other things.
DeepSnitch AI is past the idea stage, as the team has announced that the first three AI agents are fully operational and will be made available to early investors soon.
The price of $0.02846 itself also contributes to the 100x narrative suggested by the community. When you put all the fundamentals together, the upside potential is quite high, possibly dwarfing the returns you can achieve with majors (even in the case the Solana price prediction sees a new ATH).
One of the key reasons why the DeepSnitch AI presale snowballed recently is also the exclusive codes valid until January 1 that unlock bonuses between 50 and 100% on large investments.
According to CoinMarketCap, Solana traded in the $122 area on December 17, indicating that the overall Solana investor sentiment is bearish.
The 20-day EMA of $133 in a heavy downslope and RSI declining below 39 are further proof of SOL momentum outlook being dominated by bears.
Analysts warn that a dip below the current support line will extend the downward move, making a plunge to $110 followed by closing around $95 likely.
However, once the Solana market indicators start favoring buyers, SOL will likely push beyond the 20-day EMA and pump to $172.
On December 17, BNB declined to the $830 level, according to CoinMarketCap.
While it’s significantly more bullish than the Solana price prediction, BNB also failed to regain its 20-day EMA. Thus, analysts believe that the test of the $791 is the next logical move, and if this line breaks, a decline toward $730 is a possibility.
Alternatively, buyers will likely push toward the 20-day EMA of $883 with a successful close, opening the door to a rally toward $1K.
The recent Solana price prediction is a sign of a wider correction. Thus, it’s much safer to dip your toes into brand-new projects, at least until a bullish reversal finally happens.
Raising $830K (and counting), DeepSnitch AI is an outlier in a slow market, which significantly boosts its chances of success and strengthens the popular 100x DSNT narrative.
To take full advantage of the presale, the latest discount codes provide a bonus of 50% for investments above $2K (DSNTVIP50) or 100% for investments above $5K (DSNTVIP100), which is an incredible value for a project already highlighted for its upside potential.
The codes are valid until January 1, so reserve your spot in the DeepSnitch AI presale ASAP. If you’re looking for community updates, feel free to go through X and Telegram.
With SOL trading below $130, the current Solana price prediction remains bearish. If support breaks, analysts warn of a drop toward $110 or even $95 before a potential recovery.
DeepSnitch AI raised over $830K despite market volatility, driven by its AI-powered trading and analytics suite, early deployment of live AI agents, and strong 100x upside projections.
Investors can apply DSNTVIP50 to receive a 50% bonus on investments above $2K, or DSNTVIP100 for a 100% bonus on purchases over $5K. Both bonuses expire on January 1.
Disclaimer: This is a Press Release provided by a third party who is responsible for the content. Please conduct your own research before taking any action based on the content.







:max_bytes(150000):strip_icc()/GettyImages-1394092680-7d2f66d5438e4ff99100526a1bf7c7f0.jpg "The #1 Tea for Boosting Your Mood, According to a Dietitian")