The main category of All News Articles.
You can use the search box below to find what you need.
[wd_asp id=1]
The main category of All News Articles.
You can use the search box below to find what you need.
[wd_asp id=1]
EUR/USD is currently transitioning from impulsive expansion into balance, consolidating above the 1.1728 multi-week high. This behavior reflects acceptance at higher prices, rather than exhaustion or trend failure.
After reclaiming a key structural level, the market has paused to allow two-sided trade — a natural and healthy process in trending environments. Importantly, price has not collapsed back below prior resistance, nor has it shown aggressive distribution. Instead, EUR/USD is oscillating within a defined range, signaling re-pricing rather than rejection.
From a macro perspective, this consolidation is occurring against a backdrop of persistent USD softness. The Federal Reserve’s shift toward rate cuts and a more data-dependent stance has reduced the dollar’s yield advantage, while expectations for aggressive ECB easing remain restrained. This narrowing policy divergence continues to favor EUR/USD on a medium-term basis.
As a result, the current price action should be viewed as digesting gains, not undoing them.

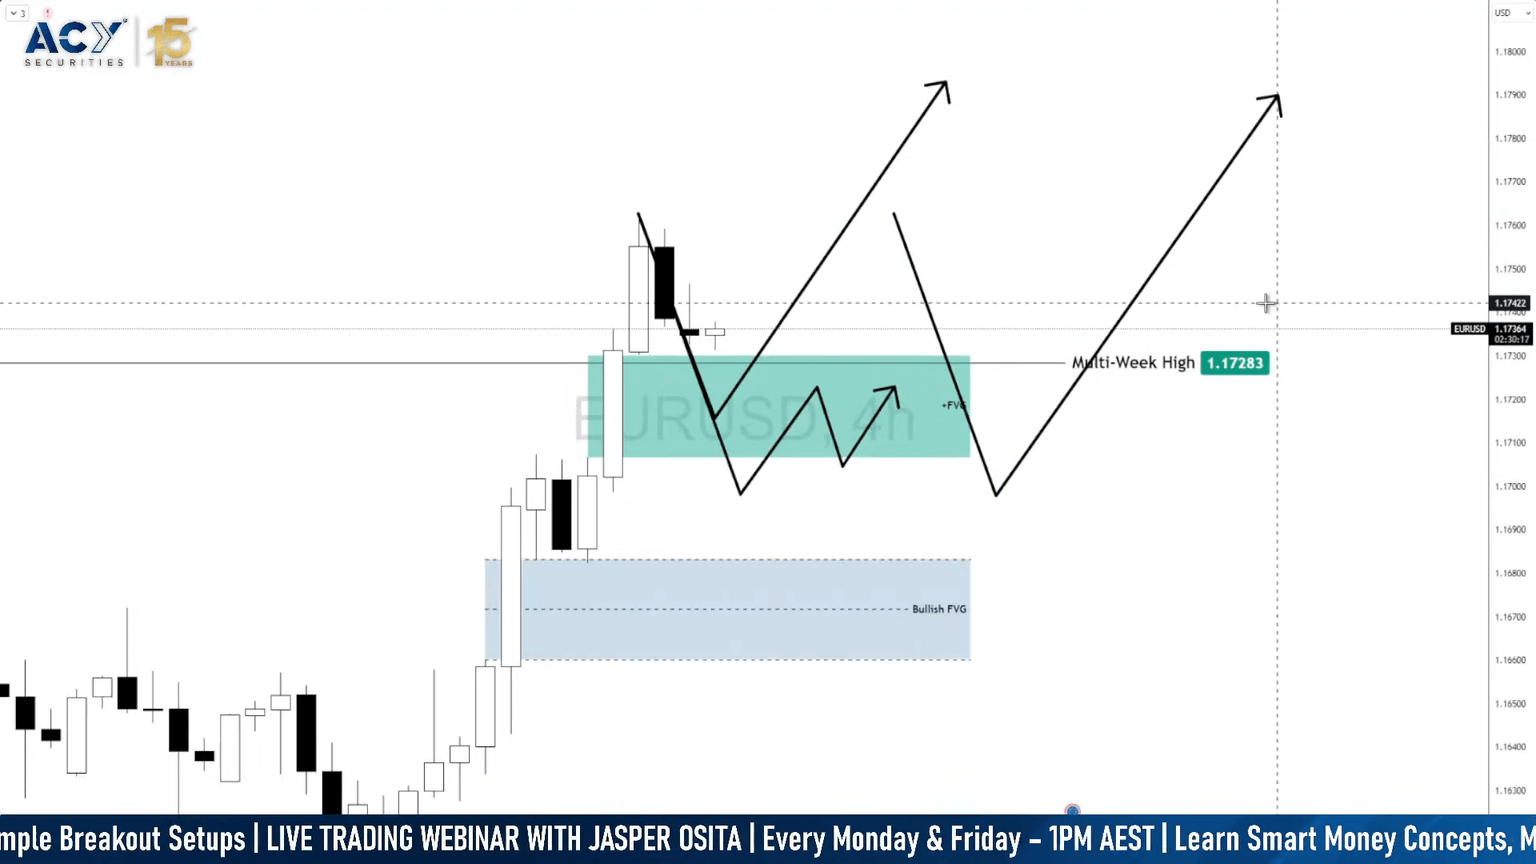
The prior EUR/USD forecast did not call for immediate continuation higher. Instead, it emphasized that acceptance above the multi-week high would be more important than chasing momentum.
Specifically, the expectation was for:
That scenario has materialized cleanly.

Following the breakout, EUR/USD pulled back into the highlighted re-pricing zone, held above the multi-week high, and formed higher lows rather than accelerating lower. Sellers failed to force acceptance back below prior resistance, while buyers consistently absorbed downside pressure.
This confirms that the breakout was structural, not false. The current consolidation reflects controlled digestion, aligning with the original expectation that the market would pause before determining its next expansion leg.
In short, the market followed process, not prediction — rewarding patience and structural alignment rather than aggressive positioning.
EUR/USD is now trading inside a defined range, with both buyers and sellers actively participating. In this environment, the most important reference is no longer the highs or lows — but equilibrium, or the middle of the range.
Equilibrium represents fair value. How price behaves around this level reveals intent.
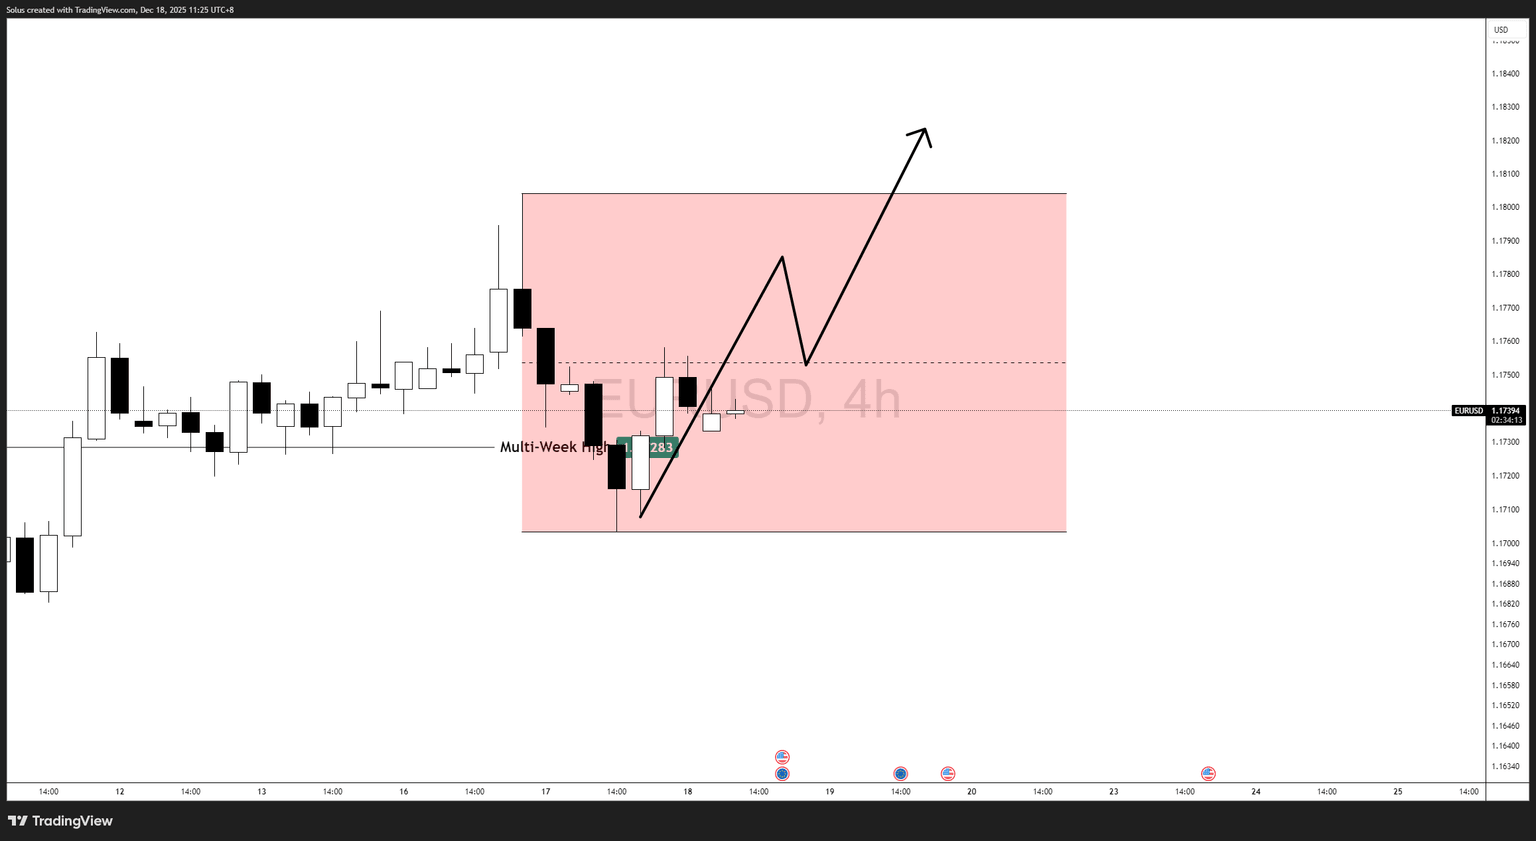
The bullish scenario re-engages if EUR/USD breaks above the equilibrium level and holds above it.
Acceptance above the midpoint of the range signals that buyers are willing to transact at premium prices, not just defend the lows. In strong trends, equilibrium often acts as a launchpad, not resistance.
If price reclaims equilibrium and stays above it:
Bullish expectation:
Rotation toward the range high, followed by a potential continuation toward new multi-week highs if momentum builds.
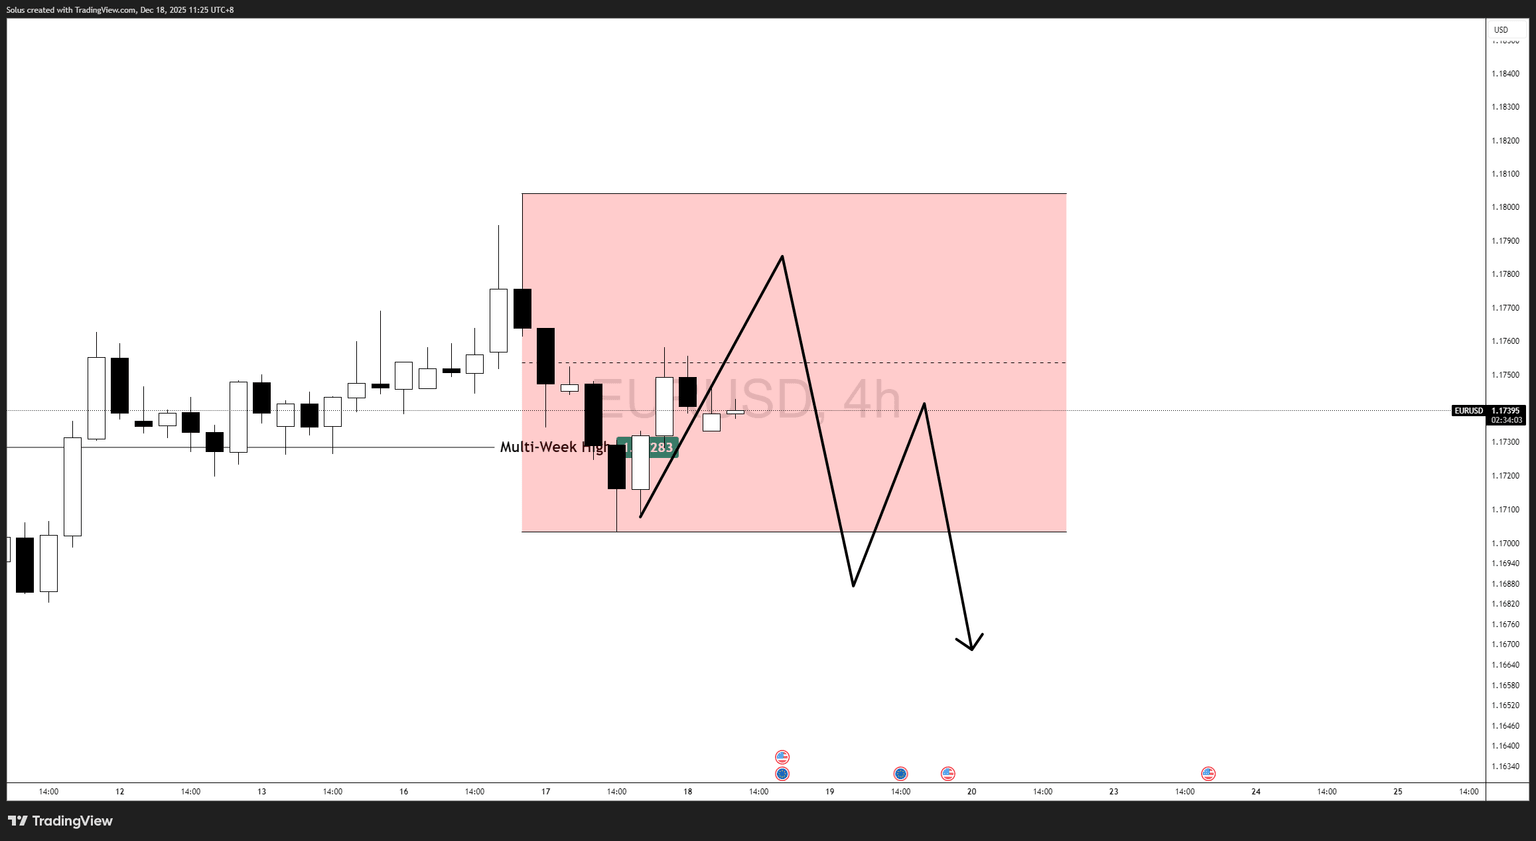
The bearish scenario develops if EUR/USD fails to reclaim equilibrium and consistently trades below the midpoint of the range.
In this case, equilibrium acts as resistance, suggesting sellers control fair value. This would likely lead to:
However, it is critical to distinguish correction from reversal. Even a sustained move below equilibrium would still be considered rebalancing, unless broader daily structure breaks decisively.
EUR/USD is not weakening — it is pausing with structure intact.
The market is currently balanced, and equilibrium is the line that separates continuation from deeper correction. Acceptance above it favors renewed strength, while failure keeps price rotational.
Until that decision is made, patience remains the edge.
Follow all the action from the second day of the NRMA Insurance Men’s Ashes third Test in Adelaide
Full scorecard and wicket replays here
Third Test session times
First Session: 10am – 12noon (10.30am – 12.30pm AEDT; 11.30pm – 1.30am GMT)
Second Session: 12.40pm – 2.40pm (1.10pm – 3.10pm AEDT; 2.10am – 4.10am GMT)
Third Session: 3pm – 5pm (3.30pm – 5.30pm AEDT; 4.30am – 6.30am GMT)
*An extra 30 minutes is available to complete daily overs
First Test: Australia won by eight wickets
Second Test: Australia won by eight wickets
Third Test: December 17-21: Adelaide Oval, 10:30am AEDT
Fourth Test: December 26-30: MCG, Melbourne, 10:30am AEDT
Fifth Test: January 4-8: SCG, Sydney, 10:30am AEDT
Australia squad (second Test only): Steve Smith (c), Scott Boland, Alex Carey, Brendan Doggett, Cameron Green, Travis Head, Josh Inglis, Marnus Labuschagne, Nathan Lyon, Michael Neser, Mitchell Starc, Jake Weatherald, Beau Webster
England squad: Ben Stokes (c), Harry Brook (vc), Jofra Archer, Gus Atkinson, Shoaib Bashir, Jacob Bethell, Brydon Carse, Zak Crawley, Ben Duckett, Will Jacks, Ollie Pope, Matthew Potts, Joe Root, Jamie Smith (wk), Josh Tongue, Mark Wood
Dec. 17, 2025 — Solana’s U.S. dollar pair (SOL-USD) is trading around the $123 area as the broader crypto market remains cautious and risk-sensitive, while Solana-specific headlines range from a major network stress test (a large DDoS attack) to fresh security research around post-quantum signatures. [1]
Multiple pricing feeds show SOL down roughly ~3.6% to ~3.8% over the past 24 hours, with heavy turnover and an unusually wide intraday range — a setup that has kept short-term “breakout or breakdown” talk front and center in today’s technical commentary. [2]
At the time of writing, widely followed trackers place Solana around $123:
Context: CoinGecko also shows SOL down about ~11% over the past 7 days, highlighting that the latest slide is part of a broader December pullback rather than a single-candle move. [9]
Today’s SOL price action is being pulled by two forces at once: (1) a risk-off crypto tape and (2) Solana-specific headlines that are, paradoxically, long-term constructive even as price chops lower in the short term.
Reuters reports crypto investors have become more cautious after the market’s downturn from October highs, with greater emphasis on hedged/active strategies and risk management tools. That kind of positioning shift can reduce dip-buying urgency in large-cap alts like SOL. [10]
(Separate market coverage also points to crypto behaving more like a risk asset than a gold-like hedge in this phase, which can keep pressure on majors when sentiment turns defensive.) [11]
A widely discussed Solana story on Dec. 17 is the network’s ability to remain operational through a massive DDoS attack. Unchained reports the attack lasted over a week and peaked around 6 Tbps, yet the network appeared “unimpacted” and saw zero downtime or performance degradation in that account. [12]
Unchained also notes Solana co-founder Anatoly Yakovenko publicly framed the attack as “bullish” in the sense that an attacker was allegedly spending heavily to generate traffic without taking the chain down—adding to the narrative that Solana’s infrastructure resilience has improved. [13]
Why it matters for SOL-USD: In past cycles, Solana’s reliability has been a major investor talking point. Stories that emphasize resilience can strengthen long-term confidence, but they don’t always translate into immediate upside if the overall market is risk-off.
Another major Dec. 17 headline: Cointelegraph (via TradingView) reports the Solana Foundation partnered with Project Eleven for a quantum computing threat assessment and prototyped a Solana testnet using post-quantum digital signatures, claiming end-to-end “quantum-resistant transactions” can be practical and scalable. [14]
BeInCrypto similarly reports Solana deployed post-quantum signatures on a testnet as a proactive security measure amid growing industry focus on quantum readiness. [15]
Why it matters for the forecast: This is not a “next week” price catalyst in most models, but it supports a longer-term investment narrative: Solana positioning itself as infrastructure that can evolve with future security standards.
Although announced Dec. 16, Visa’s move is part of what traders are still digesting on Dec. 17 because it directly references Solana in a TradFi settlement context. Visa says initial U.S. banking participants Cross River Bank and Lead Bank have begun settling with Visa in USDC over the Solana blockchain, with broader availability planned through 2026. [16]
Why it matters for SOL-USD: Even when SOL token price doesn’t respond immediately, the “Solana as payments/settlement infrastructure” storyline is strengthened when a global network like Visa names Solana as a settlement rail in an official release.
Earlier this month, Reuters reported J.P. Morgan arranged a $50 million short-term debt deal for Galaxy Digital on Solana’s blockchain, with USDC used in the flow—another signal of institutional experimentation on Solana. [17]
Separately, State Street Investment Management and Galaxy Asset Management announced plans (Dec. 10) for the State Street Galaxy Onchain Liquidity Sweep Fund (SWEEP), anticipating ~$200 million seed from Ondo Finance and an early 2026 debut on Solana, using stablecoins (including PYUSD) for subscriptions and redemptions. [18]
Galaxy’s own research recap from Breakpoint week framed these types of announcements as evidence of ecosystem maturation and increasing institutional traction around the “internet capital markets” thesis. [19]
Today’s technical commentary is unusually aligned on one point: SOL is coiling, and the next big move likely depends on whether support breaks or holds.
Takeaway: Market structure is “compressed.” In practice, that often means traders watch for a decisive move below ~$120–$122 (bearish expansion) or a reclaim above ~$132 (bullish relief rally). [26]
No forecast is guaranteed—crypto is notoriously headline- and liquidity-driven—but today’s mix of price structure and news flow lends itself to scenario-based expectations.
Given the tight compression highlighted by multiple analysts, a common near-term path is continued sideways-to-choppy trade as long as SOL holds the widely watched support band. [27]
In this base case, traders often look for mean reversion toward the $130–$132 area (the first meaningful resistance cluster) rather than an immediate trend reversal. [28]
A bullish break typically requires SOL to:
If that happens, some technical roadmaps start pointing toward $135 and beyond (with higher resistance levels mentioned in certain write-ups), though follow-through will likely depend on whether the broader crypto market stabilizes. [30]
If SOL loses the $120–$122 support area decisively, analysts highlighting the compression pattern argue the move could accelerate, with $100 often cited as a psychological downside target from the current structure. [31]
This scenario becomes more plausible if macro-driven crypto weakness persists and risk appetite remains subdued. [32]
A number of widely circulated SOL price prediction pages updated around this period broadly cluster around “low $120s to low/mid $130s” for late December, but they vary meaningfully on timing and volatility assumptions.
Important nuance: These models can lag real-time developments (macro shocks, security headlines, liquidity events) and may not “understand” Solana-specific catalysts like Visa settlement rails or post-quantum testnets in a fundamental sense. Treat them as reference points, not promises. [35]
If you’re tracking SOL-USD into the end of 2025, today’s coverage suggests five practical watch items:
On Dec. 17, 2025, Solana USD (SOL-USD) sits at a technically sensitive spot near $123, with analysts largely converging on a simple framework: $120–$122 is key support; $130–$132 is the first major resistance. [41]
Meanwhile, Solana’s news cycle is unusually infrastructure-heavy—DDoS resilience, post-quantum signature experiments, and large institutional rails name-checking Solana for settlement—suggesting the ecosystem story remains active even as price stays tied to a cautious, risk-off crypto tape. [42]
This article is for informational purposes only and does not constitute financial advice. Cryptocurrency prices can change rapidly, and different data providers may show slightly different prices due to exchange and methodology differences. [43]
1. coinmarketcap.com, 2. coinmarketcap.com, 3. coinmarketcap.com, 4. coinmarketcap.com, 5. coinmarketcap.com, 6. coinmarketcap.com, 7. coinmarketcap.com, 8. www.investing.com, 9. www.coingecko.com, 10. www.reuters.com, 11. www.barrons.com, 12. unchainedcrypto.com, 13. unchainedcrypto.com, 14. www.tradingview.com, 15. beincrypto.com, 16. usa.visa.com, 17. www.reuters.com, 18. investors.statestreet.com, 19. www.galaxy.com, 20. crypto.news, 21. bravenewcoin.com, 22. www.altcoinbuzz.io, 23. cryptorank.io, 24. cryptorank.io, 25. www.altcoinbuzz.io, 26. crypto.news, 27. crypto.news, 28. cryptorank.io, 29. cryptorank.io, 30. cryptorank.io, 31. crypto.news, 32. www.reuters.com, 33. changelly.com, 34. coincodex.com, 35. usa.visa.com, 36. crypto.news, 37. cryptorank.io, 38. unchainedcrypto.com, 39. usa.visa.com, 40. www.reuters.com, 41. coinmarketcap.com, 42. unchainedcrypto.com, 43. coinmarketcap.com
A new higher swing high for the short-term advance at $4,353 was reached last Friday, resulting in three tight days of consolidation near that high. Wednesday’s high of $4,349 marked the third recent test of that resistance zone. A decisive breakout above triggers resolution of the four-day range and continuation of the short-term uptrend. Retained bullish momentum thereafter positions gold for a new trend high breakout above $4,381.
The bull trend in gold has been rebounding from an October retracement low of $3,886 with strength confirmed by breakouts above the 20-day and 10-day averages, subsequently defended as support during pullbacks. The advance also delivered a second bull breakout of two rising trend channels—one long-term and the other measuring the advance begun in March 2024—after the first October attempt failed and produced the brief bearish correction.
Gold is expected to resolve to the upside if it remains above the key dynamic support area. The 10-day average at $4,256 is rising and about to advance above the top of the shorter channel. Momentum has been lacking overall during the recent advance, but momentum could be triggered once the 10-day average meets up with price. In its current location, it represents potential support along with the top channel line and near-term uptrend line, which cross in a day. Three indicators identifying a similar potential support area strengthens its significance either as support or a pivot that breaks to the downside.
Gold’s persistent tight range near the $4,353 high and advancing averages keep the bull case dominant with buyers positioned to deliver the strongest close in months. Clearance of $4,353–$4,381 unlocks new record territory; hold the converging 10-day/channel/uptrend support on any weakness and the path of least resistance stays higher.
For a look at all of today’s economic events, check out our economic calendar.
The GBP/USD exchange rate dropped by 0.75% on Wednesday after the UK published encouraging consumer inflation data. Sterling dropped to a low of 1.3327, down from this week’s high of 1.3460.
The GBP/USD exchange rate pulled back and erased some of the recent gains as investors reacted to the latest UK inflation data. This also explains why the UK bond yields dropped as the FTSE 100 Index rose.
A report by the Office of National Statistics (ONS) showed that the headline Consumer Price Index (CPI) dropped from 3.5% in October to 3.2% in November.
UK’s inflation dropped by minus 0.2% on a MoM basis after rising by 0.3% in the previous month.
Meanwhile, core CPI, which excludes the volatile food and energy prices, dropped by 0.1% on a MoM basis, bringing the annual inflation figure to 3.2%.
More data shows that the retail price index (RPI) dropped from 4.3% to 3.8%, while the Producer Price Index (PPI) dropped from 3.6% to 3.4%.
These numbers mean that the country’s inflation is moving in the right direction, a move that confirms that the Bank of England will cut interest rates by 0.25% in the final meeting of the year on Thursday this week.
The BoE has delivered several interest rate cuts in the past few months, moving from a high 5.25% in August 2024 to the current 4%. As such, a cut will bring the headline interest rates to 3.75%, even as the inflation remains above 2%.
The bank will cut rates as the economy has remained under pressure in the past few months. For example, a report released on Tuesday showed that the unemployment rate rose to 5.1% from the previous 5.0%. The average earnings with bonus dropped to 4.7% from the previous 4.9%.
The next important catalyst for the GBP/USD exchange rate will be the upcoming US consumer inflation report, which will come out on Thursday.
Economists polled by Reuters and Bloomberg expect the upcoming US inflation report will come in at 3.0%, much higher than the Federal Reserve’s target of 2.0%.
Data compiled by Polymarket also places the odds of inflation coming in at 3.0% rising to 44%. It is followed by 3.1%, which is at 42%.
The US inflation report comes a week after the Federal Reserve delivered the third interest rate cut of the year and pointed to one more in 2026.

The daily timeframe chart shows that the GBP/USD exchange rate rose from the psychological level of 1.3000 in November to a high of 1.3460.
It pulled back to a low 1.3327, its lowest level on October 10. It has dropped to the 50-day and 100-day Exponential Moving Averages.
The pair has formed an inverse head-and-shoulders pattern, which is a common bullish reversal sign. Therefore, the pair will likely rebound as bulls target the next psychological level at 1.3500. A move above that level will point to more gains, potentially to the year-to-date high of 1.3725
The post GBP/USD forecast as odds of BoE interest rate cut jump on Polymarket appeared first on Invezz
Ethereum USD (ETHUSD) has seen a sharp drop to $2810.69, a significant decrease of $153.71 since opening. This downturn, reflected by a 5.19% drop today, raises questions about the market’s next move for this top cryptocurrency.
Ethereum USD has just hit $2810.69, recording a notable decline of 5.19% today. The intraday low touched $2790.01, while the high reached $3028.99. With a market cap of approximately $354 billion, Ethereum’s trading volume climbed to 369,841,310, surpassing its average volume of 291,012,931. This surge in volume indicates growing market interest amidst volatility.
Several technical indicators suggest a bearish trend for Ethereum USD. The RSI stands at 40.89, indicating potential oversold conditions. The MACD, at -86.59 with a histogram of 36.25, further supports a bearish outlook. Meanwhile, the ADX at 38.15 shows a strong trend, reinforcing current market conditions.
ETHUSD’s monthly forecast predicts a potential dip to $2644.67, aligning with current bearish signals. However, a quarterly forecast of $3457.34 suggests possible recovery in the medium term. Long-term predictions show promising growth, with a yearly target of $3367.76 and a five-year forecast of $4809.89. Forecasts can change due to macroeconomic shifts, regulations, or unexpected events affecting the crypto market.
Recent coverage by Yahoo Finance highlights broader market declines impacting Ethereum. With major cryptos experiencing downturns, Ethereum’s recent price action reflects broader market jitters. The fluctuating sentiment underscores caution, and traders are closely monitoring global economic pointers and regulatory updates for cues.
Ethereum USD’s recent price drop highlights significant market volatility. While technical indicators lean bearish, the forecast suggests mixed signals with potential for mid-term recovery. Traders should stay informed, considering factors like economic policy changes or regulatory shifts that could alter the crypto landscape drastically.
As of the latest data, the price of ETHUSD is $2810.69 after a decline of 5.19% today, dropping by $153.71 from its previous close of $2964.4.
ETHUSD
Key indicators include an RSI of 40.89, MACD at -86.59, and ADX at 38.15, all pointing to a bearish sentiment in the current market conditions for ETHUSD.
The monthly forecast is $2644.67, while the quarterly forecast is $3457.34. Long-term projections expect ETHUSD to reach $3367.76 annually and $4809.89 in five years.
Recent news coverage indicates broader market declines, impacting Ethereum USD and reflecting general market uncertainty. Economic policies and regulations are closely watched for potential impacts.
While current technical indicators show a bearish trend, the mid-term forecast suggests a possible recovery. Traders should keep an eye on macroeconomic and regulatory developments.
Disclaimer:
Cryptocurrency markets are highly volatile. This content is for informational purposes only.
The Forecast Prediction Model is provided for informational purposes only and should not be considered financial advice.
Meyka AI PTY LTD provides market data and sentiment analysis, not financial advice.
Always do your own research and consider consulting a licensed financial advisor before making investment decisions.
Start every day with the top news stories right now, plus original features, a podcast, videos and more.
Tuesday’s decline was confirmed with a daily close below both dynamic trend indicators, but Wednesday’s swift response turned it into a potential false breakdown. The completion of the key Fibonacci retracement, together with this quick reclaim, suggests a counter-trend rally may have started. Tuesday marked the seventh consecutive day of lower daily highs and lows that followed a minor three-year high of $5.02 reached earlier this month.
The 50-day average was broken a week ago Tuesday, followed by a drop through the lower trendline of a rising channel that accelerated the decline to the 200-day average. Sharp moves commonly follow failed breakouts, and the rapid recovery on Wednesday fits that classic pattern.
The most obvious potential resistance zone if natural gas continues strengthening short-term spans from a November swing low of $4.09 up to the 50% retracement at $4.32. Included within that band is the 50-day average at $4.26 currently, while the falling 20-day average at $4.34 will soon enter the range. The 38.2% Fibonacci retracement also sits inside at $4.15. A swing back to test prior support areas as resistance is a natural progression following the breakdown of an advancing trend channel.
Key near-term support now rests at Wednesday’s low of $3.69; a drop below shows weakness rather than additional strength. A rally above Monday’s high of $3.92 further confirms the bullish reversal and raises odds that the higher resistance zone gets tested on this bounce.
Natural gas has flipped from a confirmed breakdown of the 200-day average with Tuesday’s close below the average, to a potential false breakdown with the rapid reclaim of the 200-day average and trendline off the 61.8% Fib completion. Hold $3.69 and push above $3.92 to target $4.09–$4.32; failure to defend current lows re-exposes deeper correction, while the counter-trend rally case stays favored until proven otherwise.
For a look at all of today’s economic events, check out our economic calendar.
Bitcoin’s USD price (BTC-USD) is trading in a tense range on December 17, 2025, as traders weigh conflicting signals: persistent U.S. spot Bitcoin ETF outflows, a still-uncertain Federal Reserve rate path, and evidence that institutional interest remains real—but increasingly selective.
As of writing, Bitcoin (BTC-USD) is around $86,108, down about 1.6% versus the prior close, after printing an intraday high near $90,187 and low near $85,355.
That level keeps BTC well below its October peak (around the mid-$126,000s), and it helps explain why “year-end rebound” headlines are being met with skepticism across both crypto-native and traditional markets. [1]
While price action has been choppy, several market reads describe Bitcoin as range-bound rather than in free-fall.
In other words: BTC-USD is still moving fast (as it always can), but the bigger story today is the tug-of-war between structural support and overhead selling pressure.
One of the most watched BTC-USD drivers in late 2025 remains spot ETF flow momentum—and the latest data has turned into a clear headline.
Farside Investors data shows U.S. spot Bitcoin ETFs recorded a net outflow of about $277.2 million on Dec. 16, with IBIT at -$210.7 million, while FBTC showed +$26.7 million (and several others were negative or flat). [4]
That matters because multiple market notes argue ETF demand is now the “swing factor” for Bitcoin—especially as other sources of incremental buying have slowed (more on that below). [5]
Bitcoin has increasingly traded like a high-beta risk asset in 2025—moving with (and sometimes exaggerating) shifts in broader risk sentiment.
Investing.com explicitly pointed to:
That “macro-first” framing also shows up in on-chain commentary: Glassnode described weak ETF flows, thin spot liquidity, and defensive positioning leaving BTC sensitive to macro catalysts. [7]
A Reuters analysis published today says the recent downturn has pushed investors toward risk-managed strategies, highlighting a broader shift: crypto exposure is increasingly expressed through ETFs, options, and structured tools, rather than pure directional bets. [8]
Reuters also emphasized how the downturn hit some of the most “hyped” corners of the market—particularly bitcoin-treasury companies, whose premiums have compressed sharply as BTC fell from its October highs. [9]
Forecasts for Bitcoin tend to cluster around levels—because in crypto, narratives often change at specific prices.
Here are the most-cited BTC-USD zones in today’s analysis:
Why this area matters: If Bitcoin loses the low-$80Ks, the market conversation can quickly shift from “consolidation” to “breakdown.”
Why this area matters: A clean break above ~$95k would reduce the “overhead supply” pressure narrative and could shift market tone quickly back toward $100k debates.
No one can forecast Bitcoin perfectly—especially in a market where macro headlines can reprice risk in minutes. But today’s research largely points to scenario planning.
If ETF flows remain mixed and macro data doesn’t surprise, analysts describing BTC as “range-bound” see price oscillating between low-$80Ks support and mid-$90Ks resistance into year-end. [15]
Glassnode also notes large December options expiries (including Dec. 26) may contribute to “pinning” behavior that reinforces range trading. [16]
A decisive move below $80k is the level where several forecasts get harsher. DailyForex suggests that a breakdown could open the door to much deeper downside targets (with $65k mentioned as a potential level in that scenario). [17]
If macro risk sentiment improves and ETF flows stabilize, a move above ~$95k is widely treated as the “regain momentum” trigger, with $100k the next major psychological battleground. [18]
Long-range BTC-USD forecasts vary wildly—but a few calls are dominating the December conversation because they come with clear assumptions about where demand will come from next.
Reuters’ Live Markets report (Dec. 10) said Standard Chartered’s Geoff Kendrick cut 2025 and 2026 forecasts in half, now expecting around $100,000 by end-2025 and $150,000 by end-2026, while still keeping a longer-run view that Bitcoin could reach $500,000 by 2030. [19]
Investing.com’s coverage adds important color: Kendrick argued the recent drawdown is steep but “within historical norms,” and that future upside is expected to be driven largely by ETF inflows, with bitcoin-treasury-company buying no longer assumed to be a reliable incremental support. [20]
That same demand-shift theme is echoed in Reuters’ broader Dec. 17 analysis: the crypto market is “maturing,” with more structured tools and more nuanced exposure replacing the earlier era of reflexive leverage. [21]
The Motley Fool’s Dec. 17 piece explicitly questions whether BTC can hit $200,000 in 2026, calling the “more than doubling” required from current levels a tall task and pointing to more cautious outlooks after the late-2025 pullback. [22]
While these aren’t bank research notes, they’re indicative of a broader shift in tone: fewer “straight line up” calls, more probability-weighted framing around macro conditions, ETF flows, and risk sentiment.
One of the most important through-lines in today’s reporting is the idea that Bitcoin has become more “institutional” in market structure—without necessarily becoming less volatile.
Reuters highlighted ongoing institutional involvement (including endowments and sovereign wealth funds) even as investors get more cautious after the drawdown. [23]
At the same time, crypto’s relationship with broader tech-and-risk narratives continues to show up in coverage. Barron’s described Bitcoin as behaving less like gold and more like a risk-sensitive asset tied to broader market sentiment, while warning of downside tests if risk aversion persists. [24]
If you’re tracking Bitcoin price today with an eye on the forecast, the next catalysts most cited in today’s reporting are:
1. www.reuters.com, 2. www.investing.com, 3. insights.glassnode.com, 4. farside.co.uk, 5. www.investing.com, 6. www.investing.com, 7. insights.glassnode.com, 8. www.reuters.com, 9. www.reuters.com, 10. insights.glassnode.com, 11. www.dailyforex.com, 12. www.barrons.com, 13. insights.glassnode.com, 14. www.dailyforex.com, 15. insights.glassnode.com, 16. insights.glassnode.com, 17. www.dailyforex.com, 18. www.dailyforex.com, 19. www.reuters.com, 20. www.investing.com, 21. www.reuters.com, 22. www.fool.com, 23. www.reuters.com, 24. www.barrons.com, 25. www.investing.com, 26. farside.co.uk, 27. insights.glassnode.com, 28. insights.glassnode.com
Silver extended its explosive 2025 rally on Wednesday, December 17, 2025, pushing deeper into record territory as momentum traders, industrial buyers, and macro investors piled into the “white metal” at the same time.
At roughly 12:17 (time-stamp on live pricing feeds), spot silver (XAG/USD) traded around $66.35 per ounce, up about 4% on the session, with the day’s range stretching from roughly $63.68 to $66.56. [1]
That move came after silver briefly cleared $66 and set a fresh all-time high around $66.52/oz, according to Reuters, as markets reacted to a softer labor-market narrative, shifting rate expectations, and a broader bid across precious metals. [2]
The live tape tells the story of a market in “price discovery” mode:
Silver’s surge is also happening in a broader “white metals” upswing: Reuters reported platinum hitting a 17-year high and palladium moving higher in the same risk-on/rate-cut setup, reinforcing the sense that investors are rotating across the complex rather than treating this as a silver-only story. [7]
Silver is unusual because it trades like both a precious metal and an industrial input. This week’s price action reflects all of that “dual identity” firing at once.
Silver doesn’t pay interest, so the metal tends to benefit when markets expect lower policy rates and easier financial conditions.
Reuters tied Wednesday’s push to renewed expectations of U.S. Federal Reserve easing after signs of labor-market softening and investor positioning for additional 2026 cuts. The same Reuters report also pointed to safe-haven support stemming from heightened geopolitical tension around Venezuela. [8]
A major theme in the latest round of analysis is that silver’s rally isn’t only “paper-driven.” Analysts argue the physical side is strained—then gets even tighter when investment products absorb metal.
An Investing.com analysis highlighted how silver-backed ETPs (exchange-traded products) have added an estimated 187 million ounces in 2025 (an ~18% increase in holdings), and emphasized that metal held in ETPs is effectively removed from the pool available to industry and some settlement flows. [9]
Trefis echoed the same core mechanism: once ETF flows flip positive, “paper demand” can turn into a real-world price accelerant because physical inventory has to be sourced and warehoused. [10]
Beyond the macro and flows story, silver’s bullish case still leans heavily on industrial use—especially as electrification and “green tech” expand.
A key policy tailwind in the background: the U.S. Geological Survey notes that the final 2025 U.S. critical minerals list adds silver among the newly included minerals, tying the metal more explicitly to supply-chain security and strategic planning. [11]
That designation doesn’t automatically change supply/demand overnight, but it can reshape how market participants talk about silver—particularly around inventories, sourcing, and the longer-run importance of reliable supply.
Below is the clearest “through-line” from the most recent coverage and commentary published since December 15, 2025—the window you requested.
Forecast chatter turned more aggressive. Technical and macro-focused market commentary argued that silver’s momentum was being reinforced by supportive macro conditions and policy narratives.
How this mattered for price: Dec. 15 reads like the point where a lot of market commentary stopped treating silver as a “catch-up trade” and started treating it as a standalone leadership trade—which can feed momentum when positioning is underbuilt.
As silver consolidated and traders debated how much of the move is “fundamental” versus “flow-driven,” bank research introduced an important counterweight:
Meanwhile, mainstream market trackers continued to anchor the move in eye-catching spot levels: Fortune’s commodity snapshot (Dec. 16) put silver at about $63.37/oz at 8:30 a.m. ET, underscoring how elevated prices already were even before Wednesday’s fresh highs. [17]
How this mattered for sentiment: When a market is ripping higher, the most important “bearish” inputs often aren’t outright negative calls—they’re reasons the upside might slow. Morgan Stanley’s argument effectively says: even if precious metals stay strong, silver’s 2026 incremental demand may not be as one-way as the 2025 narrative suggests. [18]
On Wednesday, silver moved from “strong” to “headline” again:
In short: Dec. 15 built the narrative, Dec. 16 introduced pushback, and Dec. 17 confirmed the market still wants higher prices.
Forecasting silver right now is less about pinning down a single number and more about mapping scenarios—because silver’s volatility cuts both ways.
Two separate strands of coverage converged on the same milestone:
What would likely support a push to $70: cooling inflation surprises, weaker real yields, continued ETF/ETP inflows, and sustained physical tightness.
What could block it: a sharp rebound in the U.S. dollar, hotter inflation prints that force repricing of rate cuts, or aggressive profit-taking after such a rapid run.
This is where forecasts start to diverge.
The bullish camp:
INN’s Dec. 15 forecast roundup emphasizes the idea of a persistent structural supply deficit and argues that even if deficits shrink, they can still underpin prices—especially if investment demand remains firm. [23]
A separate, more aggressive public-market forecast surfaced via Barron’s reporting from a December 2025 event: strategist Mary Ann Bartels (Sanctuary Wealth) floated $80–$100/oz as a potential silver range in her 2026 outlook remarks. [24]
The cautious institutional view:
Morgan Stanley’s note (via Reuters) is a reminder that silver’s 2025 setup may not repeat cleanly: the bank expects silver to underperform gold and flags the possibility that the supply deficit peaks in 2025, partly due to falling solar installations in 2026. [25]
How to reconcile these:
Silver’s addition to the U.S. critical minerals list is not a day-to-day trading signal—but it can influence policy focus, permitting priorities, and the way investors frame long-term supply risk.
USGS explains that the final list identifies minerals vital to the U.S. economy and national security that face potential supply disruption risks, and that the 2025 update added silver among other minerals. [26]
That policy backdrop is one reason the metal is increasingly discussed in the same breath as other strategic inputs used in electrification and advanced manufacturing—even as it remains a traditional precious metal.
Silver is now so headline-driven that the next major macro print can matter as much as physical-market signals.
1) U.S. inflation data (CPI and PCE)
Reuters notes markets are looking to upcoming releases—CPI and PCE—as the next major inputs into rate expectations and, by extension, precious metals pricing. [27]
2) The path of Fed cuts into 2026
Reuters reported that investors are pricing two 25-basis-point cuts in 2026, reinforcing the macro tailwind for non-yielding metals. [28]
3) ETP/ETF flows and inventory signals
If the “ETP absorption” story continues at scale, it can keep the market tight. If flows reverse, the same channel can amplify downside volatility. [29]
4) Industrial demand signals (especially solar-linked)
Morgan Stanley’s caution about solar installations in 2026 is a reminder that not all industrial demand is guaranteed to accelerate indefinitely. [30]
As of 12:17 today, silver is trading like a market where macro tailwinds (rate-cut bets), policy narratives (critical mineral status), and real-world constraints (tight physical supply plus investment absorption) are reinforcing each other—pushing XAG/USD to fresh records above $66/oz. [31]
The near-term “number” most analysts and traders keep circling is $70/oz, but forecasts for 2026 are increasingly split between very bullish upside cases and more cautious bank research that argues silver’s strongest deficit dynamics may cool. [32]
1. www.investing.com, 2. www.reuters.com, 3. www.investing.com, 4. www.investing.com, 5. www.reuters.com, 6. www.reuters.com, 7. www.reuters.com, 8. www.reuters.com, 9. www.investing.com, 10. www.trefis.com, 11. www.usgs.gov, 12. www.fxleaders.com, 13. www.investing.com, 14. investingnews.com, 15. www.trefis.com, 16. www.reuters.com, 17. fortune.com, 18. www.reuters.com, 19. www.reuters.com, 20. www.reuters.com, 21. www.reuters.com, 22. www.fxleaders.com, 23. investingnews.com, 24. www.barrons.com, 25. www.reuters.com, 26. www.usgs.gov, 27. www.reuters.com, 28. www.reuters.com, 29. www.investing.com, 30. www.reuters.com, 31. www.investing.com, 32. www.reuters.com