The main category of All News Articles.
You can use the search box below to find what you need.
[wd_asp id=1]
The main category of All News Articles.
You can use the search box below to find what you need.
[wd_asp id=1]
XRP is once again defending its long-term $1.90 EMA support, signaling a potentially explosive move as traders position themselves for Monday’s debut of Grayscale’s XRP ETF.
The ongoing double-bottom retest on the monthly chart mirrors historic pre-rally setups seen in past XRP market cycles. With volume climbing and ETF inflows expected, analysts argue that holding this zone could trigger upside continuation toward $5 and beyond.
Technical analysts note that XRP’s price is currently testing its 20-month Exponential Moving Average (EMA) near $1.90 on the monthly timeframe. This long-term moving average has historically acted as a directional indicator for XRP’s macro trend.
XRP sits on its crucial 20-month EMA, a make-or-break level that often determines its next major price direction. Source: @ChartNerdTA via X
Independent technical analyst ChartNerd, known for long-range trend modelling, commented on X that “Holding or losing this moving average has generally signalled the direction for price action.”
Historical behavior supports this framework. Based on publicly available monthly XRP chart data:
In 2017, XRP’s sustained hold above the 20-month EMA preceded its rally toward the former XRP all-time high near $3.40.
Breaks below the same EMA in 2018 and 2020 coincided with extended corrective phases lasting multiple quarters.
As of November 22, XRP trades near $1.95, and analysts suggest that maintaining support on the monthly EMA may allow the price to attempt a move toward $2.21 on the daily timeframe. However, a confirmed monthly close below the 20-month EMA could expose the XRP coin to a deeper retracement toward $1.75.
Beyond short-term technical levels, several macro analysts highlight a broader multi-year structure that continues to attract market attention.

XRP is double-retesting its double-bottom breakout, a key bullish setup that could define its next major move. Source: @GertvanLagen via X
Market cycle analyst Gert van Lagen, who specializes in large-scale pattern identification, noted a “double retest of the double-bottom breakout” on XRP’s monthly chart. The formation began developing between 2021 and 2025, with a key neckline near $1.00. XRP has tested this neckline twice — a characteristic retest often observed in long-term reversal patterns.
Van Lagen compared the structure to a similar pattern that formed from 2014 to 2017, which preceded a significant breakout. His technical measurement model yields a theoretical long-term target near $52, based on classical double-bottom projection principles. However, this projection is contingent on XRP holding the neckline and maintaining sustained monthly closes above breakout levels. Failing those conditions could invalidate the setup and shift focus toward lower supports near $0.90.
For now, XRP is stabilizing around the $2.00 region, and analysts emphasize that multi-year patterns can take considerable time to fully confirm.
Momentum surrounding XRP has also been influenced by the upcoming launch of Grayscale’s Spot XRP ETF (GXRP), scheduled to go live on Monday. The ETF, confirmed through SEC filings for the Grayscale XRP Trust, marks a significant step in providing regulated market access to XRP cryptocurrency. Crypto commentator Steph_iscrypto shared documentation confirming the ETF’s status, noting: “GRAYSCALE’S SPOT XRP ETF GOES LIVE MONDAY. XRP TO $5 SEEMS FAIR.”
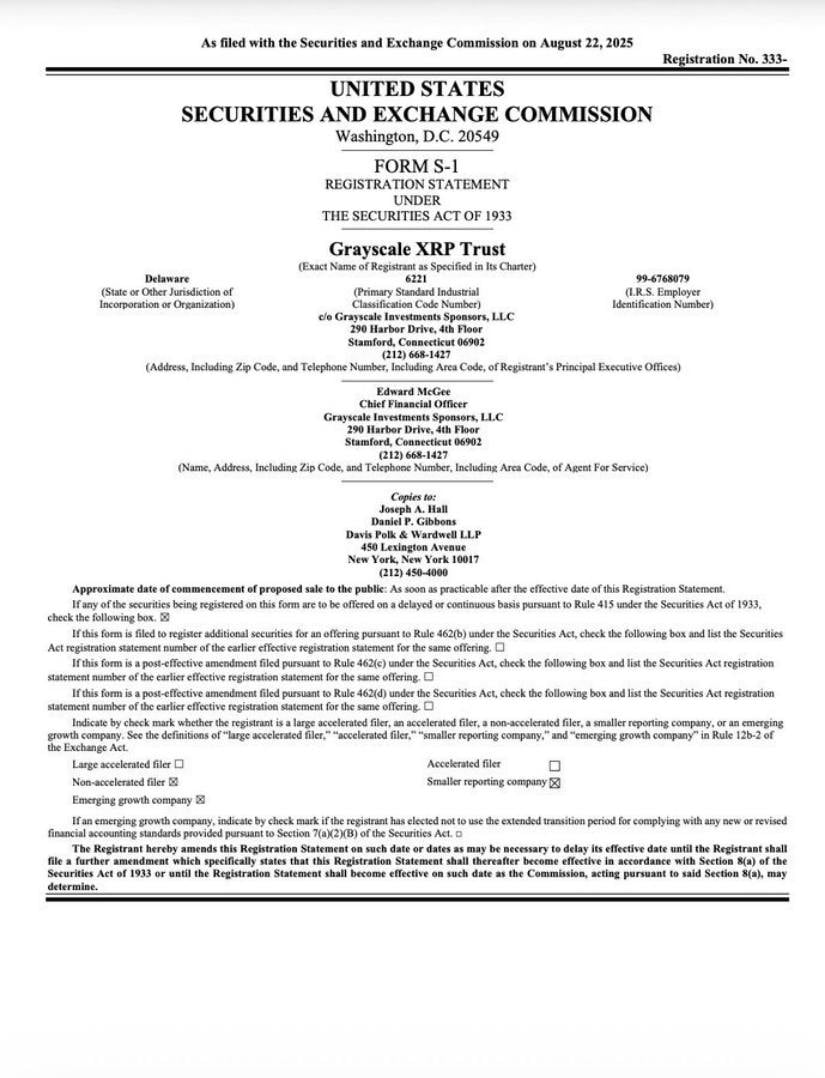
Grayscale’s spot XRP ETF goes live Monday, fueling bullish calls for a run toward $5—buckle up. Source: @Steph_iscrypto via X
This statement reflects a portion of community sentiment, though it does not represent a market-wide consensus forecast. Some analysts argue that while ETF listings tend to improve long-term liquidity and institutional accessibility, they do not guarantee immediate price appreciation, as inflows often develop gradually. Others point to factors such as broader market conditions, regulatory uncertainty, and historical ETF launch behavior across the crypto sector.
Community responses to the ETF news were mixed, with some traders expressing optimism about increased exposure, while others voiced concerns about potential volatility or unrealistic price expectations. Nevertheless, the ETF launch stands as one of the most notable milestones in recent XRP news, following developments in the ongoing Ripple vs. SEC legal narrative.
With the XRP live price consolidating near the 20-month EMA, market sentiment in the near term depends on whether the asset can defend this historically important support zone on the monthly chart. A stable hold above $1.90 may strengthen the bullish case and allow XRP to retest the $2.21 and $2.50 resistance levels identified on shorter timeframes.
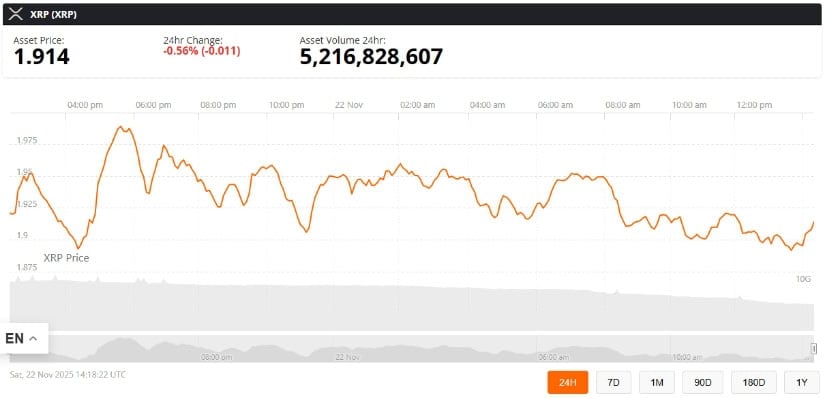
XRP was trading at around 1.91, down 0.56% in the last 24 hours at press time. Source: XRP price via Brave New Coin
The combination of the upcoming ETF launch, long-term structural patterns, and key technical indicators contributes to XRP’s developing outlook. However, analysts continue to caution that volatility is common around major product launches and that reactions to ETF debut flows may take time to stabilize.
For now, XRP remains at a pivotal moment—balancing long-term technical resilience, increasing institutional accessibility, and broader market sentiment as traders assess the next directional move.
A new report from decentralized exchange aggregator 1inch has shown a growing crisis in decentralized finance (DeFi): the vast majority of capital deployed in major DeFi liquidity pools is not being used effectively.
According to data presented at Devconnect Buenos Aires, between 83% and 95% of liquidity in top pools, including Uniswap v2, v3, and v4, as well as Curve, remains idle for most of the year. That means billions of dollars sit in smart contracts without earning fees or generating meaningful returns.
In Uniswap v2 alone, only 0.5% of liquidity typically falls within active trading price ranges, rendering nearly $1.8 billion ineffective according to the report.
This inefficiency hits retail participants the hardest. Research cited in the report shows that 50% of liquidity providers (LPs) are losing money when factoring in impermanent loss, with net liquidity provider deficits exceeding $60 million. In one notable example, a single Uniswap v3 pool saw over $30 million in lost profits due to Just-in-Time liquidity manipulation.
Part of the problem stems from the sheer number of fragmented pools, with more than seven million across the ecosystem. This complexity not only dilutes liquidity but also makes it harder to route trades efficiently, further reducing returns for liquidity providers.
To 1inch, the solution is its Aqua protocol, which is designed to let DeFi applications share the same capital base across multiple strategies without compromising user custody.
“We address this problem by introducing a new approach,” 1inch cofounder Segej Kunz told CoinDesk in an interview at Devconnect Buenos Aires. “We allow people to just keep assets in the wallet, and we allow people to create virtual trading positions.”
To Kunz, the current situation constitutes a “DeFi liquidity crisis.”
The protocol also aims to lower the barrier to entry for developers who want to utilize this deep liquidity. “Any existing DEX right now can be implemented under 10 lines of code,” Kunz added, noting that the goal is to provide “a foundation to build on top” so that liquidity providers can “hold assets in the wallet” rather than locking them inside complex protocol contracts.
– Written by
Frank Davies
STORY LINK British Pound to Dollar Forecast: GBP/USD Risks Tilted to Upside
The Pound to Dollar exchange rate (GBP/USD) held near 1.3075 despite a sharp global risk-off move led by equities and crypto.
Softer UK data and renewed fiscal worries are limiting Sterling’s ability to extend higher, keeping consensus expectations anchored around a 1.30-1.31 trading band.
Markets now look to incoming fiscal updates and December BoE signals to judge whether support at 1.30 can hold.
Volatility across asset classes jumped on Thursday with a particular focus on equities. The US S&P 500 index initially traded sharply higher before a sharp reversal in Nvidia triggered notable losses.
The FTSE 100 index also dipped sharply to 1-month lows on Friday while bitcoin slumped to 7-month lows.
In these circumstances, the Pound was broadly resilient with the Pound to Dollar (GBP/USD) exchange rate trading around 1.3075, but there will be notable unease surrounding the UK fundamentals and risk conditions.
Get better rates and lower fees on your next international money transfer.
Compare TorFX with top UK banks in seconds and see how much you could save.
According to UoB; “The outlook for today is mixed after the choppy price movements. Today, GBP could trade between 1.3045 and 1.3120.”
Key support remains around 1.30.
The UK government borrowing requirement narrowed to £17.4bn for October from £19.2bn the previous year, but above consensus forecasts of £15.2bn.
For the first seven months of fiscal 2025/26, the deficit widened to £116.8bn from £107.8bn the previous year and around £10bn above ONS projections.
Richard Carter, head of fixed interest research at Quilter Cheviot commented; “Ultimately, today’s borrowing figures suggest Reeves is running out of room, and potentially time, to kick start the economy and get it growing once again. While rate cuts will help, inflation remains sticky and as such the Bank of England may not act as aggressively as the government would like. The ball is in Reeves’ court, but her next move will prove crucial next week.”
Kenneth Broux, head of corporate research FX and rates at Societe Generale commented; “It’s very difficult and I think there’s quite a bit of bad news already priced in, but it doesn’t mean that it can’t get worse.”
He added; “If the gilt market has absolutely no trust in the new borrowing figures and whether the fiscal headroom can be delivered, then we will see a fair steepening of the gilt curve and that is going to result in a weaker sterling.”

Retail sales data was also weaker than expected with a 1.1% decline in volumes for October compared with expectations of a 0.1% decline with the year-on-year increase held to 0.2%.
The UK PMI services-sector index also dipped to a 7-month low of 50.5 for October from 52.3 and below consensus forecasts of 52.0 although the manufacturing PMI index edged back above the 50.0 level to a 14-month high.
Notably, the rate of increase in output charges slowed to a 5-year low despite strong upward pressure on costs.
Chris Williamson, Chief Business Economist at S&P Global Market Intelligence commented; “November’s flash PMI surveys brought disappointing news on the UK economy. Economic growth has stalled, job losses have accelerated, and business confidence has deteriorated.”
He added; “The PMI data therefore suggest the policy debate will shift further away from inflation worries toward the need to support the struggling economy, hence adding to the chances of interest rates being cut in December.”
International Money Transfer? Ask our resident FX expert a money transfer question or try John’s new, free, no-obligation personal service! ,where he helps every step of the way,
ensuring you get the best exchange rates on your currency requirements.
TAGS: Pound Dollar Forecasts
As Bitcoin (BTC USD) traded near $83,900, the market witnessed numerous price prediction observations from analysts and market watchers.
On November 21, the price briefly touched $80,000 on derivatives exchange Hyperliquid before stabilizing in the low-$80,000 range.
This triggering widespread liquidations across cryptocurrency markets. At the time of writing the leading crypto was trading at
Analyst Stacy Muur aggregated predictions from five market observers on November 21, presenting a range of potential local bottom targets.
The forecasts spanned from $75,000 to $94,500, with varying methodologies and timeframes for Bitcoin price support levels.

Chris Burniske of Placeholder VC identified $75,000 or lower as a re-entry level rather than a formal bottom call.
On October 17, Burniske stated he took profits after the sharp October crash, noting “cracks” in the monthly charts for Bitcoin and Ethereum.
He indicated he would watch Bitcoin’s reaction to $100,000 but would only consider buying again when Bitcoin reached $75,000 or lower, framing this as part of a gradual de-risking strategy.
Arthur Hayes of BitMEX projected a near-term target of $80,000 to $85,000, followed by $200,000 to $250,000 by year-end.
In his November 17 essay “Snow Forecast,” Hayes argued that Bitcoin’s drop from approximately $125,000 to the $90,000 area, while US equity indices remained near highs, signaled a looming credit event.
According to his Bitcoin price prediction, it could fall to roughly $80,000-$85,000 during a “soft period” before Federal Reserve or Treasury money-printing schemes could drive prices to $200,000-$250,000.
Chinese analyst Ban Mu Xia forecast a first stop at $94,500, with an ultimate bottom near $84,000.
His view is of a “complex sideways adjustment,” in which Bitcoin first dipped to around $94,500, then entered an oscillation that could rebound above $116,000 before forming an ultimate bottom near $84,000, potentially 6-8% lower at extremes.
JPMorgan analysts, led by Nikolaos Panigirtzoglou, discussed the forced selling risk related to a potential removal of MicroStrategy from the index, rather than publishing a specific Bitcoin price target.
The bank estimated that roughly $2.8 billion in passive flows could be forced to sell MicroStrategy stock if MSCI removed the company from major equity benchmarks, with as much as $8.8 billion at risk if other index providers followed suit.
The $75,000-$80,000 range corresponded to common technical support zones identified in this analysis.
CoinShares’ James Butterfill focused on flow data and cycle behavior rather than numeric bottom predictions.
In Bloomberg coverage, Butterfill stated crypto suffered “heavy selling by whales who follow the four-year cycle narrative.”
He noted CoinShares data showed large holders sold more than $20 billion in crypto since September, calling the pattern “somewhat self-fulfilling” even though CoinShares did not fundamentally endorse the four-year-cycle thesis.
Coinglass data showed $2.2 billion in positions liquidated in the crypto market over the past 24 hours, as of press time.
Bitcoin USD accounted for approximately $1 billion of total liquidations, with long positions representing $887 million. Roughly 391,000 traders faced liquidations across exchanges.
The cascade of forced selling created a feedback loop that accelerated downward price pressure as leveraged traders were forced to close positions.
The total cryptocurrency market capitalization dipped below $3 trillion for the first time since April 2025, currently at $2.96 trillion, down 7.5% over the past 24 hours.
US-listed spot Bitcoin ETFs recorded approximately $3.79 billion in net outflows during November, the largest monthly outflow since the products launched in January 2024.
Open interest in Bitcoin perpetual futures fell 35% from October’s peak near $94 billion, reducing liquidity across derivatives markets.
The combination of reduced open interest, extreme fear sentiment, and massive liquidations created conditions where relatively small sell orders moved the Bitcoin price significantly.
It remains to be seen whether the current range will provide support for a bounce or if Bitcoin is preparing for a move into a bearish period.
The post Will Bitcoin (BTC USD) Price Slump To $75,000? appeared first on The Coin Republic.
Today, Maradona NFT sales have skyrocketed by 1,000%, capturing the attention of investors across Switzerland. This explosive growth highlights the burgeoning interest in digital collectibles, particularly sports memorabilia NFTs. With fans keen to own a piece of the legendary footballer’s legacy, this trend signals NFTs as emerging alternative investment opportunities.
Maradona, a global sports icon, has long captivated fans. However, in recent weeks, Maradona NFT sales have surged by an astonishing 1,000%. This spike highlights the trending shift towards digital collectibles. As NFTs continue gaining popularity among investors and collectors, Maradona’s digital memorabilia stands out.
This rise aligns with a broader trend favoring sports memorabilia NFTs. Enthusiasts view these collectibles as unique investments, often with intrinsic historical value. The market for NFTs has expanded rapidly, alluring both young tech-savvy investors and traditional collectors exploring new terrains. You can explore more about this trend on https://meyka.com/blog/maradona-nft-sales-skyrocket-exploring-the-digital-collectible-surge-2211/.
The concept of digital collectibles has transformed how we perceive ownership. With blockchain technology’s ability to ensure unique digital ownership, NFTs have surged in popularity. This trend marks a shift from physical to digital, with sports NFTs capturing a significant market share.
Sports memorabilia NFTs appeal to fans who wish to digitally own moments and mementos linked to their favorite athletes. Maradona’s legacy, immortalized through NFTs, offers exclusive ownership potential for fans. This growing interest exemplifies how sports collectibles are pivotal in driving NFT market expansion.
Switzerland, with its robust fintech ecosystem, is quickly becoming a hub for NFT trading. Legal frameworks supporting blockchain and digital assets are crucial in fostering this industry. Switzerland’s regulatory environment encourages innovation while maintaining consumer protection, a balance crucial for NFTs.
The surging Maradona NFT sales highlight the potential legal implications of increasing digital asset trades. Ensuring the authenticity and copyright compliance of NFTs remains a priority. This regulatory landscape facilitates a thriving market while safeguarding investors and creators alike.
The surge in Maradona NFT sales is more than just a fleeting trend; it exemplifies a major shift in how digital collectibles are valued and perceived, particularly in Switzerland. As investors and fans alike seek innovative assets, NFTs offer an enticing blend of novelty and nostalgia. The fusion of technology with sports memorabilia not only diversifies investment portfolios but also revives cultural icons in new forms. For Switzerland, this growth signifies a promising future for digital asset markets, provided legal frameworks evolve in tandem. The coming years could see an even greater integration of NFTs across various facets of culture and commerce.
Maradona NFTs are digital collectibles representing various aspects of Diego Maradona’s legacy. They include highlights from his career, exclusive artwork, and memorabilia authenticated through blockchain technology.
Maradona NFT sales have surged due to increased interest in digital collectibles, especially sports-related NFTs. Fans and investors alike see these as unique opportunities to own exclusive pieces of Maradona’s legacy.
Switzerland is embracing the NFT trend with supportive regulations for blockchain technology. The country is establishing itself as a key player in the NFT market, appealing to both local and international investors.
Disclaimer:
The content shared by Meyka AI PTY LTD is solely for research and informational purposes.
Meyka is not a financial advisory service, and the information provided should not be considered investment or trading advice.
The GBP/USD weekly forecast reveals sustained pressure as the soft UK data, like a 1.1% MoM drop in UK retail sales in October, while annual growth came at 0.2%, both well below expectations.
-Are you looking for the best AI Trading Brokers? Check our detailed guide-
Meanwhile, sterling came under pressure amid growing odds of the Bank of England’s tilt towards a looser policy in the near term due to weaker domestic demand and persistent fiscal concerns ahead of the Autumn budget. The UK PMI data remained mixed, failing to generate any buying traction. On the other hand, the US Federal Reserve signaled caution as inflation remains a risk, shrinking December rate cut expectations. The net effect is GBP/USD staying within a narrow range near 1.3100 after finding a bottom around 1.3050.
Across the Atlantic, the US dollar remains firm after hawkish FOMC meeting minutes that dampened expectations for rate cuts, as revealed by the CME FedWatch tool, to around 35%. The US NFP data exceeded expectations, reflecting 119k jobs added against the expected 55k. The October data is not likely to be released, although some of it will be reflected in the November data, which will be key to watch. Meanwhile, US PMI readings showed a mild improvement, with no significant impact on the US dollar.
Moving ahead to the next week, the outlook remains tilted to the downside unless sterling receives a positive boost. On the UK side, the market participants will be watching for signs of stabilization in consumer spending after poor retail sales. However, the primary focus remains on the UK budget. In the US, the focus lies on the labor and inflation data, along with further remarks from Fed officials. The significant events scheduled for next week include Core PCE, PPI, Retail Sales, and the GDP Price Index.
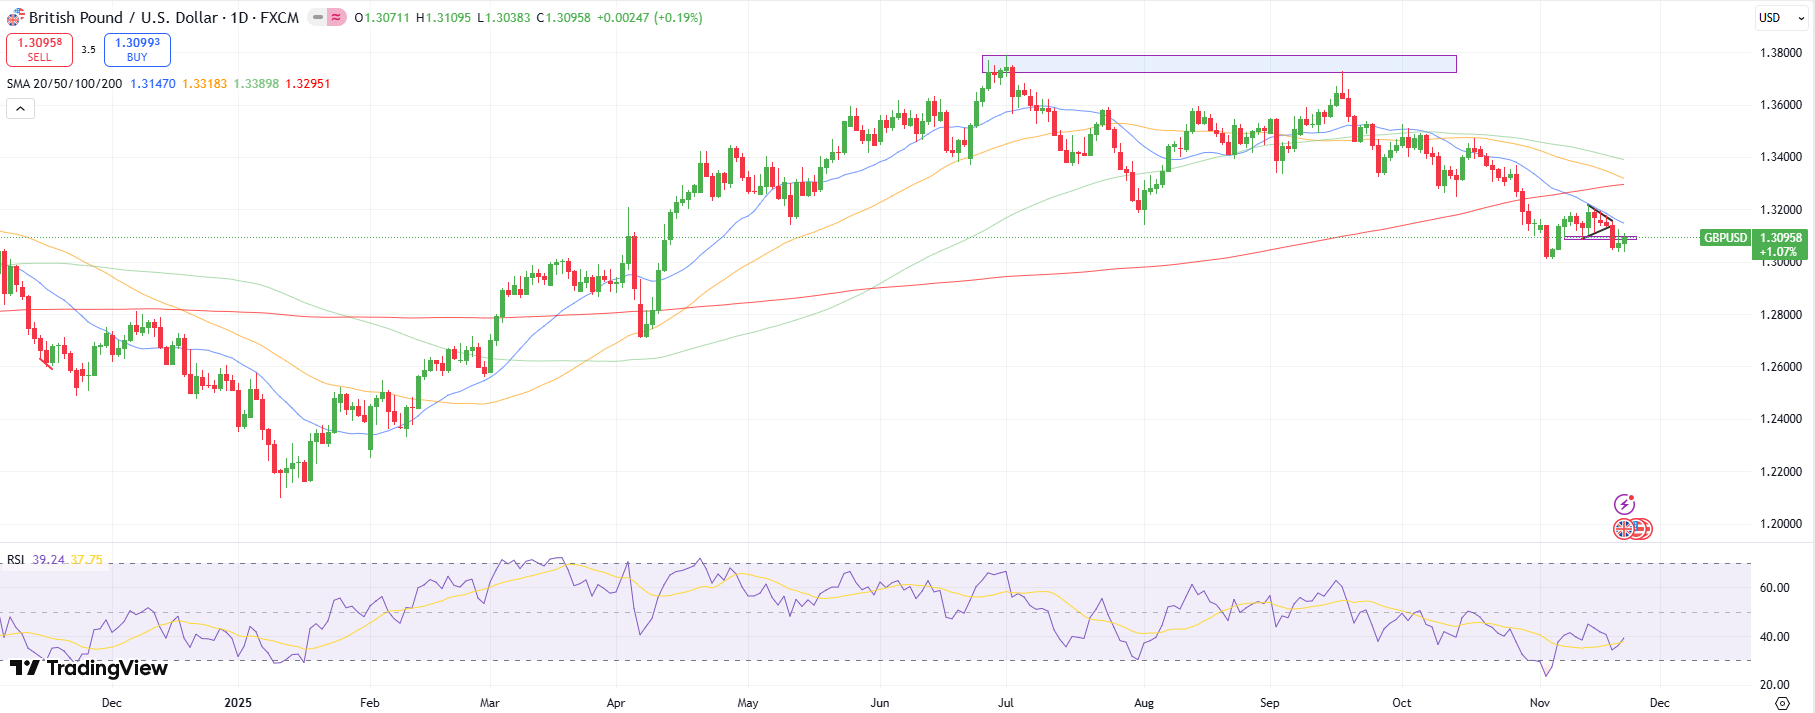
The GBP/USD daily chart reveals a weak structure near the broken demand zone. A strong bearish candle, followed by a bearish pinbar, shows the odds of more downside. However, 1.3050 acts as an intermediate support ahead of 1.3000. As UOB states, the pound is unlikely to find a sustained breakout below 1.3000. But a breakout could attract more sellers and test the 1.2900 level.
-Are you looking for the best MT5 Brokers? Check our detailed guide-
On the other hand, any acceptance above the 1.3100 area could gather buying momentum and aim to test the 1.3200 level. While the RSI has begun rising from the oversold region, it remains below 50.0, indicating neutral momentum.
Looking to trade forex now? Invest at eToro!
75% of retail investor accounts lose money when trading CFDs with this provider. You should consider whether you can afford to take the high risk of losing your money.
Peter Zhang
Nov 22, 2025 15:54
MATIC price prediction shows potential 11-26% upside to $0.42-0.48 by December 2025, with critical $0.58 resistance level determining bullish continuation for Polygon.
With Polygon trading at $0.38 amid mixed technical signals, the latest MATIC price prediction suggests a cautiously optimistic outlook for the leading Layer-2 scaling solution. While recent price action has been subdued, key technical levels point to potential upside in the coming weeks.
• MATIC short-term target (1 week): $0.42 (+11% upside)
• Polygon medium-term forecast (1 month): $0.42-$0.48 range (+11% to +26%)
• Key level to break for bullish continuation: $0.58 (critical resistance)
• Critical support if bearish: $0.35 (immediate) and $0.33 (strong support)
The analyst community shows a divided but generally optimistic Polygon forecast. Blockchain.News maintains the most bullish MATIC price prediction with targets of $0.45-$0.58, representing 18-53% upside potential by December 2025. This aligns with our technical analysis showing the $0.58 level as critical resistance.
Benzinga’s long-term outlook projects $0.717 by 2030, emphasizing Polygon’s fundamental value as Ethereum’s premier scaling solution. However, CoinCodex’s AI-driven models present a more conservative view, predicting a slight decline to $0.1407 – a forecast that appears disconnected from current technical realities and fundamental developments.
The consensus among credible analysts points to moderate growth potential, contingent on breaking the $0.58 resistance barrier that has capped recent rallies.
Current Polygon technical analysis reveals a market in transition. With MATIC trading at $0.38, the token sits below all major moving averages except the 7-day SMA ($0.37), indicating ongoing consolidation pressure. The price position within Bollinger Bands at 0.29 suggests MATIC is trading in the lower portion of its recent range, potentially setting up for mean reversion.
The RSI reading of 38.00 sits in neutral territory but leans toward oversold conditions, historically a favorable setup for contrarian plays. More concerning is the MACD histogram at -0.0045, showing persistent bearish momentum that needs to reverse for any meaningful rally.
Volume analysis shows moderate activity at $1.07 million on Binance spot, sufficient to support current price levels but lacking the conviction needed for a sustained breakout attempt.
The primary MATIC price target in a bullish scenario targets the $0.42-0.45 range, representing the convergence of the 20-day SMA and previous support levels. A successful reclaim of these levels would validate our Polygon forecast for continued recovery.
The ultimate bullish MATIC price target remains $0.58, marking the critical resistance that has rejected multiple rally attempts. Breaking this level with volume would signal a shift in market structure and open the door to $0.65-0.70 targets, aligning with longer-term moving averages.
Technical catalysts for upside include RSI recovery above 45, MACD histogram turning positive, and sustained trading above the middle Bollinger Band at $0.43.
Downside risks center around the $0.35 immediate support level. A decisive break below this threshold would trigger selling toward the $0.33 strong support zone, representing the recent 52-week low area.
Extended weakness could target the lower Bollinger Band at $0.31, though such a move would likely coincide with broader crypto market stress. The significant distance from the 200-day SMA at $0.69 (-45%) provides perspective on the current oversold condition.
Current levels present a measured opportunity for accumulation, particularly for traders comfortable with 4-6 week timeframes. The optimal entry strategy involves staged purchases:
Primary Entry Zone: $0.37-0.39 (current levels)
Secondary Entry: $0.35 (if support testing occurs)
Stop-Loss Level: $0.32 (below major support confluence)
Position sizing should remain conservative given the bearish MACD momentum. Consider allocating 50% of intended position size at current levels, reserving remainder for potential support tests.
Buy or sell MATIC decision ultimately depends on risk tolerance. Conservative investors should wait for clear momentum confirmation above $0.42, while aggressive traders can begin accumulation in the current range.
Our base case MATIC price prediction targets $0.42-0.48 over the next 4-6 weeks, representing 11-26% upside from current levels. This Polygon forecast carries medium confidence, supported by oversold technical conditions and analyst consensus around similar price targets.
Key confirmation signals include RSI recovery above 45, MACD histogram turning positive, and sustained trading above the $0.42 resistance zone. Failure to hold $0.35 support would invalidate the bullish thesis and suggest further consolidation.
The timeline for this prediction extends through December 2025, with initial confirmation signals expected within 7-10 trading days. Traders should monitor the critical $0.58 level, as its eventual breakout will determine whether Polygon can achieve the more ambitious targets suggested by recent analyst forecasts.
Image source: Shutterstock
Gold (XAU/USD) is trading near $4,065 per ounce, maintaining a steady range after retreating from the record high of $4,294 reached in October 2025. The metal has corrected about 5.4% over the past month as traders digest mixed signals from the Federal Reserve, a stronger dollar, and resilient U.S. yields. Despite the pullback, gold remains up over 45% year-to-date, underscoring its strength as the top-performing major asset of 2025.
Since October, gold has fallen by roughly $230 per ounce, sliding from $4,294 to $4,065 amid tightening liquidity and a temporary rebound in the U.S. dollar. The Dollar Index (DXY) climbed toward 100.5, while the 10-year Treasury yield stabilized at 4.06%, curbing speculative inflows into precious metals. The correction coincided with a sharp depreciation of emerging-market currencies, including the Indian Rupee, which hit ₹89.43 per USD — indirectly cushioning gold prices in local terms. Analysts attribute the drop to profit-taking after the record surge and the fading probability of a December rate cut, which swap markets now estimate at 40%, down from 73% two weeks ago.
Gold’s technical pattern has formed a symmetrical triangle, reflecting consolidation after the vertical rally. Support remains firm near $4,000 to $4,044, tested repeatedly during the week without a single daily close below that zone. The next support cluster lies at $3,895–$3,916, marking the level where buyers are likely to re-enter aggressively. On the upside, short-term resistance is seen around $4,145 to $4,161, followed by a critical breakout barrier at $4,250. A confirmed close above that level would open the door toward $4,380–$4,500, which aligns with the next Fibonacci projection and psychological extension target.
The 50-day moving average currently sits near $4,088, the 100-day at $3,960, and the 200-day at $3,752, keeping the medium-term trend decisively bullish. The RSI on the daily chart holds near 52, suggesting neutral momentum with a slight upward bias. As long as $4,000 holds, the broader trajectory remains constructive.
The gold market is anchored to expectations around U.S. monetary policy. New York Fed President John Williams recently signaled openness to a rate cut “in the near term,” giving short-term support to gold. However, Chicago Fed President Austan Goolsbee cautioned against early easing, warning that inflation progress has “begun to move in the wrong direction.” These conflicting statements have kept gold confined to its current $4,000–$4,150 corridor ahead of the December 9-10 FOMC meeting. A decisive dovish tilt could reignite a rally; conversely, a firm “higher for longer” message would expose gold to renewed downside pressure toward $3,900.
Underlying fundamentals remain exceptionally strong. Data from the World Gold Council show that global demand reached 1,249 tonnes in Q2 2025, up 3% year-on-year, while central banks added 166 tonnes to their reserves. Institutional investors continue to treat gold as a structural hedge against fiscal imbalance and currency debasement. The iShares Global Gold Index ETF (TSX:XGD) has gained over 100% YTD, and the Sprott Physical Gold Trust (TSX:PHYS) reported steady inflows through October despite temporary profit-taking. This reinforces that gold’s investor base is not purely speculative but strategically anchored to long-term macro hedging.
Gold miners continue to amplify the metal’s performance due to strong operational leverage. IAMGOLD (TSX:IMG), with production costs near $2,500 per ounce, has benefited disproportionately — its stock is up 135% YTD, far exceeding the 54% rise in gold prices earlier this year. Sierra Madre Gold & Silver (TSXV:SM) posted a 24% quarter-on-quarter revenue jump to $3.59 million in Q2 2025, with realized prices averaging $3,271 per ounce and cash costs at $23.32 per silver-equivalent ounce. At current gold prices above $4,000, margin expansion across miners remains significant, suggesting continued earnings strength if prices stay near current levels.
Geopolitical dynamics remain a persistent catalyst for gold. The tentative U.S.–Russia–Ukraine peace proposal temporarily reduced haven flows but failed to shift the longer-term narrative of global instability. In Asia, renewed trade friction between India and the U.S. added uncertainty, keeping gold demand steady in key consumption hubs. The Pakistan market mirrored international trends, with 24-karat gold rising $23 per ounce to $4,065, equivalent to an increase of Rs 2,300 per tola. Rising silver prices — now near $49.98 per ounce — underline a broader defensive allocation across precious metals.
Gold is consolidating within a healthy bullish channel. If $4,000 continues to hold, technical projections favor a retest of $4,250 in the coming weeks, followed by potential extension toward $4,380–$4,500 if the Fed confirms a rate-cut path. A breakdown below $3,895 would trigger short-term cooling but would not compromise the longer-term uptrend unless $3,750 is breached.
According to Ponmudi R. (Enrich Money), short-term targets range between $4,100–$4,160, while the medium-term view caps resistance near $4,210–$4,250. He emphasizes that dips below $3,970 could attract value-based buying, especially from central banks and Asian wholesalers. The Dollar Index’s resistance at 100.50 remains critical; failure to break higher would likely support renewed gold strength through December.
Gold remains a macro-hedge asset supported by central-bank demand, real-yield compression, and high geopolitical tension. The correction from $4,294 to $4,065 reflects consolidation, not exhaustion. Current data suggest accumulation is favored between $4,000 and $4,050, with stop levels just under $3,895 and upside targets between $4,250 and $4,450.
The long-term drivers — monetary debasement, fiscal deficits exceeding 120% of GDP across G7 economies, and rising production costs — continue to underpin a structural bullish outlook.
Trading News Verdict:
Gold (XAU/USD): HOLD → Bullish Bias Above $4,000 | Breakout Target $4,450
Current Price: $4,065
Support: $3,895 / $4,044
Resistance: $4,161 / $4,250 / $4,380
Record High: $4,294 (October 2025)
Central Bank Purchases: 166 tonnes (Q2 2025)
Dollar Index: 100.5 — Key Resistance
Dogecoin is looking towards $0.25 as the bullish momentum reappears and analysts reconsider the long-term outlook. In the meantime, investors are moving to Remittix, which is a payment-oriented crypto project with a 40x upside by the year 2026.
With Dogecoin’s legacy appeal and Remittix’s growing utility narrative, this split-track watchlist highlights two very different growth plays in the current market.
Dogecoin Price Prediction Builds Momentum Toward A Possible Upside Shift
Dogecoin is holding around $0.156, and although traders have sold off over weeks, they are monitoring the possibility of an early recovery. The DOGE price prediction still leans cautious, but small structural shifts are appearing as bearish momentum starts to slow. The DOGE price today reflects a cleaner base forming near $0.150, a level that historically attracts buyers during weak market phases.
According to the latest Dogecoin news https://x.com/ali_charts/status/1989393391612813759?s=20, long-term holders have reduced their heavy distribution. This has eliminated one of the main factors that pulled the Dogecoin price down in November. RSI readings are also stabilizing. This shows that momentum may be close to flipping if DOGE reclaims the $0.163 resistance.
An upward move beyond this area would allow additional momentum toward $0.186, and analysts think that it would position a medium-term move as high as $0.25 if market sentiment gets better.
This Dogecoin price prediction still requires caution, as the downtrend is not yet fully broken. Traders are closely watching whether momentum can shift before sellers regain control around $0.150. If that support holds, DOGE may finally have a shot at reclaiming higher levels after a difficult month.
Remittix Positions For A Possible 40x Run Before 2026
While analysts expect Dogecoin price prediction models to show a path toward $0.25 if momentum improves, most long-term investors are now turning their focus to Remittix. https://remittix.io RTX continues to attract serious capital because it delivers real utility instead of depending on hype or market cycles. The project is building a PayFi system that finally connects crypto to everyday financial use.
Four core strengths now drive Remittix’s rise:
● A seamless platform for crypto-to-fiat transfers across global bank accounts
● A wallet already in beta testing https://x.com/cryptoksic/status/1968046557770481915?s=20 and shaped by continuous community feedback
● Full verification by CertiK https://skynet.certik.com/projects/remittix-labs#fundamental-health and audited smart contracts
● CEX listings secured with BitMart and more large partners coming
These foundations are why analysts believe Remittix could deliver a 40x surge before 2026. The team is targeting the $19 trillion global payments sector, an area where few crypto projects have genuine reach. Adoption is accelerating, and investors see RTX as a practical tool for real money movement, not speculation.
The new referral program sweetens the momentum. Users now earn 15% back in USDT every time they refer a new buyer, claimable every 24 hours. With more exchange listings and broader payment integrations on the way, RTX continues to position itself as the standout choice https://x.com/remittix/status/1989646857090523423?s=20 for long-term growth.
Dogecoin may still fight its way toward $0.25, but Remittix is the one investors expect to dominate the next major cycle.
Token – Remittix – Dogecoin
Token type – Utility-focused PayFi token – Meme coin originally created as a joke
Core – Crypto-to-fiat payments, global transfers, real-world financial utility – Community-driven token with speculative and social sentiment value
Why Consider Now – Growing utility demand, CEX launches coming, 15% referral rewards, real-world payment traction – Potential technical rebound, DOGE price prediction shows room for recovery if momentum shifts
Long-Term Potential – Analysts forecast strong upside due to payment utility and multi-chain expansion – Long-term outlook tied to hype cycles, market mood, and speculative rallies
Frequently Asked Questions
How do I find new crypto projects early?
Follow launchpads, developer announcements, and on-chain activity trackers while monitoring crypto news platforms and community channels where early projects usually appear.
What factors influence crypto price movements?
Prices shift based on market sentiment, liquidity, regulatory updates, macroeconomic trends, and how strongly investors believe in a project’s utility and long-term demand.
Discover the future of PayFi with Remittix by checking out their project here:
Website: https://remittix.io/
Socials: https://linktr.ee/remittix
$250K Giveaway: https://gleam.io/competitions/nz84L-250000-remittix-giveaway
Disclaimer: This article is for informational purposes only and does not constitute financial advice. Cryptocurrency investments carry risk, including total loss of capital. Readers should conduct independent research and consult licensed advisors before making any financial decisions.
Crypto Press Release Distribution by https://btcpresswire.com
This release was published on openPR.
Price has spent the entire week testing the critical confluence of the 61.8% Fibonacci retracement at $4,023 and the 20-day average near $4,041. A short-term uptrend line cuts through the range, adding dynamic context to this high-density support zone.
Weekly support arrives at the rising 10-week average near $3,988, mirroring the daily 50-day average at $3,981. Both longer-term benchmarks sit only marginally below current price and remain untested since their August reclaim.
The $3,998 higher interim swing low established Tuesday stays intact so far. As long as it holds, the uptrend structure from October’s $3,886 base remains valid, bolstered by the recent 10-day/20-day bullish cross and 20-day reclaim.
Last week’s lower swing high at $4,245 and closing in the lower half of the week’s range created a potential shooting star. Validation requires a weekly close below last week’s $3,997 low, which would deliver strong bearish momentum and threaten the 50-day line. However, for active traders, an initial dip may provide a valid signal.
A weekly push above $4,133 targets last week’s high, then the $4,381 October record. Recent momentum slowdown, however, makes extended consolidation beyond this week a realistic possibility.
Gold’s inside week places the 20-day/61.8% confluence as the immediate pivot. Hold $3,998–$3,997 to protect the higher-low sequence and favor eventual continuation higher; a weekly close below $3,997 activates the shooting star and targets the untested 50-day near $3,981. Until proven otherwise, dips into this zone remain buyable in the structural bull trend.


 Price Forecast: Inside Week Tests 20-Day & 61.8% Support")