The main category of All News Articles.
You can use the search box below to find what you need.
[wd_asp id=1]
The main category of All News Articles.
You can use the search box below to find what you need.
[wd_asp id=1]
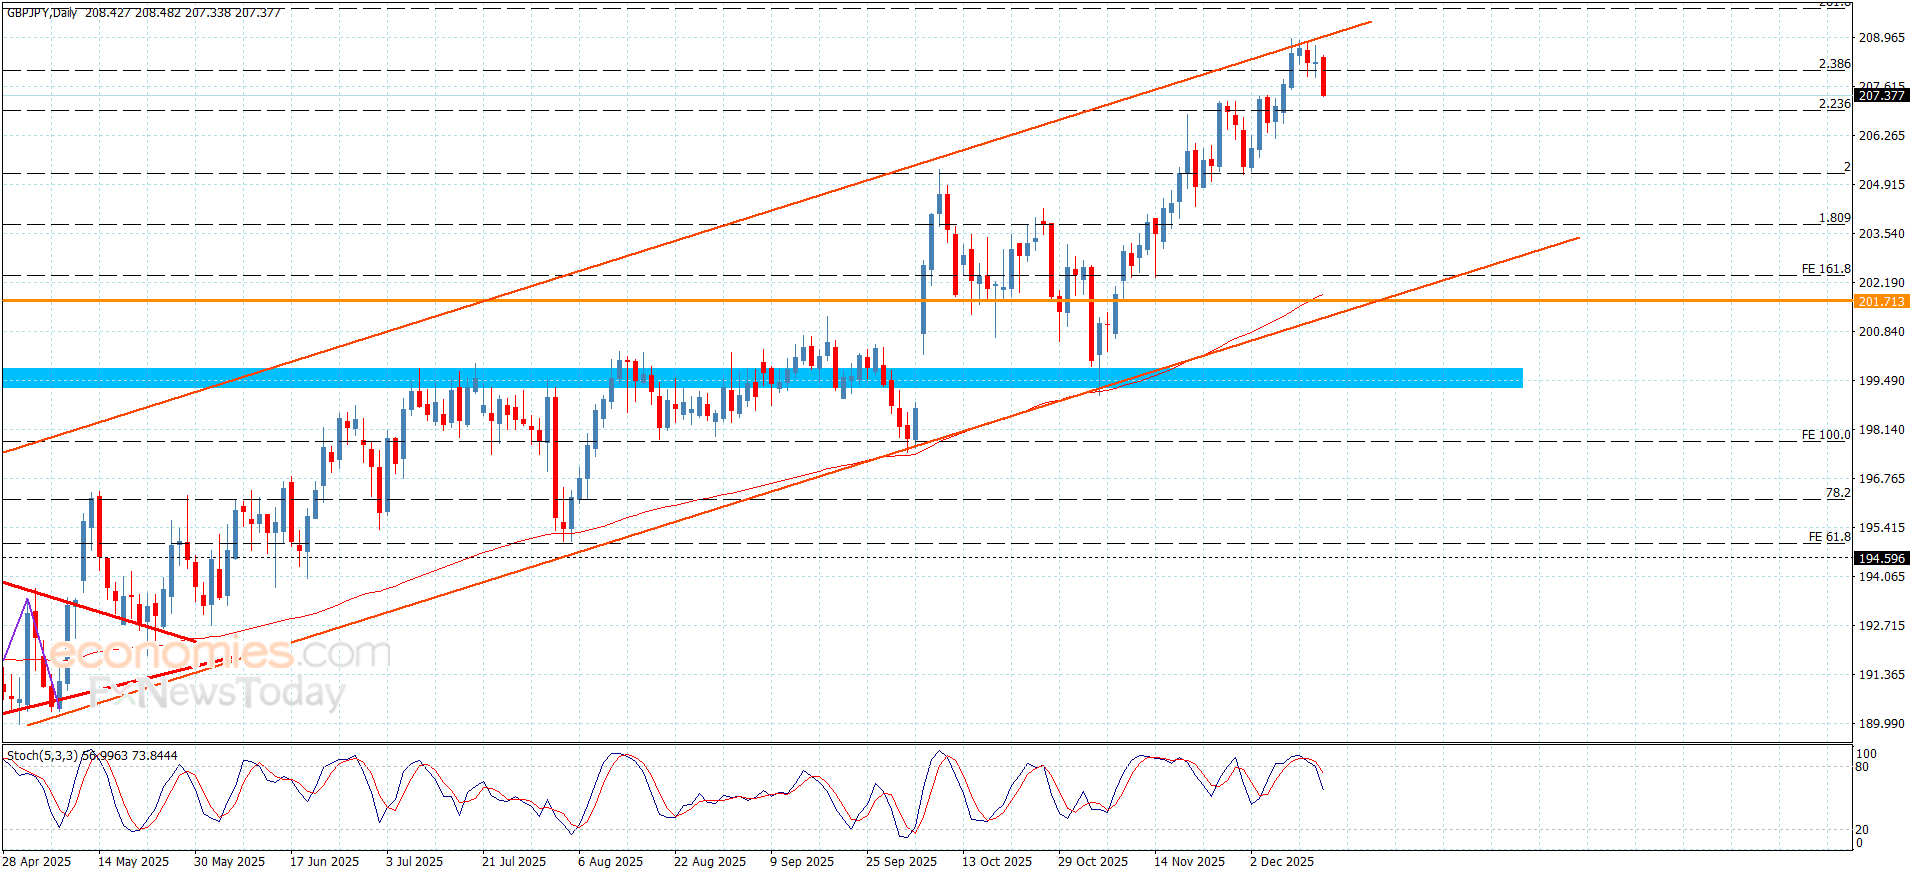
The GBPJPY pair provided a new negative close below the resistance at 208.95, to force it to activate the attempts of gathering gains, to reach 207.35 this morning, facing negative pressures by stochastic exit from the overbought level confirms the importance of reaching extra support at 206.95.
The stability above the targeted support will reinforce the chances of forming positive attempts to target 208.10 level, reaching the mentioned main resistance, while the decline below this support and providing negative close will open the way for resuming the bearish corrective attack, which might target 206.30 and 205.80 level.
The expected trading range for today is between 206.95 and 208.20
Trend forecast: Bearish
The Mexico probiotic food supplement market recorded a value of US$ 55 million in 2024 and is expected to reach a value of US$ 94.30 million in 2028, growing at a CAGR of 14.87% during the forecast period (2025-2028).
According to DataM Intelligence has published a new research report on “Mexico Probiotic Food Supplement Market Size 2025”. The report explores comprehensive and insightful Information about various key factors like Regional Growth, Segmentation, CAGR, Business Revenue Status of Top Key Players and Drivers. The purpose of this report is to provide a telescopic view of the current market size by value and volume, opportunities, and development status.
Probiotic food supplements are dietary products containing beneficial live microorganisms that help maintain or restore gut microbiota balance. In Mexico, these supplements are increasingly used to support digestive health, immunity, metabolic wellness, and overall nutrition, driven by preventive healthcare awareness and functional nutrition trends.
📌 Get a Free Sample PDF Of This Report (Get Higher Priority for Corporate Email ID):- https://datamintelligence.com/download-sample/mexico-probiotic-food-supplement-market?rk
➣ Recent Developments:
✅ In July 2025, Grupo Danone Mexico expanded its probiotic supplement portfolio beyond dairy-based formats, introducing capsule and sachet products targeting gut health and immune support for adult consumers.
✅ In June 2025, Nestlé Health Science strengthened its presence in Mexico’s nutraceutical channel by launching clinically backed probiotic blends formulated for digestive comfort and antibiotic-associated gut imbalance.
✅ In May 2025, Genomma Lab Internacional increased marketing and retail penetration of probiotic and synbiotic supplements through pharmacy chains and e-commerce platforms, addressing rising demand for digestive wellness products.
Europe: Recent Industry Developments
📌 Get Customization in the report as per your requirements: https://datamintelligence.com/customize/mexico-probiotic-food-supplement-market?rk
➣ Top Industry Players:
Pavia De Mexico, Omnilife Group, S.A. De C.V., B Life Company, Global Companies, BIOCODEX (Biocodex de México, SA de CV), Amway (Amway de México, S. de R.L. de C.V.), Herbalife International of America, Inc. (Herbalife International Of Mexico, Sa De Cv), BioGaia (BioGaia Mexico), NOW Health Group, Inc.
📌 Buy Now & Get 30% OFF – (Grab 50% OFF on 2+ reports) @: https://www.datamintelligence.com/buy-now-page?report=mexico-probiotic-food-supplement-market?rk
➣ Market Segments:
Dosage forms include tablets, capsules, liquids, powders, chewables & gumm!es, soft gels, and others, catering to diverse consumer preferences for convenience and efficacy.
Applications span gastrointestinal health subcategories like gut microbiota/microbiome balance, digestion, constipation, bloating, diarrhea, leaky gut, inflammation, immune system support, gluten sensitivity, abdominal pain, GERD/Helicobacter pylori, antibiotic-associated diarrhea/post-antibiotic treatment, gut flora/gut microbiome restoration, and others; alongside vaginal health, urinary tract health (including kidney stones, UTIs, others), oral health, anti/healthy ageing, allergies/asthma, bone & joint health (osteoarthritis, osteoporosis/low mineral bone density, inflammation), brain/mental health (sleep, cognition, mood, depression, focus), cardiovascular health (circulation), energy/fatigue reduction, metabolic syndrome/blood glucose, liver health, energy, immunity/respiratory infections, nutrient absorption, skin-hair-nails (atopic dermatitis & eczema, acne, rosacea, hair growth/hair loss, skin microbiome, others), sports, women’s health (fertility, menopause, pregnancy, PCOS, vaginal health & vaginal microbiome, vaginal infections (BV/VVC), pregnancy outcomes, others), men’s health & men’s fertility, weight management, pediatric health (colic, constipation, regurgitation, atopic dermatitis, others), and others.
📌 Have any Enquiry of This Report @ https://www.datamintelligence.com/enquiry/mexico-probiotic-food-supplement-market?rk
☛ Power your decisions with real-time competitor tracking, strategic forecasts, and global investment insights all in one place.
✅ Competitive Landscape
✅ Sustainability Impact Analysis
✅ KOL / Stakeholder Insights
✅ Unmet Needs & Positioning, Pricing & Market Access Snapshots
✅ Market Volatility & Emerging Risks Analysis
✅ Quarterly Industry Report Updated
✅ Live Market & Pricing Trends
✅ Import-Export Data Monitoring
☛ Get 2-Day Free Trial + 50% OFF DataM Subscription@ https://www.datamintelligence.com/reports-subscription?rk
Have a look at our Subscription Dashboard: https://www.youtube.com/watch?v=x5oEiqEqTWg
Contact Us –
Company Name: DataM Intelligence
Contact Person: Sai Kiran
Email: Sai.k@datamintelligence.com
Phone: +1 877 441 4866
Website: https://www.datamintelligence.com
About Us –
DataM Intelligence is a Market Research and Consulting firm that provides end-to-end business solutions to organizations from Research to Consulting. We, at DataM Intelligence, leverage our top trademark trends, insights and developments to emancipate swift and astute solutions to clients like you. We encompass a multitude of syndicate reports and customized reports with a robust methodology.
Our research database features countless statistics and in-depth analyses across a wide range of 6300+ reports in 40+ domains creating business solutions for more than 200+ companies across 50+ countries; catering to the key business research needs that influence the growth trajectory of our vast clientele.
This release was published on openPR.
Jakarta, Pintu News – The crypto market as a whole has been going through a volatile phase in recent weeks, with the meme coin sector experiencing a significant drop. Dogecoin (DOGE), as a major player in this sector, has not been spared from the pressure and has recorded major declines in recent days.
Nevertheless, despite the setback, the latest Dogecoin price predictions from market experts still show a positive outlook. In other words, analysts remain optimistic about the possible recovery of this meme coin in the near future.
So, how is the Dogecoin price moving today?
On December 15, 2025, Dogecoin experienced a 1.30% price correction over the past 24 hours, bringing its value to $0.1366 — equivalent to approximately IDR 2,274. During this period, DOGE traded within a range of IDR 2,304 to IDR 2,224.
At the time of writing, Dogecoin holds a market capitalization of around IDR 381.29 trillion, with a 24-hour trading volume of approximately IDR 16.29 trillion.
Read also: Ethereum Holds Steady Above $3,100 — Is a Breakout on the Horizon?
On December 13, the Dogecoin price saw a slight recovery, with an increase of around 3.5% to $0.14. However, during the same period, the trading volume of the meme coin dropped by more than 41%, to around $696 million.
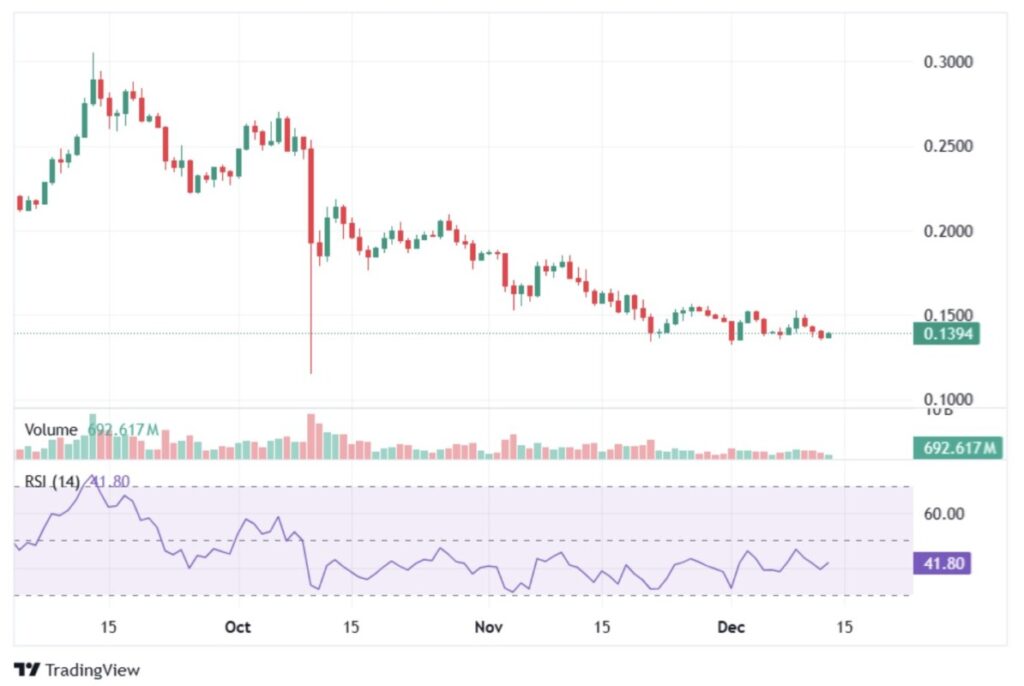
On a weekly basis, the price of DOGE has been flat with no significant change, while in the last 30 days, its value has dropped by around 19%. In the last month period, the Dogecoin price moved around a high of $0.1657 and a low of $0.1324.
Meanwhile, Dogecoin’s Relative Strength Index (RSI) indicator stands at 42, indicating that the asset is in the neutral zone. This means that the price of DOGE still has the potential to weaken again in the near future before reaching the “oversold” zone or possibly starting a recovery.
On the other hand, on-chain data shows positive sentiment starting to emerge in the market.
According to data from CoinGlass, Open Interest for Dogecoin Futures rose by almost 7% to $1.5 billion – signaling bullish sentiment from traders. Taking the on-chain data into consideration, the bullish Dogecoin price prediction gains further support.
Amidst DOGE’s ongoing price recovery, a market expert shared an optimistic Dogecoin price prediction that it could reach around $0.6. For context, the analyst by the name of Trader Tardigrade highlighted the recent movement of the DOGE price, which is considered similar to previous historical patterns.
Read also: 5 Crypto Highlighted by Analyst Ali Martinez This Week, Ready to Soar or Plummet?
Based on the past momentum of this meme coin, experts expect a potential surge in the price of DOGE towards the $0.6 level.
In addition to long-term predictions, analysts also share short-term targets for this asset. Renowned market analyst Ali Martinez recently shared a technical analysis for the Dogecoin price.
According to him, DOGE currently “appears to be moving in a triangle pattern,” which usually signals a potential breakout in the near future. In the chart he shared, Martinez marked the $0.14 level as an important resistance area for DOGE.
He also noted that if DOGE manages to break the $0.14 resistance, it could trigger a price rally towards $0.21 in the near future.
That’s the latest information about crypto. Follow us on Google News to get the latest crypto news about crypto projects and blockchain technology. Also, learn crypto from scratch with complete discussion through Pintu Academy and stay up-to-date with the latest crypto market such as bitcoin price today, xrp coin price today, dogecoin and other crypto asset prices through Pintu Market.
Enjoy an easy and secure crypto trading experience by downloading Pintu crypto app via Google Play Store or App Store now. Also, get a web trading experience with various advanced trading tools such as pro charting, various types of order types, and portfolio tracker only at Pintu Pro.
*Disclaimer
This content aims to enrich readers’ information. Pintu collects this information from various relevant sources and is not influenced by outside parties. Note that an asset’s past performance does not determine its projected future performance. Trading crypto carries high risk and volatility, always do your own research and use cold hard cash before investing. All activities of buying and selling bitcoin and other crypto asset investments are the responsibility of the reader.
Reference:
Silver (XAG/USD) attracts fresh buyers at the start of a new week and reverses a part of Friday’s retracement slide from the all-time peak, around the $64.65 region. The white metal trades above mid-$62.00s during the Asian session, up 1.25% for the day, and seems poised to prolong its recent well-established uptrend.
From a technical perspective, the XAG/USD finds decent support and bounces off the 100-hour Simple Moving Average (SMA). The subsequent move back above the $62.00 round figure validates the positive outlook. However, neutral oscillators on the 1-hour chart and a slightly overbought Relative Strength Index (RSI) on the daily chart warrant some caution for aggressive bullish traders.
This, in turn, suggests that any further move up is more likely to face some barrier near the $63.00 mark. A sustained strength beyond, however, could lift the XAG/USD towards the next relevant hurdle near the $63.80 area. Some follow-through buying beyond the $64.00 round figure will reaffirm the constructive outlook and allow bulls to challenge the record high, around the $64.65 region.
On the flip side, weakness below the $62.00 mark might still be seen as a buying opportunity near the 100-hour SMA, currently pegged near the $61.45 region. A convincing break below, however, could drag the XAG/USD below the $61.00 round figure, towards the $60.80 zone, or Friday’s swing low. The latter should act as a key pivotal point, which, if broken, should pave the way for deeper losses.
Silver is a precious metal highly traded among investors. It has been historically used as a store of value and a medium of exchange. Although less popular than Gold, traders may turn to Silver to diversify their investment portfolio, for its intrinsic value or as a potential hedge during high-inflation periods. Investors can buy physical Silver, in coins or in bars, or trade it through vehicles such as Exchange Traded Funds, which track its price on international markets.
Silver prices can move due to a wide range of factors. Geopolitical instability or fears of a deep recession can make Silver price escalate due to its safe-haven status, although to a lesser extent than Gold’s. As a yieldless asset, Silver tends to rise with lower interest rates. Its moves also depend on how the US Dollar (USD) behaves as the asset is priced in dollars (XAG/USD). A strong Dollar tends to keep the price of Silver at bay, whereas a weaker Dollar is likely to propel prices up. Other factors such as investment demand, mining supply – Silver is much more abundant than Gold – and recycling rates can also affect prices.
Silver is widely used in industry, particularly in sectors such as electronics or solar energy, as it has one of the highest electric conductivity of all metals – more than Copper and Gold. A surge in demand can increase prices, while a decline tends to lower them. Dynamics in the US, Chinese and Indian economies can also contribute to price swings: for the US and particularly China, their big industrial sectors use Silver in various processes; in India, consumers’ demand for the precious metal for jewellery also plays a key role in setting prices.
Silver prices tend to follow Gold’s moves. When Gold prices rise, Silver typically follows suit, as their status as safe-haven assets is similar. The Gold/Silver ratio, which shows the number of ounces of Silver needed to equal the value of one ounce of Gold, may help to determine the relative valuation between both metals. Some investors may consider a high ratio as an indicator that Silver is undervalued, or Gold is overvalued. On the contrary, a low ratio might suggest that Gold is undervalued relative to Silver.
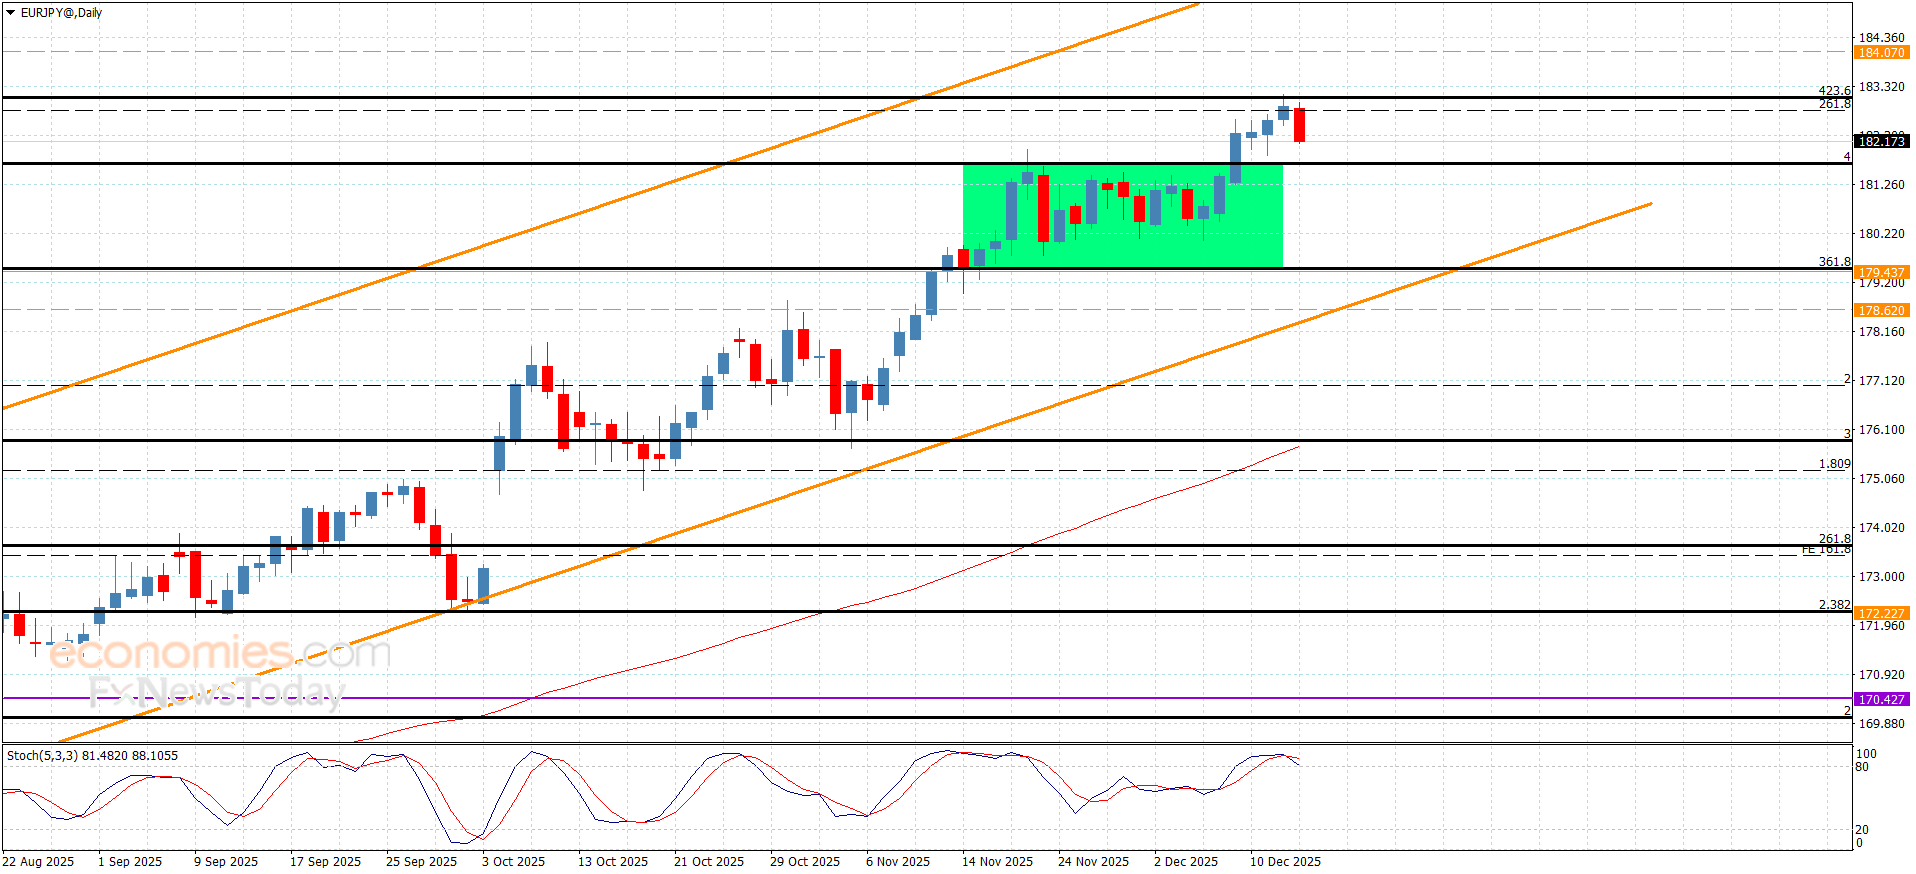
The EURJPY pair surrendered since this morning to the bearish corrective scenario, affected by the stability of the barrier near 183.30 besides stochastic exit from the overbought level, activating the attempts of gathering the gains by reaching 182.15.
Renewing the corrective attempts to test the extra support at 181.70, attempting to gather the positive momentum to form bullish waves and recover the current losses by its rally towards 182.80,
Waiting to breach the barrier to open the way for recording new gains that might extend towards 183.50 reaching the next main target at 184.10 in the near sessions.
The expected trading range for today is between 181.70 and 182.70
Trend forecast: Fluctuated within the bullish trend
High cholesterol and triglycerides do not show symptoms, yet they quietly raise your risk of heart disease, stroke, and clogged arteries. And while medication, exercise, and diet are essential, most people do not realize that certain everyday drinks can also support healthier lipid levels. Yes, certain healthy drinks can improve fat metabolism, reduce inflammation, and help your arteries stay clear. Many of these drinks come from common kitchen ingredients and offer so many essential nutrients. From teas rich in antioxidants to fiber-dense beverages that bind cholesterol, give these drinks a try to manage cholesterol and triglyceride levels.
Cholesterol is a waxy, fat-like substance your body uses to build cells and produce hormones. It becomes harmful only when LDL (bad cholesterol) increases and starts clogging your arteries. “Triglycerides, on the other hand, are the fats your body stores for energy. When their levels rise, often due to sugary foods, excess calories, or inactivity, they thicken the blood and raise your risk of heart disease,” Dr Satish L, Consultant Cardiologist at SPARSH Hospital, tells Health Shots. Keeping both in check is essential for a healthy heart.
Green tea is one of the most heart-friendly drinks. It is rich in catechins, powerful antioxidants that help reduce LDL (bad cholesterol) while easing inflammation in the arteries. Dr Satish L says 1–2 cups a day can support better lipid balance. A study in the Nutrition Journal found that green tea extract significantly lowered total and LDL cholesterol in adults.
Hibiscus tea works like a natural heart tonic. Its antioxidants help keep arteries flexible, reduce oxidative stress, and support stable blood pressure. Regular intake may help regulate cholesterol levels and keep your heart healthy.
Oat drinks are high in beta-glucan, a soluble fiber that forms a gel-like texture in the gut. This fiber binds cholesterol and prevents its absorption. A study in the International Journal of Molecular Medicine confirms that beta-glucans help lower LDL and triglycerides by interacting with bile salts and improving digestion.
Flaxseeds are loaded with omega-3 fatty acids that help control overall lipid levels. They also reduce inflammation inside the arteries. For maximum benefit, Dr Satish L suggests consuming freshly blended flaxseed water or adding powdered flaxseed to smoothies.
Garlic contains allicin, a natural compound known for reducing plaque buildup and lowering LDL cholesterol. Many people prefer consuming garlic water on an empty stomach to support better cardiovascular health. Regular use may help maintain cleaner arteries.
Fenugreek seeds are rich in soluble fiber, which lowers the absorption of fat and sugar in the bloodstream. Drinking soaked fenugreek water may help reduce both cholesterol and triglycerides, especially when combined with dietary changes.
Beetroot is high in nitrates that convert into nitric oxide, improving blood flow and reducing arterial stiffness. A study in the Medical Laboratory Journal found that beetroot juice significantly lowered triglycerides, total cholesterol, and LDL levels compared with placebo.
Lemon water is rich in vitamin C, an antioxidant that helps improve fat metabolism. It supports liver function, an organ crucial for cholesterol processing. It is an easy drink to add to your morning routine.
Amla juice is known for its strong antioxidant properties. A study in Current Science shows that amla helps lower LDL while boosting HDL (good cholesterol). Its polyphenols support healthier arteries and better heart function. Dr Satish L notes that including amla juice regularly can enhance overall lipid control.
(Note to readers: This article is for informational purposes only and not a substitute for professional medical advice. Always seek the advice of your doctor with any questions about a medical condition.)
Cardano price is stabilizing near a key multi-year support zone, with the market watching closely to see whether this area sparks a base formation or leads to the next major directional move.
Cardano price is attempting to recover after an extended corrective phase that has dragged price back towards levels last seen during prior accumulation cycles. Following weeks of steady downside pressure, ADA is now trading near $0.41, an area that several analysts view as structurally important rather than a breakdown zone.
Brave New Coin data shows ADA trading just above the $0.41 handle, with intraday volatility easing after a sharp late-session rebound. While momentum remains muted, the ability to hold this region has shifted attention towards whether Cardano is beginning to form a base or merely pausing before its next directional move.
Cardano price is trading around $0.41, up 0.17% in the last 24 hours. Source: Brave New Coin
A widely followed chart from Ssebi highlights that Cardano price is currently sitting directly on a multi-year ascending trendline that has defined its broader market structure since early cycle lows. This diagonal support has historically acted as a pivot point between prolonged drawdowns and sustained recovery phases.
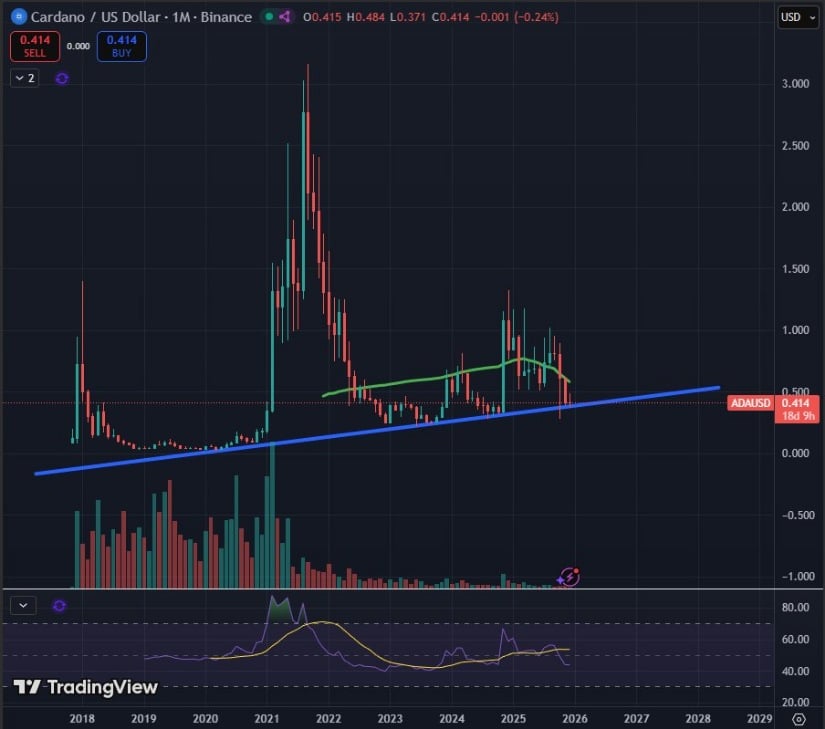
Cardano price is testing a multi-year ascending trendline, a level that has historically marked the transition between prolonged corrections and sustained recovery phases. Source: Ssebi via X
According to Ssebi, ADA “is holding the multi-year trendline so far,” emphasizing that a strong reaction from this level is required to trigger a meaningful reversal narrative. The chart shows price compressing along this long-term support rather than breaking cleanly below it.
From a structural perspective, this places ADA in a high-importance decision zone, where sustained holding increases the probability of a broader trend shift, while failure would expose deeper historical liquidity pockets.
Adding a shorter-term perspective, Ali Martinez pointed out that the TD Sequential indicator recently flashed a buy signal on Cardano, suggesting downside momentum may be nearing exhaustion.
Martinez’s chart outlines $0.37 as the critical level that must continue to hold. As long as ADA Cardano price remains above this support, his model opens a projected recovery path towards the $0.54 region, which aligns with prior reaction highs and mid-range resistance from earlier this year.
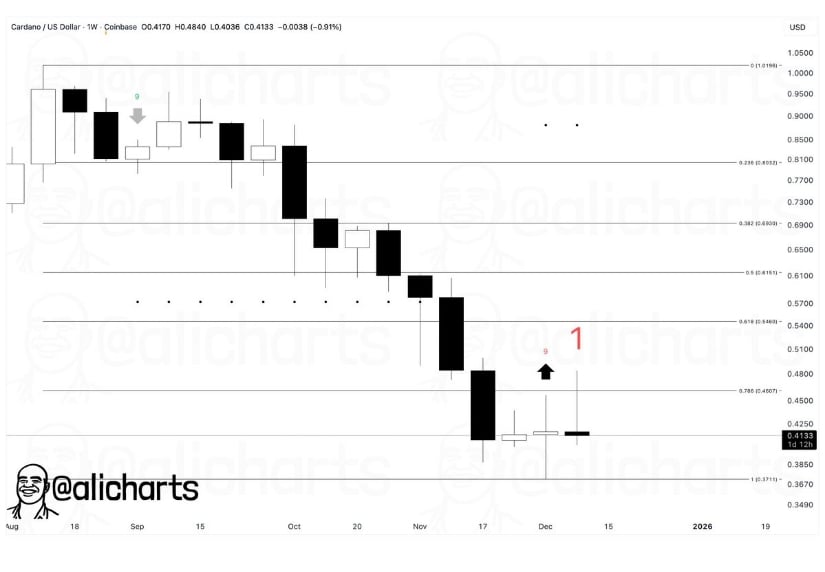
A TD Sequential buy signal has appeared on Cardano, with $0.37 highlighted as the key support that could pave the way for a recovery towards the $0.54 resistance zone. Source: Ali Martinez via X
While TD signals are not guarantees, they often appear near local inflection points, particularly when price is already pressing into historically defended zones. In this context, the signal strengthens the argument that ADA’s current position is more consistent with late-stage selling pressure rather than the start of a fresh breakdown.
From a structure-based outlook, Nehal shared a daily chart showing Cardano price trading inside a well-defined falling channel that has governed price action for several months. The chart focuses on the potential for a channel breakout, which historically increases the probability of a multi-week recovery move.
Nehal’s projected path suggests that if ADA can reclaim the upper boundary of the channel, price could gradually rotate back towards the $0.60–$0.68 zone, where prior volume clusters and resistance shelves reside. This scenario depends on ADA maintaining current support and building higher lows rather than expanding volatility to the downside.
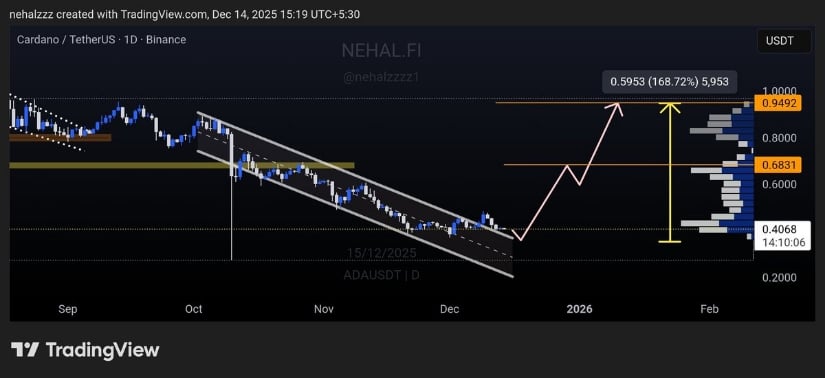
ADA remains confined within a falling channel, with a potential breakout above the upper trendline opening a measured recovery path towards the $0.60–$0.68 resistance zone. Source: Nehal via X
Broader market context is also beginning to favor selective altcoin setups. A recent snapshot shared by Coin Bureau showed Cardano price among assets posting notable volume expansion, even as price action across majors remained mixed.
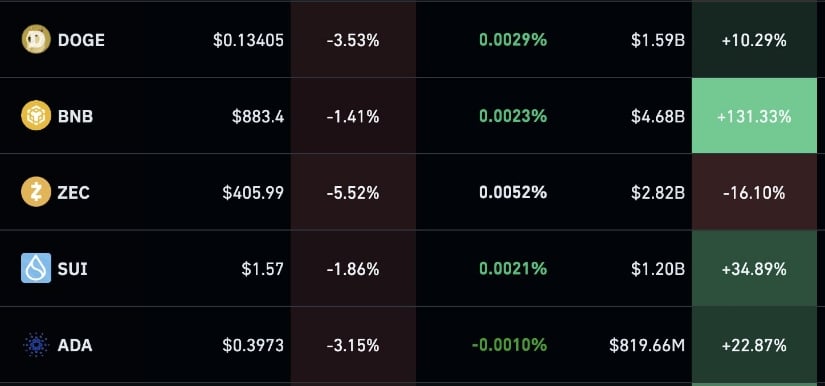
ADA is seeing rising volume during consolidation, a sign of renewed trader interest that often precedes directional expansion when supported by strong historical levels. Source: Coin Bureau via X
While this does not imply an immediate breakout, increasing participation during consolidation phases often precedes directional expansion, particularly when paired with strong historical support levels. For ADA, this reinforces the view that sellers may be losing control, even if buyers have not yet asserted dominance.
From a price prediction standpoint, Cardano price remains range-bound but structurally interesting. As long as $0.37–$0.40 continues to hold, the probability of a recovery towards $0.50–$0.54 remains intact, supported by TD signals, long-term trendline defense, and improving structural alignment across multiple models.
A confirmed break above $0.45 would strengthen the bullish case, opening the door towards higher resistance zones highlighted by Nehal’s channel projections. On the flip side, a decisive loss of the multi-year trendline would invalidate this recovery narrative and shift focus towards deeper levels.
For now, Cardano price prediction models point towards stabilization first, expansion second, with the current zone shaping up as one of the most important areas ADA has traded in over recent months.
Gold (XAU/USD) attracts buyers for the fifth straight day and climbs to the $4,330 region during the Asian session on Monday. The commodity remains well within striking distance of its highest level since October 21, touched on Friday, and seems poised to appreciate further amid a supportive fundamental backdrop. Traders, however, might opt to wait for this week’s important US macro releases, which would shape expectations about the Federal Reserve’s (Fed) rate-cut path and drive demand for the non-yielding yellow metal.
The delayed US Nonfarm Payrolls (NFP) report for October and Retail Sales are scheduled for release on Tuesday, along with the provisional manufacturing and services PMIs. This will be followed by the US consumer inflation figures on Thursday. Apart from this, speeches from influential FOMC members will determine the near-term trajectory for the US Dollar (USD). Investors this week will further take cues from the Bank of England (BoE) rate decision and the European Central Bank (ECB) meeting on Thursday, and the Bank of Japan (BoJ) policy update on Friday. This should provide a fresh directional impetus to the Gold price.
In the meantime, dovish US Federal Reserve (Fed) expectations fail to assist the USD to register any meaningful recovery from a two-month low, touched last Thursday, and continue to underpin the yellow metal. In a widely expected move, the US central bank lowered borrowing costs by 25 basis points (bps) at the end of a two-day policy meeting last Wednesday and projected one more rate cut in 2026. Investors, however, remain hopeful about two more rate cuts next year in the wake of Fed Chair Jerome Powell’s remarks, saying that the central bank does not want its policy to push down on job creation amid downside risks to the labor market.
Meanwhile, US President Donald Trump said last Friday that he was leaning toward choosing either former Fed Governor Kevin Warsh or National Economic Council Director Kevin Hassett to lead the US central bank next year. Market participants seem convinced that the new Trump-aligned Fed chair will be an uber-dovish and slash interest rates regardless of the economic fundamentals. This has been another factor behind the recent USD decline and suggests that the path of least resistance for the Gold price remains to the upside. Moreover, the emergence of dip-buying at the start of a new week and acceptance above the $4,300 mark validate the positive outlook.
Last week’s breakout through the $4,245-4,255 supply zone was seen as a key trigger for the XAU/USD bulls. Moreover, short-term moving averages slope higher, keeping the intraday bias pointing north. The broader setup remains supportive as dips attract demand around dynamic supports. The Moving Average Convergence Divergence (MACD) histogram stays positive but has been contracting from recent peaks, suggesting fading bullish momentum; the MACD line holds above the Signal line and above the zero line. RSI (14) prints 68 (near overbought), easing from earlier extremes and hinting that upside could be capped until momentum resets.
If buyers reassert control and the MACD histogram re-expands, the advance could extend towards retesting the all-time peak, while a further contraction accompanied by an RSI roll-over from the high-60s would favor consolidation. A sustained hold above rising short-term moving averages would preserve the bullish tone, whereas a close beneath these dynamic supports would open the door to a deeper pullback. Overall, momentum remains positive but stretched, which could translate into choppy trade before a decisive break emerges.
(The technical analysis of this story was written with the help of an AI tool)
XRP price prediction has hit a critical point where technical warning signals are battling with increased institutional demand.
While new spot XRP ETFs are continuing to attract capital, the price structure shows growing downside pressure.
As a result, XRP price prediction is now conditional on whether historical risk patterns override long-term accumulation trends.
XRP price prediction turned cautious on the three-day EMA ribbon structure. A chart by Steph is Crypto highlighted a repeating historical pattern linked to this indicator.
Every time the EMA ribbon flipped bearish and price was below it, extended drawdowns followed it.
These moves were short-lived corrections. Instead, they turned into multi-month downtrends of 27-66% losses.
Notably, bigger declines occurred when the EMA ribbon was bearish for longer periods of time. Past examples in 2014, 2017, 2019 and 2022 show no exceptions to this pattern.
Each cycle was the same: breakdown, consolidation and delayed recovery. This consistency gives weight to the current warning signal.
At this time, XRP keeps trading below the EMA ribbon. This positioning has downside risk active in the near-term. Until price recovers the ribbon, XRP price prediction remains structurally fragile.
Despite technical pressure, XRP price prediction gets better when institutional activity is taken into consideration.
Spot XRP ETFs have offered a regulated way forward for big money to gain exposure. This shift has changed the way that XRP is perceived within traditional finance.
ETF inflows are hitting the $1 billion mark in a short time. This pace is faster than early adoption rates observed in several of the big crypto ETFs.
As a result, XRP is beginning to be regarded as a legitimate market asset more and more. Daily ETF purchases continuously pull XRP out of the exchange circulation.
This process tightens available supply over time. Notably, a lower supply base often compounds the effect of price reaction when demand picks up.
Regulatory clarity reinforced this trend further. Clear legal outcomes demystified for institutional investors. As a result, XRP now fits more easily into conventional portfolio strategies.
There’s the added benefit of Ripple’s growing involvement in cross-border payments lending fundamental support to it.
There is real-world utility, that means there is demand beyond speculative trading. Together, these factors make the XRP price prediction outlook much better for the long-term.
XRP price prediction is still cautious when analyzing short-term trends. As per the data on CoinStats, XRP has declined by about 1.35% in the last session. Price is now closer to support than resistance on intraday charts.
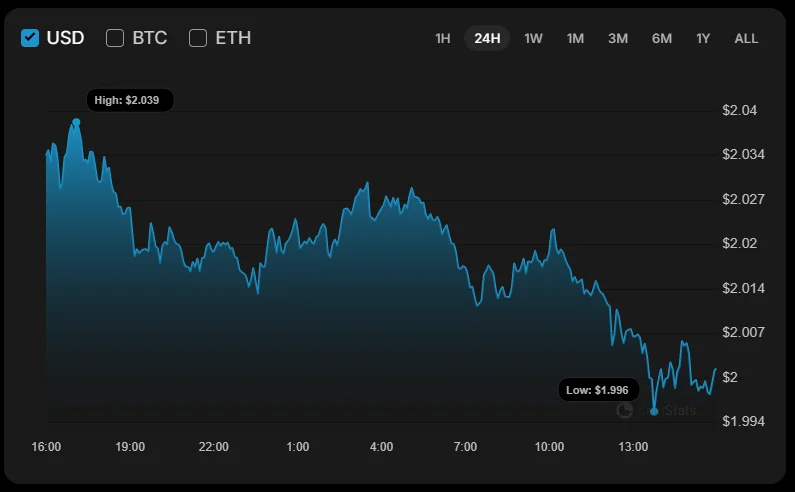
In the hourly time frame, the buyers have really struggled to gain back momentum. If this weakness continues, there is likely to be a breakdown toward the $1.98 level.
That area is the closest short-term support objective. The daily chart shows much more importance on the $2.00 level.
This is the psychological and structural threshold area. A strong loss could hasten downside pressure.
Therefore, this support is vital for the following weeks. Failure to hold it could run the current decline into the month-end. Near-term XRP price prediction remains defensive.