The main category of All News Articles.
You can use the search box below to find what you need.
[wd_asp id=1]
The main category of All News Articles.
You can use the search box below to find what you need.
[wd_asp id=1]
BNBUSD is currently priced at $877.54, reflecting a slight decline of 0.95% today. As the market navigates a high low of $899.94 and a low of $870.35, investors are curious about upcoming price movements. Let’s dive deeper into BNBUSD’s technical indicators and forecasted targets.
BNBUSD opened at $897.33 but dropped to $877.54, marking a decrease of $8.46 or 0.95% by the end of the trading session. With a market cap of $127.98 billion and daily trading volume of 1.64 billion, BNBUSD is navigating through recent volatility. The price hovers near its 200-day average of $865.27, indicating a critical support level.
BNBUSD’s Relative Strength Index (RSI) stands at 43.13, suggesting potential room for upward movement. The Moving Average Convergence Divergence (MACD) is at -24.89, with a histogram of 7.12, pointing to possible bullish momentum. Additionally, the Average Directional Index (ADX) is 36.35, indicating a strong trend. Bollinger Bands show a middle level of $884.99, indicating current price proximity to average market activity.
Based on Meyka AI insights, BNBUSD is projected to reach $912.17 in the next quarter. Monthly forecasts suggest a dip to $818.3, whereas long-term prospects for five years estimate a potential surge to $986.04. These targets rely heavily on current market trajectories and technical data. Forecasts can change due to macroeconomic shifts, regulations, or unexpected events affecting the crypto market.
BNBUSD shows a relative volume of 0.89, slightly below average, possibly limiting large-scale movement. The Money Flow Index (MFI) is 46.27, near the neutral zone, hinting at balanced buying and selling pressure. As Meyka AI suggests, understanding these dynamics is crucial for anticipating future price trends.
BNBUSD’s current position highlights a blend of challenges and opportunities. With technical indicators pointing to potential growth, the path to a $912.17 target seems promising. Investors should keep an eye on key support levels and market dynamics as conditions evolve.
BNBUSD is currently priced at $877.54, reflecting a 0.95% decrease today from its previous close of $886.00.
Formula or reference: Previous Close: $886.00; Current Price: $877.54
The RSI is at 43.13, suggesting there’s room for upward movement, and the MACD presents a slight bullish pressure with a histogram of 7.12.
Formula or reference: RSI: 43.13; MACD histogram: 7.12
The forecast suggests BNBUSD could reach $912.17 in the next quarter, based on current trends and technical analysis.
Formula or reference: Quarterly forecast: $912.17
BNBUSD’s current price of $877.54 is below its 50-day average of $953.02, indicating a potential undervaluation.
Formula or reference: Price Avg 50: $953.02; Current Price: $877.54
Year-to-date, BNBUSD has increased by 39.21%, showcasing significant growth over the past 12 months.
Formula or reference: YTD change: 39.21%
Degree or extent: Significant growth
Disclaimer:
Cryptocurrency markets are highly volatile. This content is for informational purposes only.
The Forecast Prediction Model is provided for informational purposes only and should not be considered financial advice.
Meyka AI PTY LTD provides market data and sentiment analysis, not financial advice.
Always do your own research and consider consulting a licensed financial advisor before making investment decisions.
Could December 5 finally be the day Treasure NFT Withdrawal fully resumes? This is the biggest question among users after the platform missed its earlier promise of reopening withdrawals on December 1, 2025. With the official confirmation of a BlackRock-linked strategic capital cooperation and the TreasureNFT funding round beginning, the community is now watching the next steps closely.
Treasure Fun, a Web3 revenue platform powered by NFT collections and AI-driven algorithmic trading, is entering a crucial phase. The platform’s dual earnings system—trading rewards and referral rewards—had attracted rapid global growth, but withdrawal delays raised concerns. Now the company claims it is ready for a major rebound.
The latest update on Treasure NFT confirms that the first funding round has officially begun, marking the platform’s biggest step toward restoring full operations.
Source: X
On December 1, 2025, TreasureNFT inked a cooperation agreement with the international strategic capital division under BlackRock. As officials inform, the first capital injection has already started, while these funds are going to be used to:
Stabilize operations on the platform
Protecting user assets
Process pending withdrawals
Support global ecosystem recovery
The team explained that the requested processing will be prioritized with early-login users, especially those who were affected by the login downtime.
To manage the huge volume of support requests, TreasureNFT introduced a Level-based reporting system. Only users unable to log in are required to submit their UID, Full name, and Level.
These details must be submitted only through Level 4 and above leaders. The platform has clearly stated that customer service will not reply to individual messages, a move aimed at streamlining verification. Users who can access their accounts are instructed to log in immediately and complete verification so their:
The platform had promised a return to normal operations on December 1, but the date passed without full withdrawal restoration. Now, officials say the new expected withdrawal date is December 5, aligning with the finalization of the first funding round and account-verification cleanup.
This raises the central question: Is Dec 5 the final date for Treasure NFT Withdrawal?
Based on current announcements, the funding round is underway, user data is being re-verified, and backend systems are being upgraded. These steps strongly indicate that Dec 5 is positioned as the realistic restoration date, though users remain cautious given past delays.
As the Treasure NFT Fun withdrawal time approaches the new December 5 target, the platform stands at a defining crossroads. The BlackRock-backed funding round, tightened verification process, and early-login prioritization suggest real progress—but users will judge success only when the process actually resume. For now, Dec 5 is the day the entire community is waiting for.
Disclaimer: This is for educational purposes only. Always do your own research before any crypto investment.
Anglo American plc stock (LSE: AAL, ticker often shown as AAL.L) is trading in a market that’s trying to price two big things at once: a copper-heavy future shaped by a transformational merger with Teck Resources, and the very real execution risk that comes with mega-deals, regulatory scrutiny, and operational bottlenecks.
In London trading on 15 December 2025, Anglo American shares hovered around the mid‑2,800p level (roughly £28–£29 per share), after a volatile stretch that included a sharp drop late last week. [1]
After a strong run earlier in 2025, Anglo American shares have recently been choppy. Financial market data for Monday, 15 December 2025 shows the stock closing around 2,837.9p. [6]
On a total-return basis (including dividends), Anglo American’s year-to-date performance has remained positive in 2025, underscoring that investors have largely rewarded the company’s strategic pivot—despite the turbulence around corporate actions. [7]
Why the volatility? In plain terms: when a company proposes a deal that can redefine its commodity exposure and geographic footprint, the market tends to swing between “this is brilliant” and “this is going to be a regulatory and operational headache.”
Anglo American and Teck Resources shareholders have approved a $53 billion, all‑stock, nil‑premium merger that would create a combined company widely described as Anglo‑Teck / Anglo Teck. [8]
Key deal headlines investors are using to value the upside include:
Teck has secured a final order from the Supreme Court of British Columbia approving the plan of arrangement for the merger—an important procedural step that reduces uncertainty around the transaction’s legal pathway. [12]
The market’s focus now shifts to regulators—including Canadian “net benefit” considerations and competition reviews in multiple jurisdictions (with copper’s “critical mineral” status adding a political layer). Reuters has described regulatory approvals as the final major hurdle following the shareholder votes. [13]
Stock implication: until the regulatory timeline becomes clearer, Anglo American shares may trade with a “deal overhang”—where good news helps, but uncertainty caps near-term enthusiasm.
The strategic logic of the merger—and much of the bull case for Anglo American stock—rests on copper.
Reuters reporting this month described copper moving close to $12,000 per metric ton, driven by strong demand (including AI-powered data centers) and tight supply. Reuters also cited expectations for copper market deficits—124,000 tons in 2025 and 150,000 tons in 2026—illustrating why miners with scalable copper exposure are being re-rated. [14]
An outlook report from ING similarly highlights a structurally bullish copper narrative tied to grids, electrification, renewables, and—increasingly—data centers and AI infrastructure. [15]
One of the most repeated industrial logics behind the merger is the possibility of optimizing value from adjacent copper assets in Chile—Teck’s Quebrada Blanca and Anglo’s Collahuasi—via operational coordination. [16]
Stock implication: if investors become more confident that copper stays tight into 2026 and beyond, Anglo American’s copper-heavy trajectory can support higher valuation multiples. But that confidence hinges on output reliability and execution.
The copper thesis is powerful, but miners don’t get paid on PowerPoint—they get paid on tonnes shipped.
Reuters reported that Chilean authorities raised concerns in 2025 about a large crack and water leaks at Teck’s Quebrada Blanca tailings facility, with criticism around reporting speed and ongoing scrutiny. [17]
This matters for Anglo American stock because markets tend to discount “synergies” when there’s a risk that the underlying assets can’t consistently deliver planned volumes.
A market note carried by MarketScreener argued that, even after shareholder approval, translating copper growth ambitions into reality looks challenging, and that uncertainty around restructuring/disposals can limit near-term upside for the shares. [18]
Stock implication: the more the market believes the merger is “hard but doable,” the more Anglo American stock can trade on copper upside and synergy targets. The more the market believes it’s “hard and messy,” the more the stock may be range-bound until milestones are cleared.
Anglo American’s equity story in late 2025 isn’t just “buy copper.” It’s also “sell what doesn’t fit.”
A Reuters report today (15 December 2025) on South Africa’s balance-of-payments data cited Anglo American’s sale of its remaining stake in Valterra Platinum as a driver behind a sharp decline in South Africa’s recorded foreign direct investment outflows in Q3. [19]
While that Reuters item is written as a macro story, equity investors read it as a reminder that Anglo’s simplification program continues to have real financial flows attached to it.
Industry reporting today notes that Anglo American is in the process of selling its 85% stake in De Beers, while Botswana has expressed interest in increasing its ownership (it currently holds 15%). [20]
Separately, reporting in 2025 has pointed to other interested parties, including Angola’s state diamond company pursuing a bid for Anglo’s majority stake. [21]
Stock implication: any credible steps toward a De Beers transaction—price, structure, timeline, or political conditions—can move Anglo American stock quickly, because it affects both cash flow expectations and the clarity of the “new Anglo” portfolio.
Even when shareholders like the strategic direction, they often dislike paying executives extra for doing the job they were hired to do.
Reuters reported that Anglo American withdrew a proposed change to executive bonus awards ahead of the Teck merger vote after investors raised concerns. [22]
UK media coverage also highlighted investor backlash around the size and structure of proposed transaction-linked bonuses. [23]
Stock implication: this isn’t just “corporate drama.” In mega-deals, governance fights can affect investor trust and—at the margin—the shareholder base willing to underwrite risk through a long regulatory process.
Analyst targets and ratings vary widely, which is usually a sign that the market is trying to price a genuinely uncertain path—rather than merely arguing over short-term commodity noise.
That spread basically maps to two competing narratives:
Markets typically reprice deal probability in chunks—when an agency opens a formal review, asks for remedies, or grants clearance.
With copper already up sharply in 2025, incremental upside may depend on whether deficits deepen and whether demand linked to electrification and data centers continues to surprise to the upside. [26]
Any firm timeline, shortlist, or binding agreement around De Beers could be a major valuation event. [27]
Anglo American’s investor calendar shows two key upcoming dates:
Anglo American plc stock is in a classic “strategic transition” phase: it’s being valued less as a diversified legacy miner and more as a future-facing copper platform—especially with the Anglo‑Teck deal moving through major checkpoints.
The opportunity is real: copper fundamentals have strengthened, and the merger’s synergy targets are meaningful on paper. [29]
The risk is equally real: regulators can slow everything down, and operational constraints (especially in Chile) can quickly turn a copper growth story into a confidence problem. [30]
1. markets.ft.com, 2. www.reuters.com, 3. www.reuters.com, 4. www.reuters.com, 5. www.marketbeat.com, 6. markets.ft.com, 7. finance.yahoo.com, 8. www.reuters.com, 9. www.reuters.com, 10. www.angloamerican.com, 11. www.ft.com, 12. www.teck.com, 13. www.reuters.com, 14. www.reuters.com, 15. think.ing.com, 16. www.reuters.com, 17. www.reuters.com, 18. www.marketscreener.com, 19. www.reuters.com, 20. rapaport.com, 21. www.bloomberg.com, 22. www.reuters.com, 23. www.theguardian.com, 24. www.marketbeat.com, 25. valueinvesting.io, 26. www.reuters.com, 27. rapaport.com, 28. www.angloamerican.com, 29. www.reuters.com, 30. www.reuters.com
– Written by
Frank Davies
STORY LINK Euro to Dollar Forecast: EUR/USD Near 1.18 as Fed Uncertainty Dominates
The Euro to US Dollar exchange rate (EUR/USD) jumped to two-month highs above 1.1750 after the Federal Reserve delivered a widely expected rate cut but revealed deeper internal divisions.
Markets read the split vote and Powell’s data-dependent tone as a negative for the dollar, keeping the euro supported. Attention now turns to the Fed’s 2026 path and uncertainty over Powell’s successor.
Scotiabank forecasts Euro to Dollar (EUR/USD) exchange rate gains to 1.22 by the end of 2026 with a further advance to 1.24 the following year.
SocGen does see scope for EUR/USD gains to 1.20 early next year, but forecasts a steady retreat to 1.14 at the end of 2026.
EUR/USD jumped to 2-month highs above 1.1750 after the Federal Reserve policy decision before consolidating.
The Fed cut interest rates by a further 25 basis points to 3.75% at the latest policy meeting, in line with strong consensus forecasts, but divisions intensified.
Get better rates and lower fees on your next international money transfer.
Compare TorFX with top UK banks in seconds and see how much you could save.
There were three dissents against the decision with Schmid and Goolsbee wanting to leave rates on hold while Miran called for a 50 basis-point cut.
Chair Powell emphasised the difficulty in policymaking with higher inflation and weaker employment. He insisted that policy would be data dependent.
According to the latest updates, the median projection is for one further cut in 2026, although there was a wide divergence in forecasts.
Fed policy will remain a key element next year with Chair Powell’s term ending in May and there is a high degree of uncertainty.
Scotiabank commented; “The search for Powell’s successor remains another key risk for the USD, as the current top contender for the role is the dovish-leaning Hassett. Powell’s term (as Chair) officially ends in May, but President Trump has suggested that he could announce his choice as soon as January—setting off a sequence of events that would add significant pressure to the USD into the confirmation and arrival of a new Fed Chair.”
Scotiabank also sees scope for a relatively hawkish ECB stance which would underpin the Euro; “Policymakers had been offering subtle hints over the past few weeks, signaling concerns about upside risks to inflation within the context of an overall balanced outlook.”
Mizuho has an end-2026 EUR/USD forecast of 1.22 and noted; “Fed cuts, German fiscal spending and higher levels of USD FX hedging will lead to a 2017 analogue playing out in 2025/26 but it’s hard to go further than that.”

SocGen also postulated historical comparisons, but does not see a happy ending for the Euro; “There are echoes here of 2020/21 and 2016/17. In both cases, hope that Euro-Zone growth prospects would improve, and monetary policy normalise contrasted with fears that the US economy would suffer a longer-term hangover. In both cases, EUR/USD made it above 1.20, but never got near 1.30 and before long was falling again.”
It added; “over the next few years, unless European economic policy becomes more growth-orientated, a return to the EUR/USD post-2024 average and occasional spikes below 1.10 look depressingly likely.”
International Money Transfer? Ask our resident FX expert a money transfer question or try John’s new, free, no-obligation personal service! ,where he helps every step of the way,
ensuring you get the best exchange rates on your currency requirements.
TAGS: Euro Dollar Forecasts
Made from green tea leaves roasted over high heat, hojicha has a warm, toasty aroma and very little bitterness — qualities that pair naturally with cream and butter in desserts. Unlike matcha, which is finely ground and prized for its vivid green color and deep umami, hojicha is brewed from roasted leaves and offers a gentler, lower-caffeine profile.
Even long-established specialty shops that once fueled the matcha boom are now adding hojicha parfaits and other sweets to their regular lineups. Among inbound visitors to Japan, hojicha is also beginning to take hold as a symbol of Japanese tea.
Founded in 1854, Nakamura Tokichi Honten is a historic tea merchant based in Uji, Kyoto. At its locations, including a shop in Tokyo’s Ginza district, it serves the hojicha-flavored “Maruto Parfait” (¥2,180 JPY, around $14 USD), a dessert designed to showcase the tea’s range of aromas and flavors. The chiffon cake is light and delicately fragrant, while the jelly releases a clean, lingering aroma reminiscent of freshly brewed hojicha.
The parfait is topped with lightly sweetened whipped cream. As the spoon moves deeper into the glass, it reveals layers of hojicha chiffon cake, candied chestnuts, sweet-tart berries, puffed rice, and premium Dainagon azuki beans, before finishing with a smooth hojicha jelly at the bottom.
Yui Fukamatsu, manager of Nakamura Tokichi Honten’s Ginza store, says the parfait is meant to capture the essence of hojicha while allowing the quality of each ingredient to stand out. Its refined appearance has gone viral on social media, and on busy days customers may wait more than an hour around lunchtime.
More than half of the shop’s customers are inbound visitors. While matcha has enjoyed explosive popularity overseas for several years, Fukamatsu notes that growing numbers of customers are also developing a taste for hojicha.
“Hojicha is low in caffeine and has a clean, straightforward flavor, similar to coffee or black tea,” she says. “For foreigners who find matcha too bitter, hojicha sweets can feel more approachable.”

At Kyoto Station, where travelers are constantly on the move, a small café called Buburu sits beside the Shinkansen ticket gates. Its signature item is the “Buburu Sand” (¥350), a snack made by kneading fragrant hojicha leaves into crispy bread and melt-in-the-mouth soybean butter.
Buburu is a brand launched in 2023 by Gion Tsujiri, a venerable tea company founded in 1860. Rather than centering on its well-known matcha, the brand focuses on sweets made with momi-cha, or kneaded teas such as hojicha.
Unlike tencha, the steamed tea leaves that are dried intact to produce matcha, momi-cha is made by kneading the leaves while applying heat and removing moisture. This process allows producers to finely control flavor through roasting temperature and other variables.
“Drawing on the expertise of a long-established tea specialist, we aimed for an aroma that would pair well with a sandwich,” says store manager Minaho Matsuda.
About six centimeters in diameter, the sandwich resembles a small burger. Tourists have described it’s shape as “cute” and have commented that they are “easy to take onto the Shinkansen.” With inbound tourism on the rise, another draw is the use of plant-based soybean butter, making it vegan-friendly.
Japanese tea is gaining fans primarily in North America and Europe. According to Ministry of Finance trade statistics, green tea exports in 2024 rose 25 percent year on year to ¥36.4 billion (around $235 million), marking a fifth consecutive record high. In 2025, exports had already reached ¥53.9 billion by October, far surpassing the previous year and pointing to an even larger boom.
As for matcha’s global popularity, market research firm Global Information, cites growing awareness of the tea ceremony and increased health consciousness as key drivers. Riding the wave of dessert trends, hojicha may not be far behind matcha in emerging as another defining symbol of Japanese tea.
(Read the article in Japanese.)
Author: Momoka Nagare, The Sankei Shimbun
Caroline Bishop
Dec 15, 2025 09:18
MATIC price prediction targets $0.45-$0.52 recovery within 4-6 weeks as technical indicators show oversold conditions despite current bearish momentum at $0.38.
Polygon (MATIC) is currently trading at $0.38, down 70% from its 52-week high of $1.27, but technical indicators suggest a potential recovery is brewing. Our comprehensive MATIC price prediction analysis points to a medium-term target range of $0.45-$0.52 over the next 4-6 weeks, supported by oversold conditions and analyst consensus.
• MATIC short-term target (1 week): $0.42 (+10.5%)
• Polygon medium-term forecast (1 month): $0.45-$0.52 range (+18% to +37%)
• Key level to break for bullish continuation: $0.43 (SMA 20 resistance)
• Critical support if bearish: $0.35 (immediate support) / $0.33 (strong support)
Recent analyst coverage shows remarkable consensus around our Polygon forecast, with three major predictions converging on similar targets. Blockchain.News issued two separate MATIC price prediction reports, targeting $0.45 (November 2nd) and $0.52 (October 31st) for medium-term recovery. Crypto Meena’s analysis supports a $0.48 target, creating a tight consensus range of $0.45-$0.52.
The analyst community agrees that despite current bearish momentum, MATIC’s oversold conditions present an attractive risk-reward setup. All three predictions cite technical indicators like the RSI at 38 and MACD positioning as key factors supporting potential recovery, aligning with our technical assessment.
Our Polygon technical analysis reveals compelling oversold conditions that often precede significant bounces. The RSI at 38.00 sits in neutral territory but closer to oversold levels, while MATIC trades significantly below all major moving averages. The SMA 20 at $0.43 represents the first major resistance hurdle that must break for any meaningful recovery.
The Bollinger Bands analysis shows MATIC at 0.29 position within the bands, indicating the price is trading in the lower portion of its recent range. The lower band at $0.31 provides strong technical support, while the middle band at $0.43 aligns perfectly with SMA 20 resistance. Trading volume of $1.07 million on Binance suggests adequate liquidity but lacks the conviction needed for immediate breakouts.
MACD histogram at -0.0045 confirms bearish momentum, but the relatively shallow reading suggests selling pressure may be waning. The Stochastic oscillator readings (%K: 25.19, %D: 19.74) indicate oversold conditions that historically lead to short-term bounces.
The primary MATIC price target of $0.45 represents the first significant resistance level where SMA 50 converges with recent swing highs. A break above $0.43 (SMA 20) would trigger initial bullish momentum, potentially leading to a quick move toward $0.45 within 2-3 weeks.
Extended bullish scenarios point to $0.52 as the maximum realistic target within our 4-6 week timeframe. This level corresponds to the upper end of analyst predictions and would require sustained buying pressure above multiple moving average resistances. The path to $0.52 depends on broader crypto market sentiment improving and MATIC breaking above $0.48 with conviction.
Downside risks center around the $0.35 immediate support level. A break below this level would invalidate our bullish MATIC price prediction and potentially trigger a move toward $0.33 strong support. The worst-case scenario involves a break below the 52-week low of $0.37, which could lead to price discovery in uncharted territory.
Key risk factors include continued crypto market weakness, reduced institutional interest in Layer 2 solutions, or specific negative developments in Polygon’s ecosystem partnerships.
Our buy or sell MATIC recommendation leans toward selective accumulation at current levels for risk-tolerant investors. The optimal entry strategy involves dollar-cost averaging between $0.37-$0.39, with a larger position if MATIC retests the $0.35 support level.
Stop-loss placement should be tight at $0.33 (strong support) to limit downside risk to approximately 13% from current levels. This risk-reward ratio becomes attractive given the $0.45-$0.52 upside targets representing 18-37% potential gains.
Position sizing should remain conservative given the bearish momentum indicators. Consider allocating no more than 2-3% of crypto portfolio to MATIC until the price breaks above $0.43 resistance with volume confirmation.
Our MATIC price prediction targets $0.45-$0.52 within 4-6 weeks, supported by oversold technical conditions and analyst consensus. Confidence level: MEDIUM-HIGH for the $0.45 target, MEDIUM for the $0.52 extension.
Key indicators to watch for confirmation include RSI moving above 40, MACD histogram turning positive, and most importantly, a decisive break above $0.43 resistance with increased trading volume. Invalidation occurs below $0.35 support.
The timeline for this Polygon forecast extends through January 2025, with initial signals expected within 1-2 weeks. Current technical setup favors patient accumulation over aggressive buying, making MATIC an interesting medium-term recovery play rather than a short-term momentum trade.
Image source: Shutterstock
Katherine Kelly Lang is an American actress, producer, and international style icon whose dynamic career has spanned more than four decades. Born in Los Angeles on July 25, 1961, to a family rooted in both performance and elite sport, Lang made her film debut at just eighteen in Skatetown U.S.A. in 1979, quickly establishing herself as a rising talent in Hollywood’s new generation of actresses.
Her breakthrough came in 1987, when she was cast as Brooke Logan on The Bold and the Beautiful—a role that would become one of the most enduring and recognizable characters in daytime television. Over nearly forty years, Lang’s performance garnered worldwide acclaim, a devoted global audience, and multiple industry honors, including Daytime Emmy nominations, cementing her legacy as one of the genre’s most iconic leading women.
But the last ten months have marked a bold and transformative new chapter in Lang’s career—one that has propelled her beyond her legendary television persona and into the international fashion and film spotlight. In 2025, she was honored as Woman of the Year by Glamour magazine, a turning point she described as emotional, liberating, and emblematic of her evolution as an artist and a woman. The recognition coincided with her emergence as an international fashion figure: she made her debut at the Cannes Film Festival in May 2025, followed by a striking appearance on the red carpet of the 82nd Venice International Film Festival later that year, where her modern styling and confident reinvention drew widespread attention.
This creative renaissance culminated in Lang producing and releasing her own fashion-film project, Beyond the Lens: Katherine Kelly Lang, a personal and visually expressive short film that blends cinematic artistry with fashion narrative. The project, shared through her social platforms, showcases her willingness to explore new mediums and her natural affinity for style, storytelling, and visual expression.
Her recent elevation as a global fashion icon and cover star—including her first major international fashion-magazine cover—reflects the culmination of years of ambition, personal reinvention, and an unwavering commitment to her craft.

Outside her creative work, Lang is equally recognized for her dedication to wellness and athleticism. A lifelong athlete rose in a family of competitors, she has competed in triathlons, Ironman-level events, and long-distance horse-riding challenges. Even after suffering a severe ankle dislocation in a riding accident, she returned to her sport through disciplined rehabilitation—a testament to the resilience and grit that define her public and personal life. She maintains a strict approach to health, often avoiding sugars and carbohydrates, though she openly admits her love for occasional indulgences when traveling, especially in Italy.
Today, Katherine Kelly Lang stands not only as a beloved actress but as a multi-disciplinary creative force: an evolving fashion visionary, a producer with a cinematic eye, a celebrated international cover star, and an advocate for vibrant, healthy living. Her recent achievements mark a powerful reinvention—an artist confidently stepping into a new global era while continuing to inspire audiences with authenticity, elegance, and enduring passion.
Women Fitness President Ms. Namita Nayyar catches up with an exceptionally talented and accomplished, Katherine Kelly Lang who is an American actress, producer, and international style icon. Here she talks about her fitness regime, diet and success story.
You’ve played Brooke Logan since 1987… What does it mean to have your life’s work be such a definitive part of television history?
Brooke has been the heartbeat of my career, but she’s also been a mirror for my own evolution. When you play a woman for nearly four decades, you grow with her—you learn her resilience, her flaws, her fire. I’ve always said that Brooke’s longevity isn’t just about storyline; it’s about what she represents: a woman who continues to reinvent herself, who refuses to be defined by age or circumstance.
Being part of television history is an honor, of course—but what matters more to me is that millions of women saw a character who was allowed to be powerful, sensual, complex, and human at every age. That, to me, is legacy.

You were recently named Glamour’s 2025 Woman of the Year… How did this recognition mark a new chapter for you?
That moment felt like an exhale I didn’t know I was holding. It was emotional because, for the first time, I felt seen not just as the actress who played Brooke Logan, but as Katherine—the woman who is constantly evolving, curious, and hungry for new creative chapters.
Stepping into fashion wasn’t spontaneous; it was intentional. I wanted to express myself in a way that wasn’t bound by a script. The fashion film allowed me to merge storytelling with aesthetics, emotion with movement. And Glamour’s recognition felt like the universe saying: Yes, this is your time to expand. It was freeing because I realized reinvention isn’t just possible—it’s powerful.
Full Interview is Continued on Next Page
This interview is exclusive and taken by Namita Nayyar, President of womenfitness.net, and should not be reproduced, copied, or hosted in part or in full anywhere without express permission.
All Written Content Copyright © 2025 Women Fitness
Disclaimer
The Content is not intended to be a substitute for professional medical advice, diagnosis, or treatment. Always seek the advice of your physician or other qualified health provider with any questions you may have regarding a medical condition.
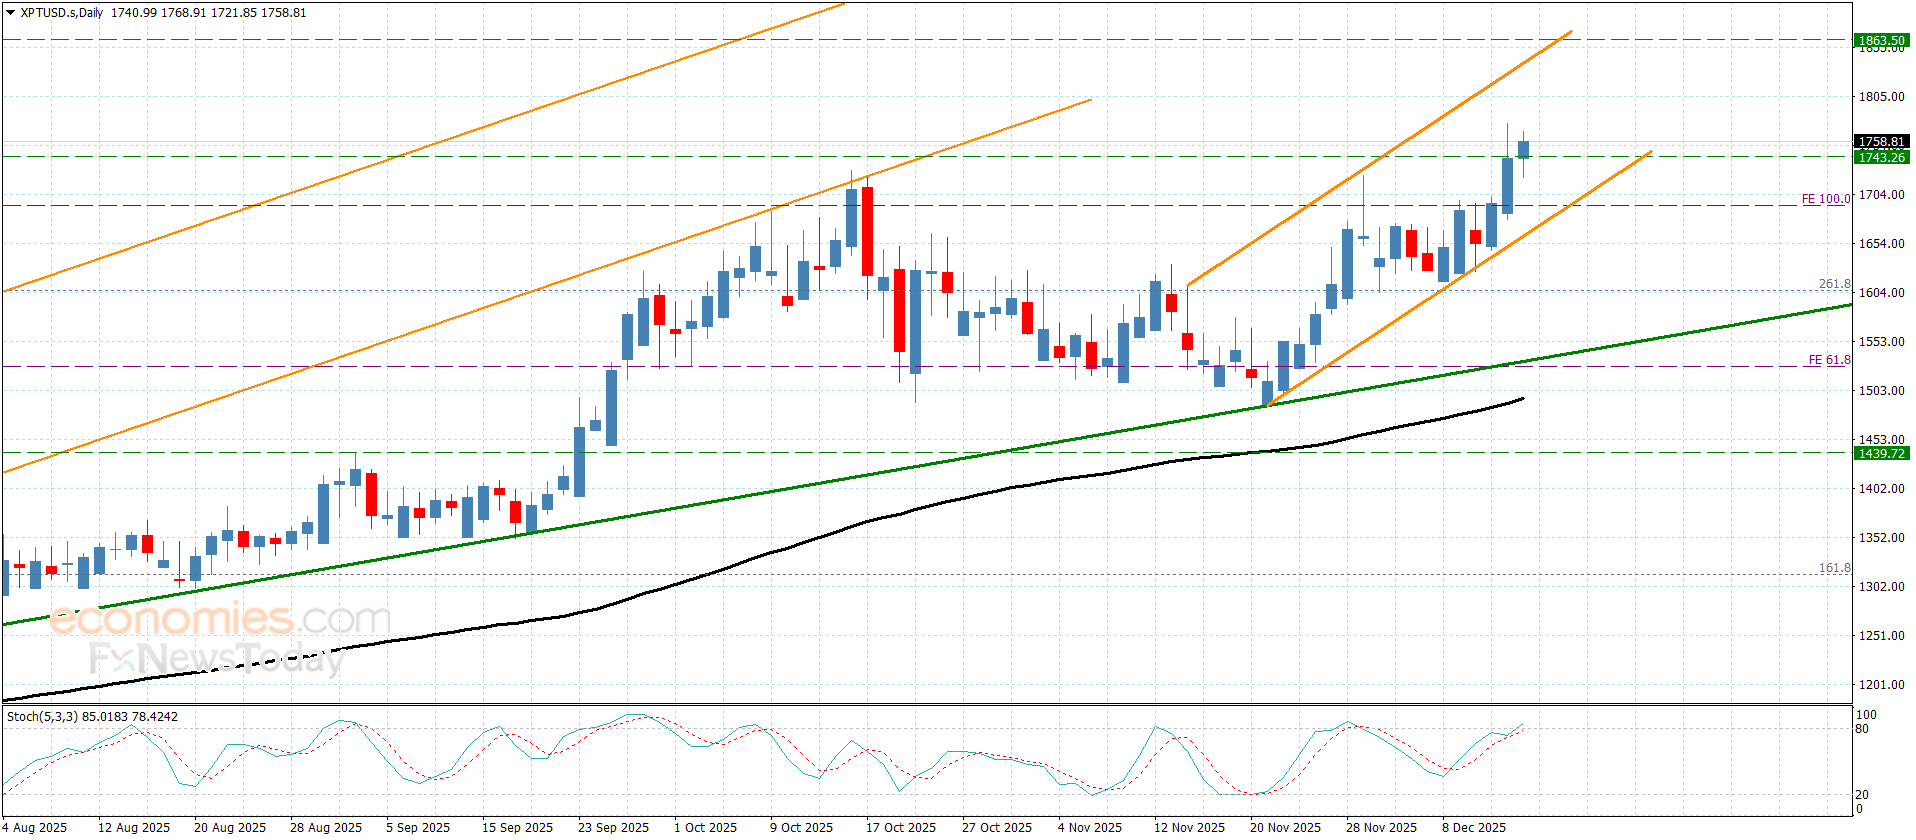
Copper price ended Friday’s trading by providing new bullish close above $5.1300 level, confirming the continuation of the bullish scenario in the near and medium period, attacking the barrier at $5.3200.
The price needs a new bullish momentum to confirm breaching the obstacle, recording new gains that might extend towards $5.5000, if the next main target in the positive trading, while the decline below $5.1300 and providing negative close will push it to form strong corrective waves, suffering several losses by reaching $4.9500.
The expected trading range for today is between $5.2000 and $5.5000
Trend forecast: Bullish
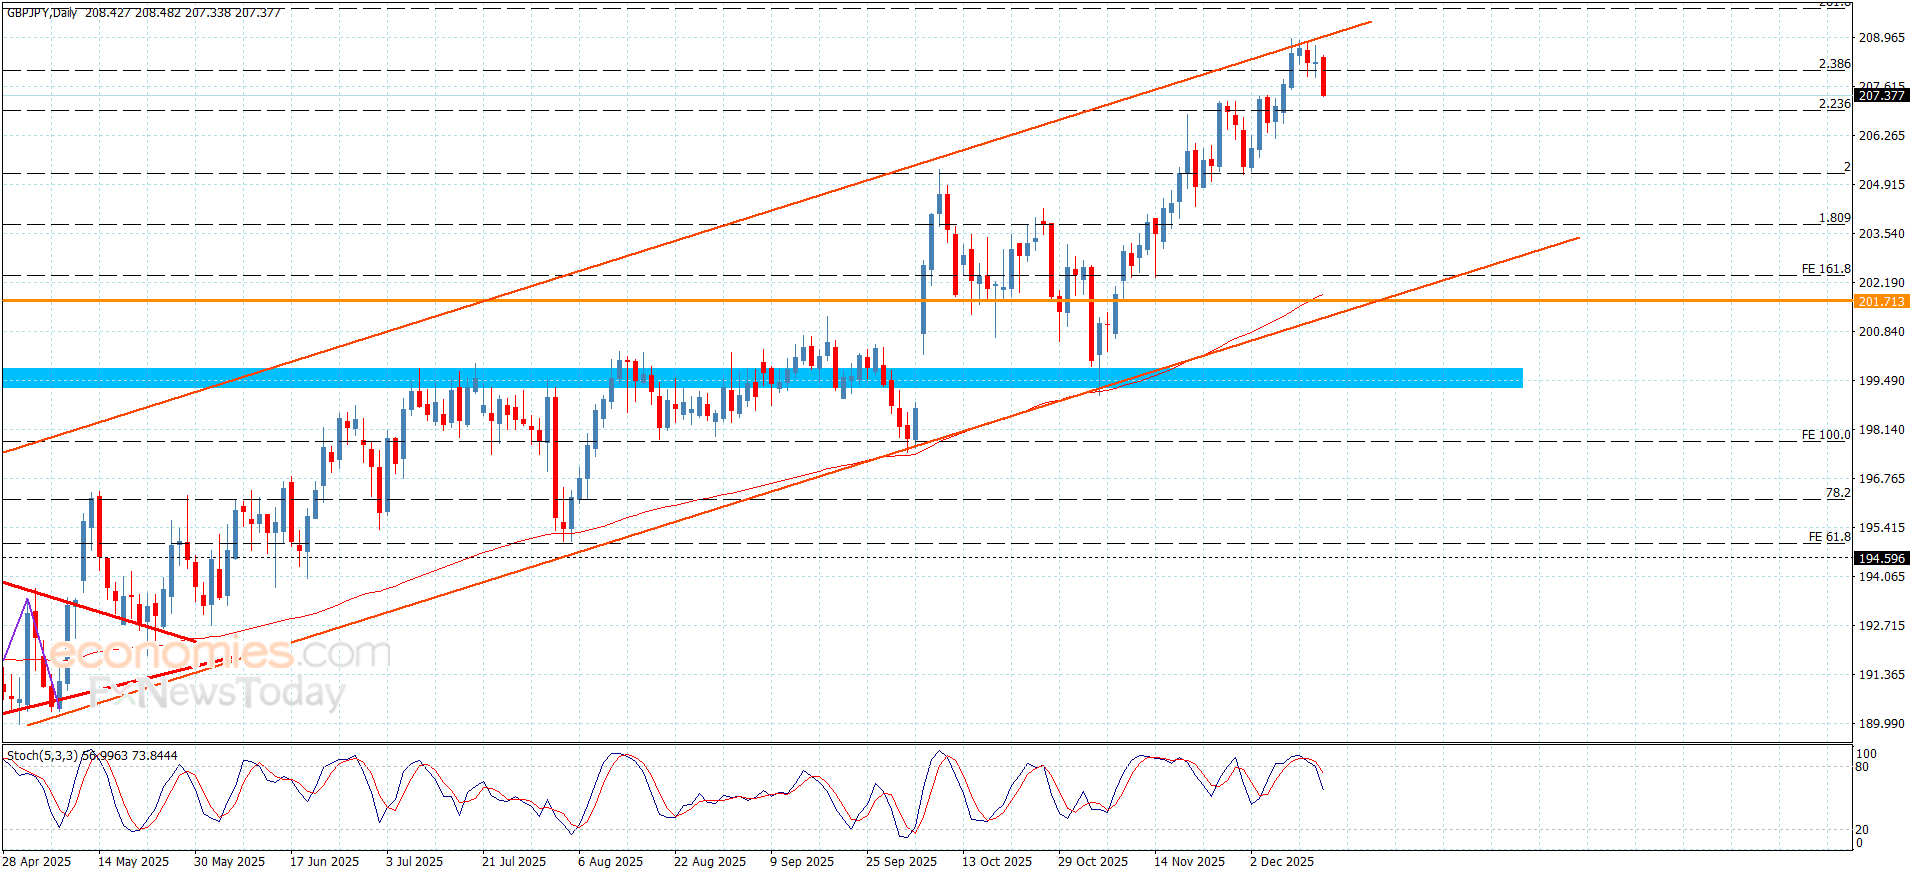
The GBPJPY pair provided a new negative close below the resistance at 208.95, to force it to activate the attempts of gathering gains, to reach 207.35 this morning, facing negative pressures by stochastic exit from the overbought level confirms the importance of reaching extra support at 206.95.
The stability above the targeted support will reinforce the chances of forming positive attempts to target 208.10 level, reaching the mentioned main resistance, while the decline below this support and providing negative close will open the way for resuming the bearish corrective attack, which might target 206.30 and 205.80 level.
The expected trading range for today is between 206.95 and 208.20
Trend forecast: Bearish
The Mexico probiotic food supplement market recorded a value of US$ 55 million in 2024 and is expected to reach a value of US$ 94.30 million in 2028, growing at a CAGR of 14.87% during the forecast period (2025-2028).
According to DataM Intelligence has published a new research report on “Mexico Probiotic Food Supplement Market Size 2025”. The report explores comprehensive and insightful Information about various key factors like Regional Growth, Segmentation, CAGR, Business Revenue Status of Top Key Players and Drivers. The purpose of this report is to provide a telescopic view of the current market size by value and volume, opportunities, and development status.
Probiotic food supplements are dietary products containing beneficial live microorganisms that help maintain or restore gut microbiota balance. In Mexico, these supplements are increasingly used to support digestive health, immunity, metabolic wellness, and overall nutrition, driven by preventive healthcare awareness and functional nutrition trends.
📌 Get a Free Sample PDF Of This Report (Get Higher Priority for Corporate Email ID):- https://datamintelligence.com/download-sample/mexico-probiotic-food-supplement-market?rk
➣ Recent Developments:
✅ In July 2025, Grupo Danone Mexico expanded its probiotic supplement portfolio beyond dairy-based formats, introducing capsule and sachet products targeting gut health and immune support for adult consumers.
✅ In June 2025, Nestlé Health Science strengthened its presence in Mexico’s nutraceutical channel by launching clinically backed probiotic blends formulated for digestive comfort and antibiotic-associated gut imbalance.
✅ In May 2025, Genomma Lab Internacional increased marketing and retail penetration of probiotic and synbiotic supplements through pharmacy chains and e-commerce platforms, addressing rising demand for digestive wellness products.
Europe: Recent Industry Developments
📌 Get Customization in the report as per your requirements: https://datamintelligence.com/customize/mexico-probiotic-food-supplement-market?rk
➣ Top Industry Players:
Pavia De Mexico, Omnilife Group, S.A. De C.V., B Life Company, Global Companies, BIOCODEX (Biocodex de México, SA de CV), Amway (Amway de México, S. de R.L. de C.V.), Herbalife International of America, Inc. (Herbalife International Of Mexico, Sa De Cv), BioGaia (BioGaia Mexico), NOW Health Group, Inc.
📌 Buy Now & Get 30% OFF – (Grab 50% OFF on 2+ reports) @: https://www.datamintelligence.com/buy-now-page?report=mexico-probiotic-food-supplement-market?rk
➣ Market Segments:
Dosage forms include tablets, capsules, liquids, powders, chewables & gumm!es, soft gels, and others, catering to diverse consumer preferences for convenience and efficacy.
Applications span gastrointestinal health subcategories like gut microbiota/microbiome balance, digestion, constipation, bloating, diarrhea, leaky gut, inflammation, immune system support, gluten sensitivity, abdominal pain, GERD/Helicobacter pylori, antibiotic-associated diarrhea/post-antibiotic treatment, gut flora/gut microbiome restoration, and others; alongside vaginal health, urinary tract health (including kidney stones, UTIs, others), oral health, anti/healthy ageing, allergies/asthma, bone & joint health (osteoarthritis, osteoporosis/low mineral bone density, inflammation), brain/mental health (sleep, cognition, mood, depression, focus), cardiovascular health (circulation), energy/fatigue reduction, metabolic syndrome/blood glucose, liver health, energy, immunity/respiratory infections, nutrient absorption, skin-hair-nails (atopic dermatitis & eczema, acne, rosacea, hair growth/hair loss, skin microbiome, others), sports, women’s health (fertility, menopause, pregnancy, PCOS, vaginal health & vaginal microbiome, vaginal infections (BV/VVC), pregnancy outcomes, others), men’s health & men’s fertility, weight management, pediatric health (colic, constipation, regurgitation, atopic dermatitis, others), and others.
📌 Have any Enquiry of This Report @ https://www.datamintelligence.com/enquiry/mexico-probiotic-food-supplement-market?rk
☛ Power your decisions with real-time competitor tracking, strategic forecasts, and global investment insights all in one place.
✅ Competitive Landscape
✅ Sustainability Impact Analysis
✅ KOL / Stakeholder Insights
✅ Unmet Needs & Positioning, Pricing & Market Access Snapshots
✅ Market Volatility & Emerging Risks Analysis
✅ Quarterly Industry Report Updated
✅ Live Market & Pricing Trends
✅ Import-Export Data Monitoring
☛ Get 2-Day Free Trial + 50% OFF DataM Subscription@ https://www.datamintelligence.com/reports-subscription?rk
Have a look at our Subscription Dashboard: https://www.youtube.com/watch?v=x5oEiqEqTWg
Contact Us –
Company Name: DataM Intelligence
Contact Person: Sai Kiran
Email: Sai.k@datamintelligence.com
Phone: +1 877 441 4866
Website: https://www.datamintelligence.com
About Us –
DataM Intelligence is a Market Research and Consulting firm that provides end-to-end business solutions to organizations from Research to Consulting. We, at DataM Intelligence, leverage our top trademark trends, insights and developments to emancipate swift and astute solutions to clients like you. We encompass a multitude of syndicate reports and customized reports with a robust methodology.
Our research database features countless statistics and in-depth analyses across a wide range of 6300+ reports in 40+ domains creating business solutions for more than 200+ companies across 50+ countries; catering to the key business research needs that influence the growth trajectory of our vast clientele.
This release was published on openPR.