The main category of All News Articles.
You can use the search box below to find what you need.
[wd_asp id=1]
The main category of All News Articles.
You can use the search box below to find what you need.
[wd_asp id=1]
Cardano’s Foundation Chief Technology Officer (CTO), Giorgio Zinetti, has expressed optimism about a possible cryptocurrency market rebound. In a post on X, Zinetti noted that there are clear indications of this based on prevailing market conditions.
Shift toward AI leaves DeFi building in ailence
According to Zinetti, the volume of Bitcoin active addresses is at a 12-month low, signaling decreased network activity.
Additionally, Bitcoin miners have recorded a 20% drop in revenue as they are earning less, which suggests pressure on the market.
Meanwhile, in the last 70 days, Bitcoin has plunged by over 32% after it hit an all-time high (ATH) of $126,198. This is another clear indication that momentum has waned and sentiment is cooling.
Bitcoin active addresses hit a 12-month low, signaling decreased network activity. Miner revenue down 20% from Q3, indicating potential stress on mining operations. 70 days since the 126K top and we’re down 32%.
Everyone’s talking about AI.
Nobody’s talking about DeFi.
That’s…
Zinetti observed that the current setup is because attention has shifted away from cryptocurrency to artificial intelligence (AI). He maintains that with attention focused on AI, the decentralized finance (DeFi) sector is quietly building.
He noted that the “best DeFi protocols of 2026” are being built right now by different founders.
Zinetti believes that now that attention has shifted to other sectors, the next cycle of winners is laying a solid foundation that could yield massive returns in 2026.
Patience and infrastructure may drive next cycle
In essence, the Cardano Foundation CTO is encouraging market participants to remain patient and ignore the noise and fluctuations.
He wants holders to remember that crypto cycles only reward those who build and invest when no one is paying attention. Overall, Zinetti opines that the DeFi product being shipped can fuel a market rebound heading into 2026.
Interestingly, on Dec. 12, Cardano Founder Charles Hoskinson made an unexpected post that fueled widespread reaction. Notably, he addressed the XRP community regarding the possibility of hosting an XRP DeFi summit, and who should make the list.
Hoskinson’s post suggests possible alignment for interoperability in the altcoin space. It might be the kind of “building” that Zinetti referred to earlier, as attention stays on AI in the interim.
In November, Hoskinson had hinted at an ambitious plan to integrate DeFi into Bitcoin, a move meant to bridge the two blockchains. The aim is to make things easier for users so they can interact with decentralized apps by spending Bitcoin directly.
Platinum prices are extending a standout 2025 rally on Tuesday, December 16, 2025, with spot quotes hovering around the $1,800–$1,830 per ounce zone in early trading—levels last seen in 2011. Data from major bullion dealers showed spot platinum around $1,828/oz in the morning (U.S. time), up roughly 1.6% over 24 hours. [1]
Platinum’s move is notable because it’s happening even as gold cools from recent highs ahead of key U.S. labor-market releases. In one of the day’s most closely watched macro setups, Reuters reported that investors were positioned cautiously ahead of delayed U.S. jobs data, while platinum still pushed higher—helped by both tight-physical-market narratives and fresh focus on European auto-policy decisions that could influence long-term demand for catalytic converters. [2]
Below is a complete, publication-ready roundup of today’s platinum price action, the news drivers moving the market, and the latest forecasts and analyst views shaping expectations into 2026—all based on information available on 16.12.2025.
Because platinum trades around the clock and pricing differs slightly by venue (spot vs. futures), today’s headlines are best understood as a range rather than a single print.
What this means for readers: “Platinum price today” is best framed as roughly $1,810–$1,830 spot, while actively traded futures were probing the mid‑$1,800s, with the day’s top end brushing the $1,860 area. [6]
Reuters described platinum as hitting its highest level since September 2011, even while other precious metals were mixed. In Reuters’ pricing snapshot, spot platinum rose about 1.3% to $1,805.85 during the session, reinforcing the sense that platinum has become a new focal point in the broader precious-metals complex. [7]
That “multi‑year high” label matters in real markets: it tends to pull in momentum traders, systematic strategies, and generalist investors who previously ignored platinum because it spent years lagging gold.
On Tuesday, gold softened as markets waited for delayed U.S. employment reports (covering October and November) and later-week inflation releases—data that can shift expectations about the Federal Reserve’s 2026 rate path. Reuters noted that the jobs release would be missing some details due to disruptions in U.S. data collection following a government shutdown, but it still sits at the center of near-term rate expectations. [8]
Why this matters for platinum specifically:
One of the most platinum-relevant headlines in today’s news cycle is coming out of Brussels.
This doesn’t guarantee a sudden surge in platinum demand—policy details and timelines still matter—but it helps explain why platinum can rally on a day when investors are otherwise cautious ahead of U.S. macro data.
Platinum’s 2025 strength hasn’t been driven by one factor. A recurring theme is tightness in physical availability—and today’s analysis stream added fresh detail.
A Commerzbank note highlighted by FXStreet said Russia’s largest palladium producer published updated forecasts indicating:
That same note emphasized a key nuance: different organizations model “investment demand” differently, and conclusions about whether higher prices are justified can change depending on what you assume about ETFs, bars and coins, and exchange inventory flows. [12]
The World Platinum Investment Council (WPIC) recently projected:
WPIC also pointed to indicators of tightness in the market (lease rates and backwardation), arguing that tight conditions can persist even after a big price run. [14]
Bottom line: Today’s market is balancing two truths at once—(1) platinum has already rallied sharply, and (2) multiple credible outlooks still describe a market that is structurally constrained, even if 2026 trends toward balance.
In a broader precious-metals outlook published today, Reuters reported that Morgan Stanley forecasts platinum at $1,775/oz in 2026 (with palladium at $1,325), citing structural imbalances and different demand drivers across the complex. [15]
That projection is important for two reasons:
The FXStreet/Commerzbank commentary stressed that when you exclude investor demand, WPIC’s framework can even imply oversupply, which would not support further price gains—highlighting why the next phase for platinum may depend heavily on whether investors keep adding exposure via ETFs, bars, coins, and exchange inventory changes. [16]
Technical dashboards won’t tell you why platinum is moving, but they do reveal how crowded the trend may be.
With futures printing up to the mid‑$1,800s and the day’s trading range extending toward $1,861, traders are watching whether the market can hold above the psychologically important $1,800 zone without sharp pullbacks. [18]
Reuters emphasized that markets were focused on U.S. employment data (October and November) and upcoming inflation releases (CPI and PCE). These prints can quickly swing the U.S. dollar, real yields, and risk appetite—all of which can feed into platinum prices. [19]
If the European Commission’s auto-sector package or related political messaging materially changes expectations for the pace of ICE phaseouts, it could influence longer-run projections for catalytic converter demand—especially for platinum and palladium. [20]
The market is acutely sensitive to whether “tightness” is being eased by above-ground stocks, ETF flows, or exchange inventory movements—exactly the variables analysts are debating in today’s research notes. [21]
Platinum’s surge in 2025 is no longer flying under the radar. Today’s pricing shows a metal trading around $1,810–$1,830 spot and mid‑$1,800s in futures, holding near its highest levels since 2011. [22]
The day’s narrative is being driven by:
Meanwhile, the forecast picture is becoming more nuanced: Morgan Stanley’s $1,775/oz 2026 view implies a slower pace after the rally, even as structural constraints remain a core part of the bull case. [26]
Note: Prices are quoted in U.S. dollars per troy ounce and can change rapidly. This article is informational and not investment advice.
1. www.apmex.com, 2. www.reuters.com, 3. www.apmex.com, 4. www.kitco.com, 5. www.investing.com, 6. www.apmex.com, 7. www.reuters.com, 8. www.reuters.com, 9. www.reuters.com, 10. www.reuters.com, 11. www.fxstreet.com, 12. www.fxstreet.com, 13. www.prnewswire.com, 14. www.prnewswire.com, 15. www.reuters.com, 16. www.fxstreet.com, 17. www.investing.com, 18. www.investing.com, 19. www.reuters.com, 20. www.reuters.com, 21. www.fxstreet.com, 22. www.kitco.com, 23. www.reuters.com, 24. www.reuters.com, 25. www.fxstreet.com, 26. www.reuters.com
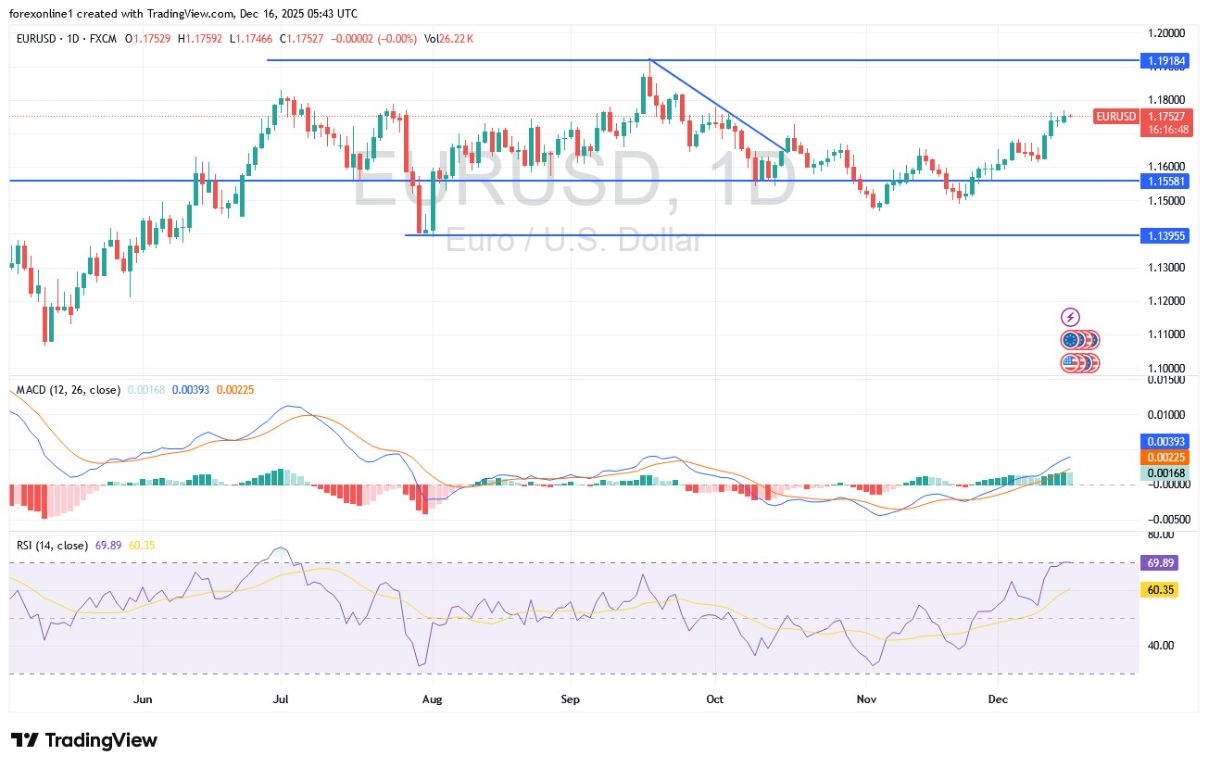
For three consecutive trading sessions, the EUR/USD price has stabilized around its recent upward rebound gains, hovering near the resistance level of 1.1768—the highest for the pair in two months. Overall, based on performance across reliable trading platforms, the rise witnessed in the EUR/USD exchange rate this month indicates it is approaching overbought territory, making it a candidate for a correction amid profit-taking sales.
Technically: The rapid rise in the Euro price recently is pushing the Relative Strength Index (RSI) toward the 70 threshold, the level at which EUR/USD is officially considered overbought. The RSI tends to revert to the mean upon reaching this zone, implying an eventual decline. For this to occur, we need the EUR/USD price to enter a sideways path or a slight downward retreat.
In short, we believe Euro trading will see a slight dip after a strong rally; we would not be surprised to see a pullback below 1.17 this week before the next upward wave. However, charts can only offer limited information in a week marked by major economic data releases.

According to Forex market trading, the EUR/USD exchange rate will be affected by the Eurozone PMI results for December, expected today, Tuesday, starting at 10:15 AM Egypt time. These are expected to confirm continued positive momentum for the region’s economy through the end of the year. Generally, the Eurozone Services PMI is expected to print at 53.3, while the manufacturing sector recovery is expected to confirm a slight rise to 49.9, placing it on the verge of returning to growth.
Overall, strong economic data would support the view that no further interest rate cuts are necessary from the European Central Bank. In fact, a better-than-expected Purchasing Managers’ Index (PMI) reading would reinforce expectations of continued interest rate hikes.
However, the US Dollar’s path will be the primary driver for EUR/USD during this trading week. The release of US labor market data is the standout event in global financial markets. Notably, this data was delayed by the US government shutdown, meaning it will fill a significant data gap. US November jobs data will be released today, Tuesday, at 15:30 Egypt time, with expectations pointing to an increase of 50,000 jobs and an unemployment rate of 4.4%. If the numbers fall below expectations, the market will increase bets on Fed rate cuts in 2026, negatively affecting US bond yields and the Dollar price today.
Conversely, if the data exceeds expectations, these expectations of an interest rate cut will diminish, and the US dollar may rise and potentially continue its gains for the remainder of the week, potentially hindering the euro’s appreciation against the US dollar.
Furthermore, keep an eye on US Retail Sales data, also scheduled for release today at the same time, which will indicate the strength of demand in the economy. Expectations suggest a figure exceeding 0.2% monthly for October. On Thursday, US Inflation (CPI) data will be released, with expectations of a rise to 3.1% annually in November, compared to 3.0% previously.
Obvioulsy, this trend appears unsatisfactory for the Federal Reserve. Any figure higher than expected will cast doubt on market expectations for rate cuts next year, thereby supporting the US Dollar.
Today’s trading session is crucial in determining the fate of the EUR/USD for the remainder of 2025 and will shape the start of the new year’s trading. Be cautious, as we may witness strong and rapid changes in currency prices.
Ready to trade our EUR/USD daily forecast? Here’s a list of some of the top forex brokers in Europe to check out.
Las Vegas, Nevada–(Newsfile Corp. – December 16, 2025) – PureWell Sciences announced the launch of its Psychobiotics supplement recently. This new formula combines prebiotics, probiotics, postbiotics and L-Glutamine in one capsule. It targets the gut-brain axis to support mental wellness.
PureWell Sciences Psychobiotic
To view an enhanced version of this graphic, please visit:
https://images.newsfilecorp.com/files/8871/277580_69fd66fad441cabc_001full.jpg
Gut health leads the wellness trends for 2026. The global market for these supplements has grown to over $150 million. Recent data shows that 92% of consumers prioritize mental health and they want natural solutions. PureWell Sciences answers this call.
Standard probiotics focus only on digestion. But PureWell Sciences Psychobiotics reach the vagus nerve. This major nerve links your gut directly to your brain. The formula works in three ways:
“Every formula we make is shaped by real research and real experience – including mine. PureWell Sciences isn’t just a supplement brand. It’s proof that you don’t have to live in survival mode,” says Serhii Bohoslovskyi, Partner at PureWell Sciences. “At PureWell Sciences, science is the foundation of everything we do. Our formulas are guided by the latest research in nutrition, gut-brain health, and cellular support. We combine rigorous clinical studies with carefully selected ingredients to create effective, safe, and synergistic products that truly make a difference.”
You can buy PureWell Psychobiotics online from purewellsciences.com or on Amazon.
About PureWell Sciences
PureWell Sciences is a health and wellness company focused on creating science-backed, natural supplements that support mind, body, and long-term vitality.
To view the source version of this press release, please visit https://www.newsfilecorp.com/release/277580
Source: PRNews OU
Terrill Dicki
Dec 16, 2025 09:26
MATIC price prediction suggests potential 18-37% upside to $0.45-$0.52 range by January 2025, contingent on breaking $0.58 resistance with current support holding at $0.35.
Polygon (MATIC) finds itself at a critical juncture as December 2025 draws to a close, with the cryptocurrency trading at $0.38 amid mixed technical signals. Our comprehensive MATIC price prediction analysis suggests the token is positioned for a potential recovery toward the $0.45-$0.52 range within the next 4-6 weeks, provided key resistance levels are broken and critical support zones hold firm.
• MATIC short-term target (1 week): $0.40-$0.42 (+5-11%)
• Polygon medium-term forecast (1 month): $0.45-$0.52 range (+18-37%)
• Key level to break for bullish continuation: $0.58
• Critical support if bearish: $0.35
The latest analyst consensus reveals a cautiously optimistic outlook for MATIC, with multiple forecasts converging on similar price targets. Recent predictions from Blockchain.News consistently point to a MATIC price target range of $0.42-$0.58 across various timeframes, with most analysts maintaining medium confidence levels.
The December 6th Polygon forecast identified $0.42-$0.50 as the medium-term target, emphasizing that critical support at $0.35 remains intact despite current bearish momentum. Earlier predictions from November showed slightly higher ambitions, with some analysts targeting the $0.45-$0.58 range, contingent on breaking the crucial $0.58 resistance level.
What’s particularly noteworthy is the consistency across multiple analyst reports regarding the $0.58 resistance level as the key determinant for MATIC’s next major move. This level has repeatedly emerged as the make-or-break point that could either trigger a 53% rally or send the token retreating to $0.35 support.
The current Polygon technical analysis reveals a token in consolidation, trading near the lower end of its recent range. With MATIC positioned at $0.38, the price sits below all major moving averages except the 7-day SMA ($0.37), indicating underlying weakness that requires careful navigation.
The RSI reading of 38.00 places MATIC in neutral territory but leaning toward oversold conditions, potentially setting up for a relief bounce. However, the MACD histogram at -0.0045 confirms bearish momentum remains intact, with the MACD line (-0.0246) still below its signal line (-0.0202).
Perhaps most telling is MATIC’s position within the Bollinger Bands, where the token trades with a %B position of 0.2879, suggesting it’s closer to the lower band ($0.31) than the upper band ($0.56). This positioning often precedes either a breakdown below support or a mean reversion toward the middle band at $0.43.
The Stochastic oscillator readings (%K: 25.19, %D: 19.74) indicate MATIC is approaching oversold territory, which historically has provided buying opportunities for patient investors willing to wait for confirmation.
The optimistic MATIC price prediction scenario envisions a staged recovery beginning with an initial move toward $0.42-$0.45, representing the first significant resistance cluster. This upside case relies heavily on MATIC maintaining support above $0.35 while gradually building bullish momentum.
Should MATIC successfully reclaim the 20-day SMA at $0.43, the next logical target becomes the $0.48-$0.50 zone, which aligns with analyst price targets and represents the convergence of the 50-day SMA ($0.45) and psychological resistance levels.
The ultimate bullish MATIC price target remains the critical $0.58 level, which has consistently appeared in analyst forecasts as the gateway to more substantial gains. Breaking this resistance could potentially trigger the 53% rally mentioned in previous predictions, targeting the $0.72 region.
The bearish scenario for our Polygon forecast centers around a failure to hold the $0.35 support level that analysts have repeatedly identified as critical. A breakdown below this level could trigger a cascade toward the next major support at $0.33, representing the 52-week low territory.
Given MATIC’s current distance of over 70% from its 52-week high of $1.27, further downside could potentially test the lower Bollinger Band at $0.31. This scenario would likely be accompanied by deteriorating market sentiment and continued bearish momentum as indicated by current MACD readings.
The bearish case gains credibility if MATIC fails to reclaim the 20-day SMA at $0.43 within the next two weeks, as this would suggest the current consolidation is more distribution than accumulation.
For investors considering whether to buy or sell MATIC, the current technical setup presents a complex decision matrix. The token’s position near critical support levels offers both opportunity and risk in equal measure.
Conservative entry points should focus on the $0.35-$0.37 range, where strong support has historically emerged. This approach allows for tight risk management with stop-loss orders placed just below $0.33, limiting downside to approximately 8-12%.
More aggressive traders might consider scaling into positions on any bounce toward $0.40-$0.42, using this level as a launching pad for the anticipated move toward our medium-term MATIC price target of $0.45-$0.52.
Risk management remains paramount given the mixed signals in current technical indicators. Position sizes should be kept modest until MATIC demonstrates clear directional bias, preferably through a decisive break above $0.43 or below $0.35.
Our comprehensive analysis suggests a cautiously optimistic MATIC price prediction for the coming weeks, with the token positioned for a potential 18-37% recovery toward the $0.45-$0.52 range by January 2025. This Polygon forecast carries a medium confidence level, contingent on maintaining support above $0.35 and eventually breaking resistance at $0.58.
Key indicators to monitor include RSI movement above 45 for bullish confirmation and MACD histogram turning positive to signal momentum shift. The critical timeline for this prediction spans the next 4-6 weeks, during which MATIC must demonstrate its ability to reclaim key moving averages and build sustainable upward momentum.
Traders should watch for volume confirmation on any breakout attempts, as the current 24-hour volume of $1.07 million suggests limited institutional interest that must improve for any sustained rally to materialize.
Image source: Shutterstock
Oil prices fell again on Tuesday, December 16, 2025, pushing Brent crude below the closely watched $60-a-barrel level and keeping West Texas Intermediate (WTI) pinned in the mid-$50s. The move extends a months-long slide driven by a market that is increasingly focused on one question: Will 2026 be defined by a supply glut—especially if geopolitics turns less restrictive for Russian barrels—just as demand growth cools? [1]
At around 12:14 GMT, Brent crude futures were down about 1.3% at roughly $59.75 a barrel, while WTI was down nearly 1.5% near $55.98, according to Reuters. [2]
Crude benchmarks are hovering near multi-month lows:
Bloomberg’s broader markets wrap (published Dec. 16) also described Brent dipping below $60 for the first time since May, underscoring the “risk-off” tone across assets ahead of key U.S. macro releases. [5]
The biggest immediate catalyst is rising optimism around potential Russia–Ukraine peace talks—an outlook that markets interpret as increasing the odds of eased sanctions or reduced logistical friction for Russian crude flows. Reuters reported that the U.S. offered NATO-style security guarantees for Kyiv and that European negotiators flagged progress, though Russia also signaled it was unwilling to make territorial concessions. [6]
From the market’s perspective, even a small perceived increase in “effective supply” can hit prices when balances already look loose. Rystad Energy’s Janiv Shah said the market is assessing whether a peace deal could make additional Russian volumes available and worsen oversupply. [7]
On the demand side, traders are digesting softer Chinese indicators. Reuters highlighted that China’s factory output growth slowed to a 15‑month low, and retail sales growth was the weakest since December 2022—data points that reinforce concerns about consumption momentum in the world’s largest crude importer. [8]
That matters because, in a well-supplied market, oil prices tend to react sharply to any sign demand growth is wobbling—particularly out of China.
Even tensions and disruptions that would typically support crude—such as U.S.-Venezuela-related developments—have struggled to lift the tape. Reuters noted that the impact of the U.S. seizure of a tanker near Venezuela was limited by abundant floating storage and shifts in buying patterns. [9]
In short: today’s tape is less about “what could go wrong” and more about “how much extra oil the world may have next year.”
One of the most important (and nuanced) themes in today’s oil market is that China’s import strength doesn’t automatically translate into stronger end-demand—because a growing share may be headed into inventories.
A Reuters analysis published Dec. 16 estimated China’s “surplus crude” (crude available minus refinery runs) at about 1.88 million barrels per day in November, the highest in six months. Imports were estimated around 12.43 million bpd(a 27‑month high), while refinery throughput was about 14.86 million bpd. [10]
Reuters also noted the price incentive: Brent peaked near $82.63 in mid-January but fell toward the low $60s by December, encouraging opportunistic buying and stockbuilding. [11]
Why this matters for oil price today:
If China is stockpiling into weakness, it can cushion the downside at times—but it can also make the demand picture harder to read. Stockbuilding can fade quickly if prices rebound or if policy shifts, adding uncertainty to 2026 forecasts. [12]
Oil isn’t falling in a vacuum. Multiple major forecasters—and the futures curve itself—have been warning for months that supply growth may outpace demand into 2026.
The International Energy Agency (IEA) has been among the most-cited sources behind “glut” talk. In its December 2025 Oil Market Report, the IEA said observed global inventories rose to four-year highs and highlighted that its balances imply a ~3.7 million bpd average surplus from 4Q 2025 through 2026, even after accounting for market opacity and mismatches across crude, NGLs, and products. [13]
Separately, Reuters reported on Dec. 11 that the IEA trimmed its 2026 surplus estimate but still projected supply exceeding demand by about 3.84 million bpd in 2026—still close to 4% of world demand in scale. [14]
The U.S. Energy Information Administration (EIA), in its Short-Term Energy Outlook (STEO), forecast that rising global inventories could keep pressure on prices and projected Brent averaging about $55 per barrel in Q1 2026, staying near that level for much of the year. [15]
That forecast is a key anchor for the bearish narrative because it ties the price outlook directly to inventory accumulation.
OPEC has maintained a more constructive demand stance than the IEA. Argus reported (from OPEC’s latest Monthly Oil Market Report coverage) that OPEC expects global oil demand to grow by about 1.38 million bpd in 2026 to roughly 106.52 million bpd, and it estimates the “call on OPEC+ crude” around 43 million bpd in 2026. [16]
Reuters also noted that OPEC’s view implies a much tighter balance than the IEA’s. [17]
Translation: If you’re wondering why oil price forecasts diverge so sharply, it often comes down to different assumptions about (1) demand growth, (2) non-OPEC supply, and (3) how disciplined OPEC+ will be if prices weaken further.
Today’s price action is also being amplified by the range of credible, widely cited forecasts now clustering below (or not far above) current levels:
Analysts quoted by Reuters also highlighted a key psychological threshold: PVM Oil Associates suggested Brent could make a fresh year-to-date low, but in their view might not break below $55 before year-end—framing $55 as an important line in the sand for the market narrative. [21]
OPEC+ policy is central to whether today’s weakness becomes a deeper downcycle.
Reuters reported earlier this quarter that OPEC+ agreed to pause output increases for January–March 2026 after boosting targets by around 2.9 million bpd since April, reflecting rising concerns about an oversupplied market. [22]
That pause is one reason some forecasters believe the market may stabilize—at least temporarily—if producers remain willing to slow or stop additional barrels.
But here’s the tension: as prices fall, some producers may want to defend revenue by pumping more, while others may want to defend price by cutting. That internal push-pull is one reason volatility tends to rise when Brent trades near “policy-sensitive” levels like $60 and below.
Oil price today is being driven by headlines, macro data, and forward-looking balances—so the next moves may come from a few specific channels:
Any concrete progress toward a ceasefire—or signals about sanctions enforcement and shipping restrictions—can move crude quickly because it changes the perceived availability and routing of Russian supply. [23]
If China continues importing heavily primarily for stockbuilding, it can support seaborne flows but may not confirm stronger end-demand. Reuters’ storage calculations highlight how important this distinction has become for forecasters. [24]
Broader markets on Dec. 16 were focused on incoming U.S. jobs data and what it implies for rate policy and risk appetite—factors that can feed into oil via growth expectations and currency moves. [25]
Both the IEA and EIA are explicitly linking their bearish price outlooks to the expectation that global inventories continue rising through 2026. If inventory builds accelerate, it strengthens the bearish case; if they slow, it can relieve pressure. [26]
On December 16, 2025, crude is trading like a market that believes supply growth will outpace demand into 2026, and that any easing of Russia-related constraints would only add to that imbalance. [27]
That doesn’t mean prices must fall in a straight line—OPEC+ policy, geopolitics, and China’s buying behavior can still create sharp rallies. But for now, the dominant theme behind oil price today is clear: glut fears are overwhelming disruption fears, and the market is treating sub-$60 Brent as a signal that the next chapter will be fought over how quickly (and how far) inventories build.
1. www.reuters.com, 2. www.reuters.com, 3. www.reuters.com, 4. www.reuters.com, 5. www.investmentnews.com, 6. www.reuters.com, 7. www.reuters.com, 8. www.reuters.com, 9. www.reuters.com, 10. www.reuters.com, 11. www.reuters.com, 12. www.reuters.com, 13. www.iea.org, 14. www.reuters.com, 15. www.eia.gov, 16. www.argusmedia.com, 17. www.reuters.com, 18. www.reuters.com, 19. www.reuters.com, 20. www.reuters.com, 21. www.reuters.com, 22. www.reuters.com, 23. www.reuters.com, 24. www.reuters.com, 25. www.investmentnews.com, 26. www.eia.gov, 27. www.reuters.com
The GBPJPY pair continued providing negative trading, affected by forming extra barrier at 208.10 level, with the negative momentum that comes from stochastic below 50 level, attacking the support at 206.90 that formed the suggested target in the previous report.
The effect of the temporary sideways bias dominance, however facing the negative pressures that might push it to resume the corrective decline, to target 206.25 and 205.80 level, while renewing the bullish attempts requires forming strong bullish attack, to settle above 208.10 then begin targeting new positive stations by its rally towards 209.15.
The expected trading range for today is between 206.25 and 207.65
Trend forecast: Bearish
The global tea market was valued at USD 59.59 billion in 2025 and is projected to grow at a CAGR of 6.20% during the forecast period of 2026-2035, reaching USD 108.75 billion by 2035. This growth is driven by factors such as increasing consumer awareness about health benefits, growing tea consumption in emerging markets, and product innovations. However, the market faces challenges related to climate change, competition from other beverages, and price volatility of raw materials.
Get a Free Sample Report with Table of Contents: https://bit.ly/4rVsZ9z
Key Growth Drivers in the Tea Market
1. Rising Health Consciousness
The increasing awareness of health and wellness is one of the key factors propelling the growth of the tea market. Tea, particularly varieties like green tea, herbal tea, and black tea, is recognized for its health benefits, including antioxidants, anti-inflammatory properties, and its role in improving heart health and digestion. As consumers become more health-conscious, tea is increasingly replacing sugary soft drinks, making it a popular alternative for those seeking to improve their overall health.
The demand for functional teas, which offer specific health benefits, such as detoxification, immunity boosting, and weight management, is also increasing, particularly among the younger demographic. This trend is significantly contributing to market growth.
2. Growing Tea Consumption in Emerging Markets
The demand for tea is rising significantly in emerging markets, particularly in Asia-Pacific, Africa, and parts of Latin America. In countries like India, China, and Brazil, tea is deeply ingrained in daily culture, and the growing urban population and increasing disposable incomes are leading to a surge in consumption. As these regions become more urbanized, there is a greater demand for both traditional and premium tea products.
In India, the world’s largest producer and consumer of tea, the market is expanding due to an increase in domestic consumption, while China continues to dominate global tea production and export. These markets are expected to contribute significantly to the overall growth of the global tea industry.
3. Product Innovation and Diversification
Innovations in tea flavors and blends are driving the demand for specialty teas. Companies are introducing new flavors, such as chai, iced tea, and flavored green teas, to cater to the evolving preferences of consumers. Additionally, ready-to-drink (RTD) tea has gained immense popularity, particularly among millennials and health-conscious consumers, providing convenience without sacrificing taste and quality.
The rise of organic tea and sustainably sourced tea is also reshaping the market as consumers become more concerned about ethical sourcing and environmental impact. Brands offering these products are meeting the growing demand for premium and eco-conscious tea options.
Read Full Report with Table of Contents: https://bit.ly/4kM6AGT
4. Growth of Tea Cafés and Specialty Tea Retailers
The expansion of tea cafés and specialty tea retailers has significantly impacted the global tea market, particularly in Western countries. These establishments are introducing consumers to a wide variety of high-quality teas, leading to a shift away from traditional coffeehouse culture. Popular chains and independent tea houses are boosting the global appeal of premium teas, further fueling market growth.
Challenges in the Tea Market
1. Climate Change and Its Impact on Tea Production
Tea production is highly susceptible to climate change. Variations in temperature, rainfall patterns, and extreme weather events can significantly affect the yield and quality of tea leaves. Flooding, droughts, and changing growing seasons are increasing challenges for tea growers worldwide, especially in traditional growing regions such as India, Sri Lanka, and China.
Climate-related disruptions can result in fluctuating prices and supply shortages, impacting the stability of the global tea market and leading to unpredictable market dynamics.
2. Intense Competition from Other Beverages
While tea is a popular beverage worldwide, it faces intense competition from a variety of other drinks, including coffee, soft drinks, and energy drinks. In particular, the increasing popularity of coffee culture in many regions poses a challenge for tea, especially in markets where coffee has historically dominated the beverage landscape.
Moreover, with the rise of ready-to-drink beverages across the beverage industry, tea must compete not only with coffee and soft drinks but also with other ready-to-consume drinks, such as plant-based beverages and fruit juices, which appeal to health-conscious consumers.
3. Price Volatility of Raw Materials
Tea prices can be volatile due to fluctuations in the price of raw materials, such as tea leaves and packaging materials. Factors like crop yields, labor shortages, and economic conditions in tea-growing countries can affect the supply and cost of tea. As a result, manufacturers may face challenges in maintaining consistent pricing, which could affect consumer purchasing behavior and profitability for producers.
Read More Reports:
India Plant‐Based Nutraceuticals Market- https://bit.ly/3X4Gq8U
Digital Content Creation Market- https://bit.ly/46t7cxA
Media Contact:
Company Name: Claight Corporation
Contact Person: Sophia Grace, Business Consultant
Email: sales@expertmarketresearch.com
Toll Free Number: US +1-415-325-5166 | UK +44-702-402-5790
Address: 30 North Gould Street, Sheridan, WY 82801, USA
Website: https://www.expertmarketresearch.com
About Us
Acquire unparalleled access to critical industry insights with our comprehensive market research reports, meticulously prepared by a team of seasoned experts. These reports are designed to equip decision-makers with an in-depth understanding of prevailing market trends, competitive landscapes, and growth opportunities.
Our high-quality, data-driven analysis provides the essential framework for organisations seeking to make informed and strategic decisions in an increasingly complex and rapidly evolving business environment. By investing in our market research reports, you can ensure your organisation remains agile, proactive, and poised for success in today’s competitive market.
Don’t miss the opportunity to elevate your business intelligence and strengthen your strategic planning. Secure your organisation’s future success by acquiring one of our Expert Market Research reports today.
This release was published on openPR.
The XRP price has come under enormous pressure after it experienced a huge sell-off throughout the weekend and closed on a bearish note. Bitcoin price slumped hard in the early trading hours, which dragged the entire market down, including XRP. The whale interest seems to have trembled a bit, which seems to have been absorbed by the bulls. With the technicals and the on-chain data hinting towards a ‘market reset,’ it would be interesting to watch whether the XRP price will reclaim $2 this year or not.
The clearest source of XRP’s current sell-side pressure comes from whales. Large-wallet holdings have fallen from roughly 4.8 billion XRP in late November to 3.6 billion XRP by December 15, according to Sentiment data presented by a popular analyst, Ali. This is a meaningful drop in deep-pocket supply and historically aligns with short-term tops or multi-week corrections.
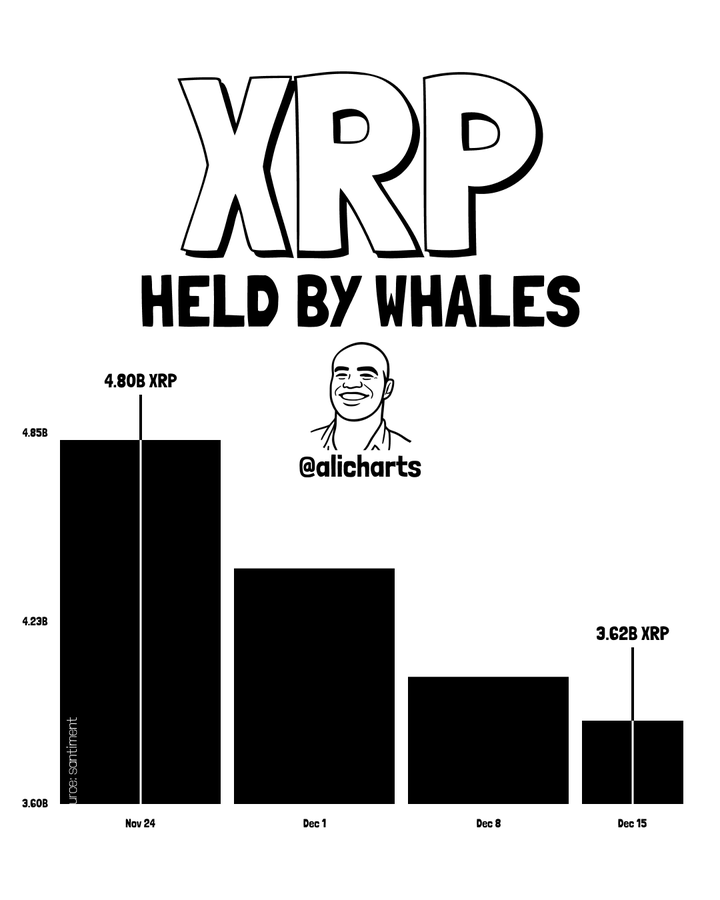
Whales typically offload during high volatility or uncertainty, and their selling over the past three weeks has coincided with XRP breaking key support levels—including the crucial $0.60 zone—and sliding further in line with the broader market downturn. For now, the short-term trend remains bearish primarily because the largest holders are driving liquidity out of the market.
But the second chart tells a very different story. While whales have been exiting, XRP-focused ETFs and ETPs have recorded consecutive net inflows, outperforming both Bitcoin and Ethereum products during the same period.
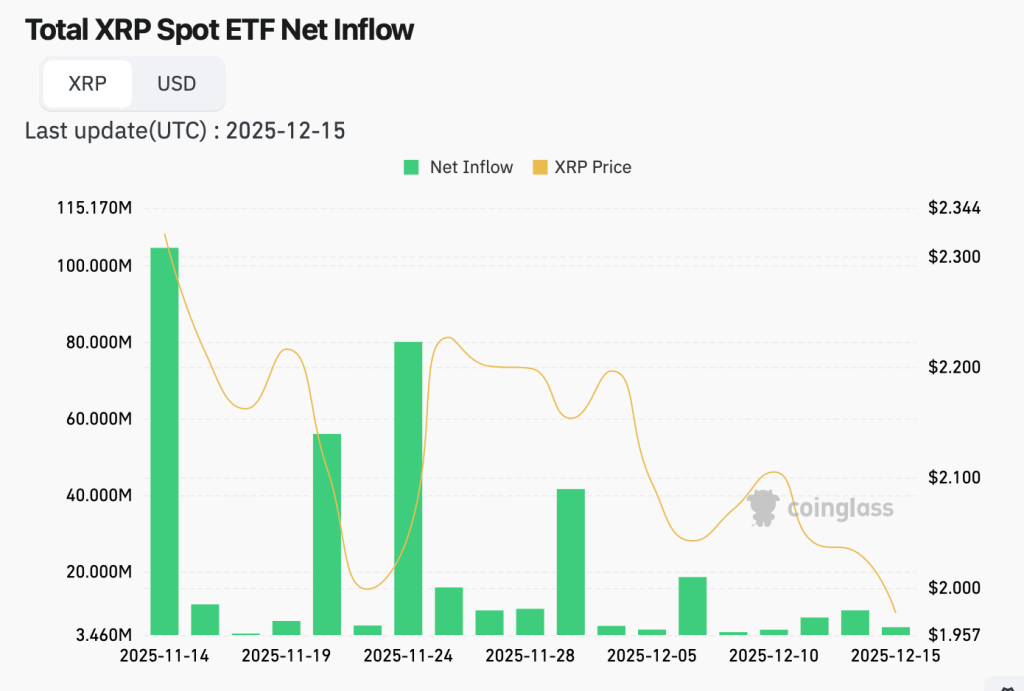
Bitwise, Franklin, and other issuers posted multi-million-dollar daily inflows, pushing cumulative net assets above $1.18 billion. Bitwise alone attracted nearly $3.9 million in new flows, while Franklin added more than $4.3 million, suggesting institutional allocators are quietly increasing exposure.
This divergence—whales selling, institutions buying—indicates that longer-term players view the current weakness as an opportunity rather than a trend reversal. ETF flows don’t typically chase short-term momentum; they reflect strategic positioning and confidence in future value.
The final piece of the puzzle is XRP’s percent supply in profit, which has collapsed sharply during the recent decline. Historically, whenever the proportion of profitable supply falls this quickly, it signals one of two things: capitulation or the formation of an accumulation zone.
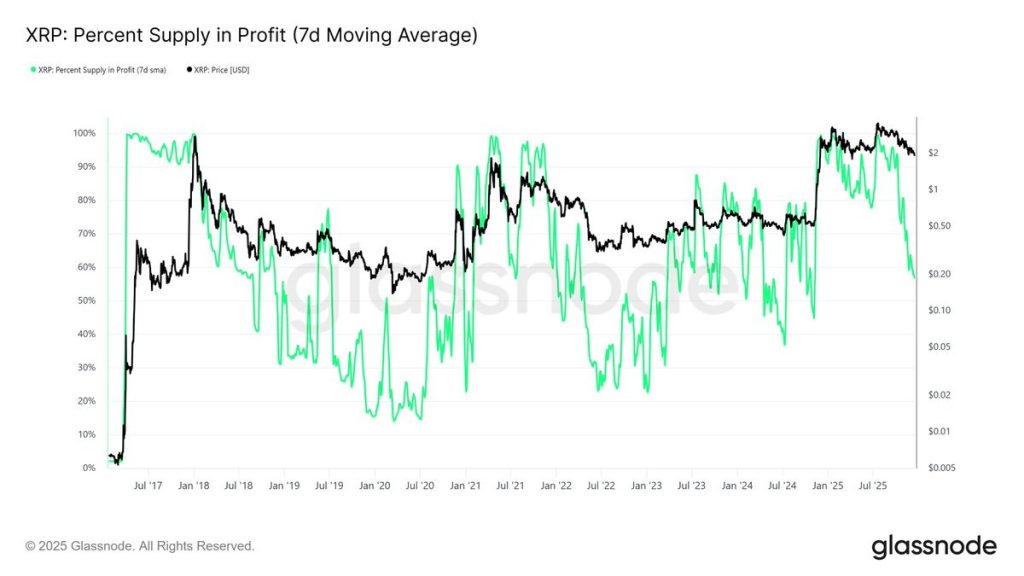
Current readings are now approaching levels seen during major resets in 2018, 2020, and 2022—each of which preceded substantial rebounds in the months that followed. This metric is crucial because it tells us that XRP’s corrective move is flushing out weak hands and resetting expectations, rather than ushering in a prolonged downtrend.
When all three signals are aligned, the conclusion becomes clearer: Whales are driving the immediate sell-off, and ETFs are absorbing a meaningful portion of that pressure, reflecting institutional conviction. Meanwhile, on-chain profitability metrics show XRP entering a historical reset zone.
Despite short-term weakness, XRP’s underlying market structure is quietly strengthening. Together, these trends suggest the current correction may be setting the stage for a broader recovery once selling pressure eases. If institutional demand holds and on-chain metrics continue to stabilize, XRP price could realistically work its way back toward the $2 level before the end of 2025.
Analysts predict XRP could reach $5.05 by December 2025 if bullish momentum continues and key resistance levels are broken.
XRP price is influenced by ETF approvals, on-chain activity, investor sentiment, legal developments, and broader crypto market trends.
XRP shows bullish signs with strong on-chain activity and ETF interest, but investors should watch key support and resistance levels carefully.
XRP could reach an average of $26.50 by 2030, driven by growing adoption, institutional interest, and market expansion.
CoinPedia has been delivering accurate and timely cryptocurrency and blockchain updates since 2017. All content is created by our expert panel of analysts and journalists, following strict Editorial Guidelines based on E-E-A-T (Experience, Expertise, Authoritativeness, Trustworthiness). Every article is fact-checked against reputable sources to ensure accuracy, transparency, and reliability. Our review policy guarantees unbiased evaluations when recommending exchanges, platforms, or tools. We strive to provide timely updates about everything crypto & blockchain, right from startups to industry majors.
All opinions and insights shared represent the author’s own views on current market conditions. Please do your own research before making investment decisions. Neither the writer nor the publication assumes responsibility for your financial choices.
Sponsored content and affiliate links may appear on our site. Advertisements are marked clearly, and our editorial content remains entirely independent from our ad partners.
According to HTF Market Intelligence, the Global Web3 Gaming Guilds market to witness a CAGR of 18% during the forecast period (2025-2030). The Latest Released Web3 Gaming Guilds Market Research assesses the future growth potential of the Web3 Gaming Guilds market and provides information and useful statistics on market structure and size.
This report aims to provide market intelligence and strategic insights to help decision-makers make sound investment decisions and identify potential gaps and growth opportunities. Additionally, the report identifies and analyses the changing dynamics and emerging trends along with the key drivers, challenges, opportunities and constraints in the Web3 Gaming Guilds market. The Web3 Gaming Guilds market size is estimated to increase by USD at a CAGR of 18% by 2030. The report includes historic market data from 2025 to 2030. The Current market value is pegged at USD .
Download Sample Report PDF (Including Full TOC, Table & Figures) @ https://www.htfmarketintelligence.com/sample-report/global-web3-gaming-guilds-market?utm_source=Tarusha_OpenPR&utm_id=Tarusha
The Major Players Covered in this Report: The key players profiled in the study are Yield Guild Games (Philippines), Avocado Guild (Philippines), Good Games Guild (Australia), Myco (USA), MetaGamers Guild (USA), GuildFi (Thailand), ChainGuardians (USA), The Sandbox (Hong Kong), Illuvium (Australi
Definition:
Web3 Gaming Guilds are decentralized communities of gamers, asset holders, and developers who collaborate within blockchain-based gaming ecosystems. These guilds acquire NFTs, in-game assets, and digital land, then lend them to players under revenue-sharing models. They enable wider participation in play-to-earn gaming by lowering entry costs and promoting community-driven governance. Web3 gaming guilds operate through tokenized incentives, DAO structures, smart contracts, and transparent reward mechanisms. They provide training, gameplay strategies, tournaments, and mentorship to enhance member performance. As blockchain gaming evolves, guilds play a key role in asset liquidity, economic sustainability, and ecosystem growth. They also partner with game developers for early asset access and community building. With interoperable NFTs, cross-game economies, and decentralized identity, Web3 guilds reshape digital ownership and the future of virtual gaming economies.
Market Trends:
• Growth of blockchain-based play-to-earn (P2E) gaming.
• DAO-based guild governance structures.
• Tokenization of in-game assets and guild reward systems.
• Integration of multi-chain gaming ecosystems.
• Increasing use of AI-based guild management tools.
Market Drivers:
• Rise of digital ownership and decentralized gaming models.
• Demand for community-driven gaming ecosystems.
• Strong investment in blockchain gaming projects.
• Growing global interest in monetizable gaming.
• Cross-border earning opportunities for players.
Market Opportunities:
• Expansion of guild-owned NFT asset portfolios.
• Development of Web3 gaming scholarship programs.
• Partnerships with blockchain game studios.
• Global onboarding of new gamers into decentralized economies.
• Revenue streams through staking, lending, and in-g
Market Challenges:
• Volatility of cryptocurrency rewards.
• Quality issues with many Web3 game titles.
• Governance conflicts within decentralized guilds.
• Security threats like NFT hacks and rug pulls.
• Scalability issues in some blockchain networks.
Market Restraints:
• Regulatory uncertainty around crypto-based gaming.
• Decline of unsustainable P2E economic models.
• High transaction fees on certain chains.
• Limited mainstream adoption of Web3 gaming.
• Public skepticism toward crypto gaming ecosystems.
• Dominating Region:
North America
• Fastest-Growing Region:
Asia Pacific
Get Access to Statistical Data, Charts & Key Players’ Strategies @ https://www.htfmarketintelligence.com/enquiry-before-buy/global-web3-gaming-guilds-market?utm_source=Tarusha_OpenPR&utm_id=Tarusha
The titled segments and sub-sections of the market are illuminated below:
In-depth analysis of Web3 Gaming Guilds market segments by Types: by Type (DAO-Based Guilds, Community-Driven Guilds, Hybrid Guilds)
Detailed analysis of Web3 Gaming Guilds market segments by Applications: by Application (NFT Gaming, Play-to-Earn Games, Game Development Support)
Major Key Players of the Market: The key players profiled in the study are Yield Guild Games (Philippines), Avocado Guild (Philippines), Good Games Guild (Australia), Myco (USA), MetaGamers Guild (USA), GuildFi (Thailand), ChainGuardians (USA), The Sandbox (Hong Kong), Illuvium (Australi
Geographically, the detailed analysis of consumption, revenue, market share, and growth rate of the following regions:
– The Middle East and Africa (South Africa, Saudi Arabia, UAE, Israel, Egypt, etc.)
– North America (United States, Mexico & Canada)
– South America (Brazil, Venezuela, Argentina, Ecuador, Peru, Colombia, etc.)
– Europe (Turkey, Spain, Turkey, Netherlands Denmark, Belgium, Switzerland, Germany, Russia UK, Italy, France, etc.)
– Asia-Pacific (Taiwan, Hong Kong, Singapore, Vietnam, China, Malaysia, Japan, Philippines, Korea, Thailand, India, Indonesia, and Australia).
Objectives of the Report:
– -To carefully analyse and forecast the size of the Web3 Gaming Guilds market by value and volume.
– -To estimate the market shares of major segments of the Web3 Gaming Guilds market.
– -To showcase the development of the Web3 Gaming Guilds market in different parts of the world.
– -To analyse and study micro-markets in terms of their contributions to the Web3 Gaming Guilds market, their prospects, and individual growth trends.
– -To offer precise and useful details about factors affecting the growth of the Web3 Gaming Guilds market.
– -To provide a meticulous assessment of crucial business strategies used by leading companies operating in the Web3 Gaming Guilds market, which include research and development, collaborations, agreements, partnerships, acquisitions, mergers, new developments, and product launches.
Global Web3 Gaming Guilds Market Breakdown by Application (NFT Gaming, Play-to-Earn Games, Game Development Support) by Type (DAO-Based Guilds, Community-Driven Guilds, Hybrid Guilds) by Platform (Cross-Game Guilds, Single-Game Guilds) and by Geography (North America, LATAM, West Europe, Central & Eastern Europe, Northern Europe, Southern Europe, East Asia, Southeast Asia, South Asia, Central Asia, Oceania, MEA)
Check for discount (10-30%) on Immediate Purchase @ https://www.htfmarketintelligence.com/request-discount/global-web3-gaming-guilds-market?utm_source=Tarusha_OpenPR&utm_id=Tarusha
Key takeaways from the Web3 Gaming Guilds market report:
– Detailed consideration of Web3 Gaming Guilds market-particular drivers, Trends, constraints, Restraints, Opportunities, and major micro markets.
– Comprehensive valuation of all prospects and threats in the
– In-depth study of industry strategies for growth of the Web3 Gaming Guilds market-leading players.
– Web3 Gaming Guilds market latest innovations and major procedures.
– Favourable dip inside Vigorous high-tech and market latest trends remarkable the Market.
– Conclusive study about the growth conspiracy of Web3 Gaming Guilds market for forthcoming years.
Major questions answered:
– What are influencing factors driving the demand for Web3 Gaming Guilds near future?
– What is the impact analysis of various factors in the Global Web3 Gaming Guilds market growth?
– What are the recent trends in the regional market and how successful they are?
– How feasible is Web3 Gaming Guilds market for long-term investment?
Buy Latest Edition of Market Study Now @ https://www.htfmarketintelligence.com/buy-now?format=1&report=19966?utm_source=Tarusha_OpenPR&utm_id=Tarusha
Major highlights from Table of Contents:
Web3 Gaming Guilds Market Study Coverage:
– It includes major manufacturers, emerging player’s growth story, and major business segments of Web3 Gaming Guilds Market – Global Trend and Growth Outlook to 2033 market, years considered, and research objectives. Additionally, segmentation on the basis of the type of product, application, and technology.
– Web3 Gaming Guilds Market – Global Trend and Growth Outlook to 2033 Market Executive Summary: It gives a summary of overall studies, growth rate, available market, competitive landscape, market drivers, trends, and issues, and macroscopic indicators.
– Web3 Gaming Guilds Market Production by Region Web3 Gaming Guilds Market Profile of Manufacturers-players are studied on the basis of SWOT, their products, production, value, financials, and other vital factors.
Key Points Covered in Web3 Gaming Guilds Market Report:
– Web3 Gaming Guilds Overview, Definition and Classification Market drivers and barriers
– Web3 Gaming Guilds Market Competition by Manufacturers
– Web3 Gaming Guilds Capacity, Production, Revenue (Value) by Region (2025-2030)
– Web3 Gaming Guilds Supply (Production), Consumption, Export, Import by Region (2025-2030)
– Web3 Gaming Guilds Production, Revenue (Value), Price Trend by Type {by Type (DAO-Based Guilds, Community-Driven Guilds, Hybrid Guilds)}
– Web3 Gaming Guilds Market Analysis by Application {by Application (NFT Gaming, Play-to-Earn Games, Game Development Support)}
– Web3 Gaming Guilds Manufacturers Profiles/Analysis Web3 Gaming Guilds Manufacturing Cost Analysis, Industrial/Supply Chain Analysis, Sourcing Strategy and Downstream Buyers, Marketing
– Strategy by Key Manufacturers/Players, Connected Distributors/Traders Standardization, Regulatory and collaborative initiatives, Industry road map and value chain Market Effect Factors Analysis.
Thanks for reading this article; you can also get individual chapter-wise sections or region-wise report versions like North America, MINT, BRICS, G7, Western / Eastern Europe, or Southeast Asia. Also, we can serve you with customized research services as HTF MI holds a database repository that includes public organizations and Millions of Privately held companies with expertise across various Industry domains.
Contact Us:
Nidhi Bhawsar (PR & Marketing Manager)
HTF Market Intelligence Consulting Private Limited
Phone: +15075562445
sales@htfmarketintelligence.com
Connect with us on LinkedIn | Facebook | Twitter
About Author:
HTF Market Intelligence Consulting is uniquely positioned to empower and inspire with research and consulting services to empower businesses with growth strategies, by offering services with extraordinary depth and breadth of thought leadership, research, tools, events, and experience that assist in decision-making.
This release was published on openPR.