The main category of All News Articles.
You can use the search box below to find what you need.
[wd_asp id=1]
The main category of All News Articles.
You can use the search box below to find what you need.
[wd_asp id=1]
The Pound is in a positive trend against the Yen. The pair has rallied about 3.5% from early November lows, although the rally has stalled this week, with bulls failing to find follow-through beyond the 2076.35 area.
The fundamental context has been mixed. On the one hand, investors have been relieved by the tax-raising UK budget and the positive services activity figures released on Wednesday.
On the other hand, the reiterating warnings of Japanese officials against excessive Yen weakness have kept Yen sellers on their toes. Earlier today, it was Cabinet Secretary Minoru Kihara who pledged to take the appropriate steps to protect the Yen against excessive and disorderly volatility.
Recent price action shows the pair moving within an ascending triangle, with its top at the mentioned 207.35 level. Triangles are often continuation patterns, and in this case, it would point to a bullish outcome.
On the upside, above the mentioned 207.35 level, the target is the 2024 peak, which coincides with the 127.2% Fibonacci extension of the November 20-26 rally at the 208.15 area. Further up, the 161.8% extension of the same cycle is at 209.15. The triangle’s measured target is at 210.30.
A bearish reaction, on the other hand, would find support at the base of the triangle, now at the 205.85 area ahead of the intraweek low of 205.20 and the November 21 low, at 204.30.
The table below shows the percentage change of Japanese Yen (JPY) against listed major currencies this week. Japanese Yen was the strongest against the US Dollar.
| USD | EUR | GBP | JPY | CAD | AUD | NZD | CHF | |
|---|---|---|---|---|---|---|---|---|
| USD | -0.48% | -0.83% | -0.79% | -0.23% | -1.19% | -0.69% | -0.03% | |
| EUR | 0.48% | -0.35% | -0.32% | 0.25% | -0.71% | -0.21% | 0.45% | |
| GBP | 0.83% | 0.35% | 0.31% | 0.61% | -0.36% | 0.14% | 0.80% | |
| JPY | 0.79% | 0.32% | -0.31% | 0.56% | -0.42% | 0.09% | 0.75% | |
| CAD | 0.23% | -0.25% | -0.61% | -0.56% | -1.01% | -0.45% | 0.19% | |
| AUD | 1.19% | 0.71% | 0.36% | 0.42% | 1.01% | 0.51% | 1.17% | |
| NZD | 0.69% | 0.21% | -0.14% | -0.09% | 0.45% | -0.51% | 0.66% | |
| CHF | 0.03% | -0.45% | -0.80% | -0.75% | -0.19% | -1.17% | -0.66% |
The heat map shows percentage changes of major currencies against each other. The base currency is picked from the left column, while the quote currency is picked from the top row. For example, if you pick the Japanese Yen from the left column and move along the horizontal line to the US Dollar, the percentage change displayed in the box will represent JPY (base)/USD (quote).
Austin, Texas, Dec. 05, 2025 (GLOBE NEWSWIRE) — Nutricosmetics Market Size & Growth Analysis:
According to SNS Insider, the Nutricosmetics Market size is estimated at USD 8.28 Billion in 2025 and is projected to reach USD 15.36 Billion by 2033, growing at a CAGR of 8.07% during 2026-2033. Growing consumer awareness of the connection between nutrition, appearance, and long-term wellness continues to fuel adoption across global markets. Enhanced functional ingredient research, convenience-driven supplement formats, and rising focus on preventive beauty support steady market expansion.
The United States represents one of the most dynamic regional markets. The U.S. Nutricosmetics Market is expanding rapidly, driven by strong demand for collagen supplements, rising popularity of personalized nutrition programs, and widespread e-commerce convenience. Growth is also supported by increased interest in anti-aging solutions, clean-label formulations, and functional beauty products that complement topical skincare routines.
Get a Sample Report of Nutricosmetics Market: https://www.snsinsider.com/sample-request/8912
Major Companies in the Nutricosmetics Market Profiled in the Report:
Nutricosmetics Market Expansion is Driven by Holistic Beauty and Wellness Trends Globally
Growing customer demand for holistic health and beauty products that address issues with skin, hair, and aging from the inside out is the main driver of the worldwide nutricosmetics market. Consumers are being encouraged to embrace functional foods and dietary supplements enhanced with collagen, vitamins, and antioxidants as a result of growing awareness of the connection between nutrition, wellness, and attractiveness. The demand for ingestible beauty products that promote skin hydration, elasticity, and anti-aging benefits has increased due to the rising prevalence of lifestyle-related problems such stress, poor food, and pollution.
Regulatory Gaps and Efficacy Concerns Can Limit Market Expansion Globally
The lack of uniform regulatory frameworks across nations, low consumer knowledge in developing nations, and doubts about the effectiveness of products are some of the challenges facing the worldwide nutricosmetics market. Brand credibility is hampered by inconsistent clinical validation and disparate ingredient approval procedures. Furthermore, market expansion and long-term customer trust are hampered by fierce competition and difficulties preserving component stability, bioavailability, and formulation transparency.
Segmentation Analysis:
By Product Type
Skin-focused (collagen, hyaluronic acid, skin-brightening agents) Solid Form dominated with 46.45% in 2025E due to high consumer demand for anti-aging, hydration, and skin-repair benefits. Hair & Nail (biotin, MSM, keratin boosters) is expected to grow at the fastest CAGR of 8.85% from 2026 to 2033 driven by biotin, MSM, and keratin boosters, is expected to grow at the fastest CAGR, fueled by rising concerns about hair loss, stress-induced damage, and a growing male grooming and wellness trend.
By Form
Capsules / Tablets dominated with 38.89% in 2025E due to their convenience, longer shelf life, and precise dosage delivery. Gummies & Chewables is expected to grow at the fastest CAGR of 10.29% from 2026 to 2033 driven by their taste appeal, ease of consumption, and growing popularity among younger consumers.
By Distribution Channel
E-commerce / Direct-to-Consumer (DTC) dominated with 38.65% in 2025E driven by growing digital adoption, personalized marketing, and the convenience of online purchasing. It is also expected to grow at the fastest CAGR of 8.49% from 2026 to 2033 as brands leverage AI-driven personalization, subscription models, and influencer marketing to enhance engagement and global reach, particularly among tech-savvy and health-conscious consumers.
For a Personalized Briefing with Our Industry Analysts, Connect Now: https://www.snsinsider.com/request-analyst/8912
By End-User
Women (general) dominated with 63.86% in 2025E driven by high awareness of beauty-from-within solutions and a strong preference for products targeting skin, hair, and anti-aging benefits. Men (grooming-focused) is expected to grow at the fastest CAGR of 10.25% from 2026 to 2033 fueled by rising interest in appearance, hair and skin health, and wellness routines, supported by increased marketing of male-specific nutricosmetic formulations.
Regional Insights:
In 2025E, North America holds a 20.33% share of the global nutricosmetics market, driven by strong consumer awareness of wellness and beauty-from-within trends. The market benefits from high adoption of collagen-based and anti-aging supplements, supported by a well-established nutraceutical infrastructure.
In 2025E, Asia Pacific dominates the global nutricosmetics market with a 41.75% share and is projected to grow at the fastest CAGR of 8.53% from 2026–2033. The region’s leadership is fueled by rising beauty consciousness, rapid urbanization, and expanding middle-class populations.
Recent Developments:
Exclusive Sections of the Report (The USPs):
Purchase Single User PDF of Nutricosmetics Market Report: https://www.snsinsider.com/checkout/8912
Nutricosmetics Market Report Scope
| Report Attributes | Details |
| Market Size in 2025E | USD 8.28 Billion |
| Market Size by 2033 | USD 15.36 Billion |
| CAGR | CAGR of 8.07% From 2026 to 2033 |
| Base Year | 2025E |
| Forecast Period | 2026-2033 |
| Historical Data | 2022-2024 |
| Key Segments | • By Product Type (Skin-focused (collagen, hyaluronic acid, skin-brightening agents), Hair & Nail (biotin, MSM, keratin boosters), Anti-aging & Beauty-from-within (peptides, antioxidants), and Gut-to-skin / Probiotic formulations (probiotics, prebiotics)) • By Form (Capsules / Tablets, Powders & Sachets, Liquid shots / Drops, and Gummies & Chewables) • By Distribution Channel (E-commerce / Direct-to-Consumer (DTC), Pharmacies & Drugstores, Specialty Beauty Retailers (salons, beauty boutiques), and Supermarkets / Hypermarkets) • By End User (Women (general), Men (grooming-focused), Age-based (Young adults / Millennials vs. Seniors), and Health-conscious / Wellness seekers) |
| Regional Analysis/Coverage | North America (US, Canada), Europe (Germany, UK, France, Italy, Spain, Russia, Poland, Rest of Europe), Asia Pacific (China, India, Japan, South Korea, Australia, ASEAN Countries, Rest of Asia Pacific), Middle East & Africa (UAE, Saudi Arabia, Qatar, South Africa, Rest of Middle East & Africa), Latin America (Brazil, Argentina, Mexico, Colombia, Rest of Latin America). |
Related Reports
Women’s Health and Beauty Supplements Market
Nutritional Supplements Market
About Us:
SNS Insider is one of the leading market research and consulting agencies that dominates the market research industry globally. Our company’s aim is to give clients the knowledge they require in order to function in changing circumstances. In order to give you current, accurate market data, consumer insights, and opinions so that you can make decisions with confidence, we employ a variety of techniques, including surveys, video talks, and focus groups around the world.

Meme coin breaks key technical level as institutional-sized trades dominate Wednesday session amid ETF filing buzz.
DOGE dropped from $0.1522 to $0.1477 across the session, marking a 3% decline within a tight $0.0070 range.
The breakdown occurred at peak volume, with 830.7M DOGE traded, representing 174% above the 24-hour average.
Attempts to rebound toward $0.1483 were sold immediately, with 14.4M-volume spikes repeatedly rejected. Current consolidation remains shallow at best, and price continues to oscillate within the lower band of the breakdown zone.
Important DisclaimersFXEmpire is owned and operated by Empire Media Network LTD., Company Registration Number 514641786, registered at 7 Jabotinsky Road, Ramat Gan 5252007, Israel. The content provided on this website includes general news and publications, our personal analysis and opinions, and materials provided by third parties. This content is intended for educational and research purposes only. It does not constitute, and should not be interpreted as, a recommendation or advice to take any action, including making any investment or purchasing any product. Before making any financial decision, you should conduct your own due diligence, exercise your own discretion, and consult with competent advisors. The content on this website is not personally directed to you, and we do not take into account your individual financial situation or needs. The information contained on this website is not necessarily provided in real time, nor is it guaranteed to be accurate. Prices displayed may be provided by market makers and not by exchanges. Any trading or other financial decision you make is entirely your own responsibility, and you must not rely solely on any information provided through the website. FXEmpire does not provide any warranty regarding the accuracy, completeness, or reliability of any information contained on the website and shall bear no responsibility for any trading losses you may incur as a result of using such information. The website may include advertisements and other promotional content. FXEmpire may receive compensation from third parties in connection with such content. FXEmpire does not endorse, recommend, or assume responsibility for the use of any third-party services or websites. Empire Media Network LTD., its employees, officers, subsidiaries, and affiliates shall not be liable for any loss or damage resulting from your use of the website or reliance on the information provided herein.Risk DisclaimersThis website contains information about cryptocurrencies, contracts for difference (CFDs), and other financial instruments, as well as about brokers, exchanges, and other entities trading in such instruments. Both cryptocurrencies and CFDs are complex instruments and involve a high risk of losing money. You should carefully consider whether you understand how these instruments work and whether you can afford to take the high risk of losing your money. FX Empire encourages you to conduct your own research before making any investment decision and to avoid investing in any financial instrument unless you fully understand how it works and the risks involved.
InsightAce Analytic Pvt. Ltd. announces the release of a market assessment report on the “Global Postbiotic Supplements Market – (By Type (Bacteria, Yeast), By Form (Soft gels, Capsules/Tablets, Powder/ Granules, Others), By Application (Personal Care and Cosmetics, Food and Beverages, Animal Feed, Pharmaceuticals, Others)), Trends, Industry Competition Analysis, Revenue and Forecast To 2034.”
According to the latest research by InsightAce Analytic, the Global Postbiotic Supplements Market is valued at USD 12.8 Bn in 2024, and it is expected to reach USD 36.3 Bn by the year 2034, with a CAGR of 11.0% during the forecast period of 2025-2034.
Get Free Access to Demo Report, Excel Pivot and ToC: https://www.insightaceanalytic.com/request-sample/2538
The postbiotic supplements market is experiencing notable growth, driven by increasing consumer awareness of preventive healthcare and the expanding application of bioactive compounds in functional nutrition. Postbiotics-metabolic byproducts generated through the fermentation of prebiotics by probiotics-are gaining recognition for their scientifically supported benefits, including the enhancement of immune function, promotion of gut health, and support in disease prevention. As a result, postbiotics are becoming integral components of holistic wellness and preventive healthcare strategies.
Market expansion is further propelled by the rising global demand for functional and health-oriented supplements, particularly in emerging economies, where evolving consumer lifestyles, heightened wellness consciousness, and a willingness to invest in premium nutritional products are evident. Adoption is especially strong among health-conscious individuals, athletes, and consumers seeking targeted nutritional interventions, reflecting a broader trend toward proactive health management.
Macroeconomic and demographic factors-such as increasing healthcare expenditures, the growing prevalence of chronic conditions including obesity, diabetes, and cardiovascular diseases, and rapid urbanization-also contribute to market growth. Furthermore, ongoing advancements in microbiome research and the accumulation of scientific validation for postbiotics are motivating food, nutraceutical, and pharmaceutical companies to incorporate these compounds into their product portfolios.
With continued innovation and reinforced scientific evidence, the postbiotic supplements market is anticipated to maintain its growth trajectory, establishing itself as a key segment within the functional nutrition and preventive healthcare sectors.
List of Prominent Players in the Postbiotic Supplements Market:
• Novachem Srl
• Cargill
• Probulin
• Korea Biopharm
• Archer-Daniels-Midland
• Sabinsa Corporation
• Postbiotica Srl
• Lactobio A/S
• MCLS
• AB-Biotics S.A
Expert Knowledge, Just a Click Away: https://calendly.com/insightaceanalytic/30min?month=2025-02
Market Dynamics
Drivers:
The global postbiotic supplements market is experiencing significant growth, primarily driven by rising demand for natural, safe, and sustainable feed and dietary additives across both human and animal nutrition segments. Increasing awareness of the health benefits of postbiotics-including enhanced digestive function, immune support, and overall physiological well-being-has contributed to their growing adoption.
In the livestock sector, the rising consumption of meat, poultry, and dairy products has intensified the need for effective feed solutions that promote animal health and productivity without reliance on antibiotics. Furthermore, regulatory initiatives advocating for antibiotic-free and environmentally sustainable feed alternatives have accelerated the uptake of postbiotic supplementation, positioning it as a preferred substitute for traditional additives.
Challenges:
Despite strong growth prospects, the market faces several challenges. High production costs associated with postbiotic supplements limit price competitiveness compared to conventional additives. Additionally, limited awareness among livestock producers and small-scale farmers regarding the benefits and functional mechanisms of postbiotics constrains broader adoption. Compliance with stringent regulatory standards, coupled with extended approval timelines for new formulations, further increases research and development expenditures and delays market entry. Collectively, these factors present operational and financial hurdles for manufacturers seeking to expand in both developed and emerging markets.
Regional Trends:
North America is expected to maintain a leading position in the global postbiotic supplements market, supported by advances in formulation technologies, widespread integration of postbiotics into functional foods and dietary supplements, and growing consumer focus on gut and immune health. Europe also represents a key market, driven by substantial investments from food, beverage, and pharmaceutical companies in postbiotic research and product innovation.
Meanwhile, the Asia-Pacific region is projected to experience rapid growth, fueled by rising disposable incomes, expanding middle-class populations, and increasing awareness of health and nutritional wellness. Collectively, these regional dynamics are anticipated to sustain a positive growth trajectory for the market over the forecast period.
Unlock Your GTM Strategy: https://www.insightaceanalytic.com/customisation/2538
Recent Developments:
• In Feb 2024, Sirio Pharma Co., Ltd. (Sirio), a worldwide producer of dietary supplements, is introducing BloomDays, an innovative postbiotic gummy product that is the first of its kind in the market. This product showcases EpiCor, a postbiotic ingredient developed by Cargill. BloomDays focuses on enhancing immune health and capitalizing on the expanding gut health market by leveraging Sirio’s expertise in development and manufacturing, together with the scientifically supported component, EpiCor.
• In May 2021, The U.S. Food and Drug Administration (FDA) sent a letter stating that they had no objections to Cargill’s GRAS notification for the use of EpiCor® postbiotic in specific foods and beverages. EpiCor® postbiotic is a desiccated yeast fermentate that has been demonstrated in clinical trials of dietary supplements to effectively regulate the gut microbiota and enhance immune system function.
Segmentation of Postbiotic Supplements Market-
By Type-
• Bacteria
• Yeast
By Form-
• Soft Gels
• Capsules/Tablets
• Powder/ Granules
• Others
By Application-
• Personal Care and Cosmetics
• Food and Beverages
• Animal Feed
• Pharmaceuticals
• Others
By Region-
North America-
• The US
• Canada
• Mexico
Europe-
• Germany
• The UK
• France
• Italy
• Spain
• Rest of Europe
Asia-Pacific-
• China
• Japan
• India
• South Korea
• South East Asia
• Rest of Asia Pacific
Latin America-
• Brazil
• Argentina
• Rest of Latin America
Middle East & Africa-
• GCC Countries
• South Africa
• Rest of the Middle East and Africa
View Overview Report: https://www.insightaceanalytic.com/report/postbiotics-supplements-market/2538
About Us:
InsightAce Analytic is a market research and consulting firm that enables clients to make strategic decisions. Our qualitative and quantitative market intelligence solutions inform the need for market and competitive intelligence to expand businesses. We help clients gain competitive advantage by identifying untapped markets, exploring new and competing technologies, segmenting potential markets and repositioning products. Our expertise is in providing syndicated and custom market intelligence reports with an in-depth analysis with key market insights in a timely and cost-effective manner.
Contact us:
InsightAce Analytic Pvt. Ltd.
Visit: https://www.insightaceanalytic.com/
Tel : +1 607 400-7072
Asia: +91 79 72967118
info@insightaceanalytic.com
This release was published on openPR.
Pi Network (PI) edges lower on Friday for the third consecutive day, approaching a local support trendline. The on-chain data suggests an increase in supply pressure as Centralized Exchanges (CEXs) experience a surge in inflows. Technically, the pullback in PI risks further losses, as the Moving Average Convergence Divergence (MACD) indicator is flashing a sell signal.
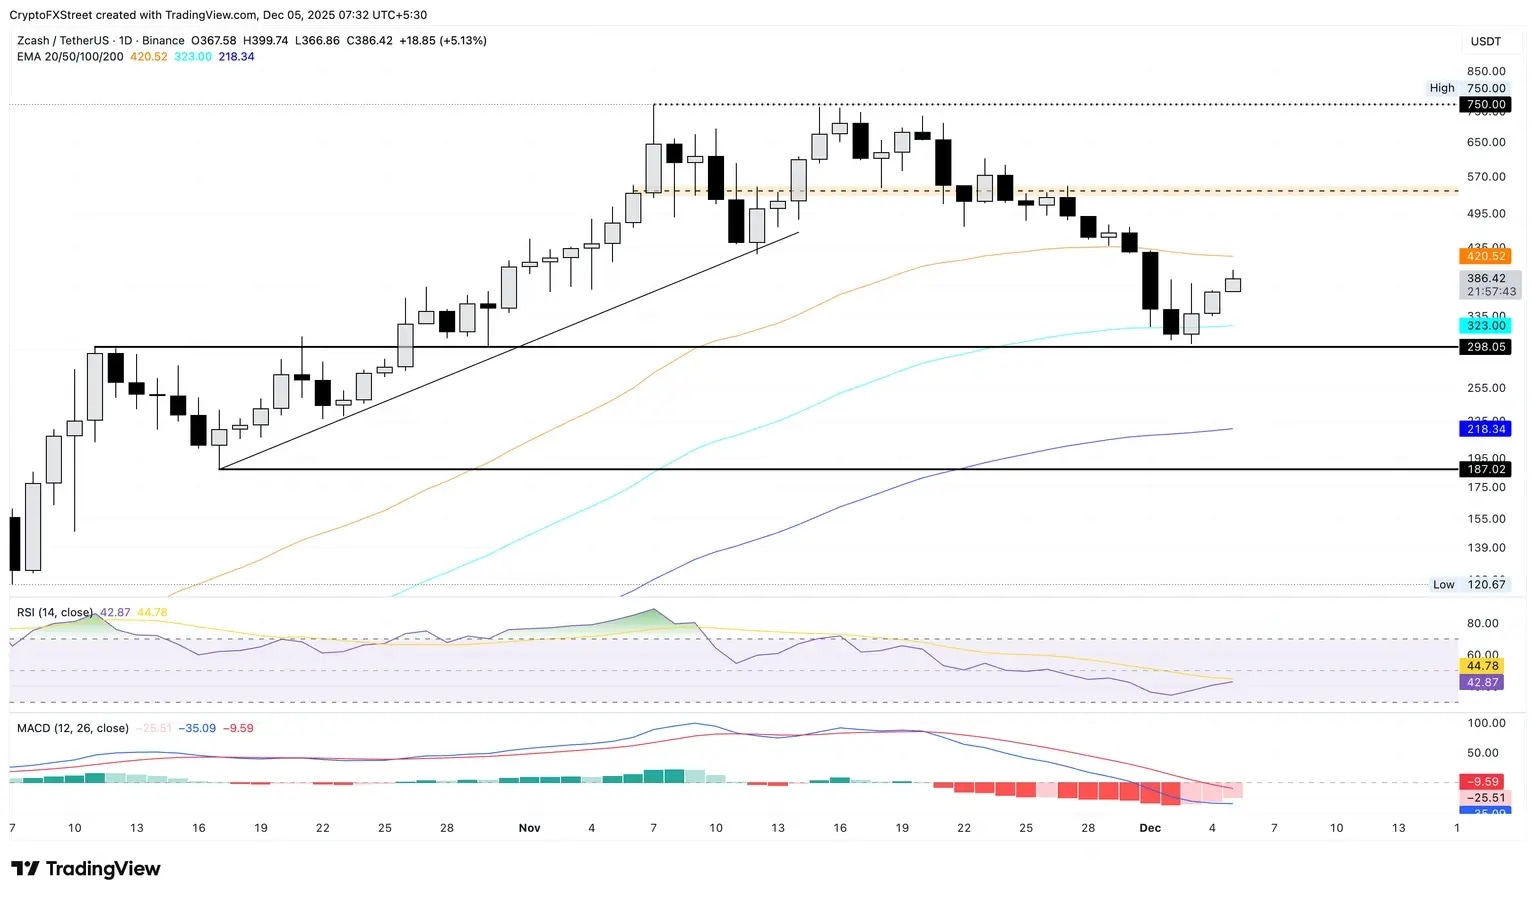
Zcash (ZEC), MYX Finance (MYX), and Dash (DASH) are the top-performing assets in the top 100 cryptocurrency list over the last 24 hours. The privacy coin leads the rally while MYX and DASH struggle to clear their 100-day Exponential Moving Averages (EMA).
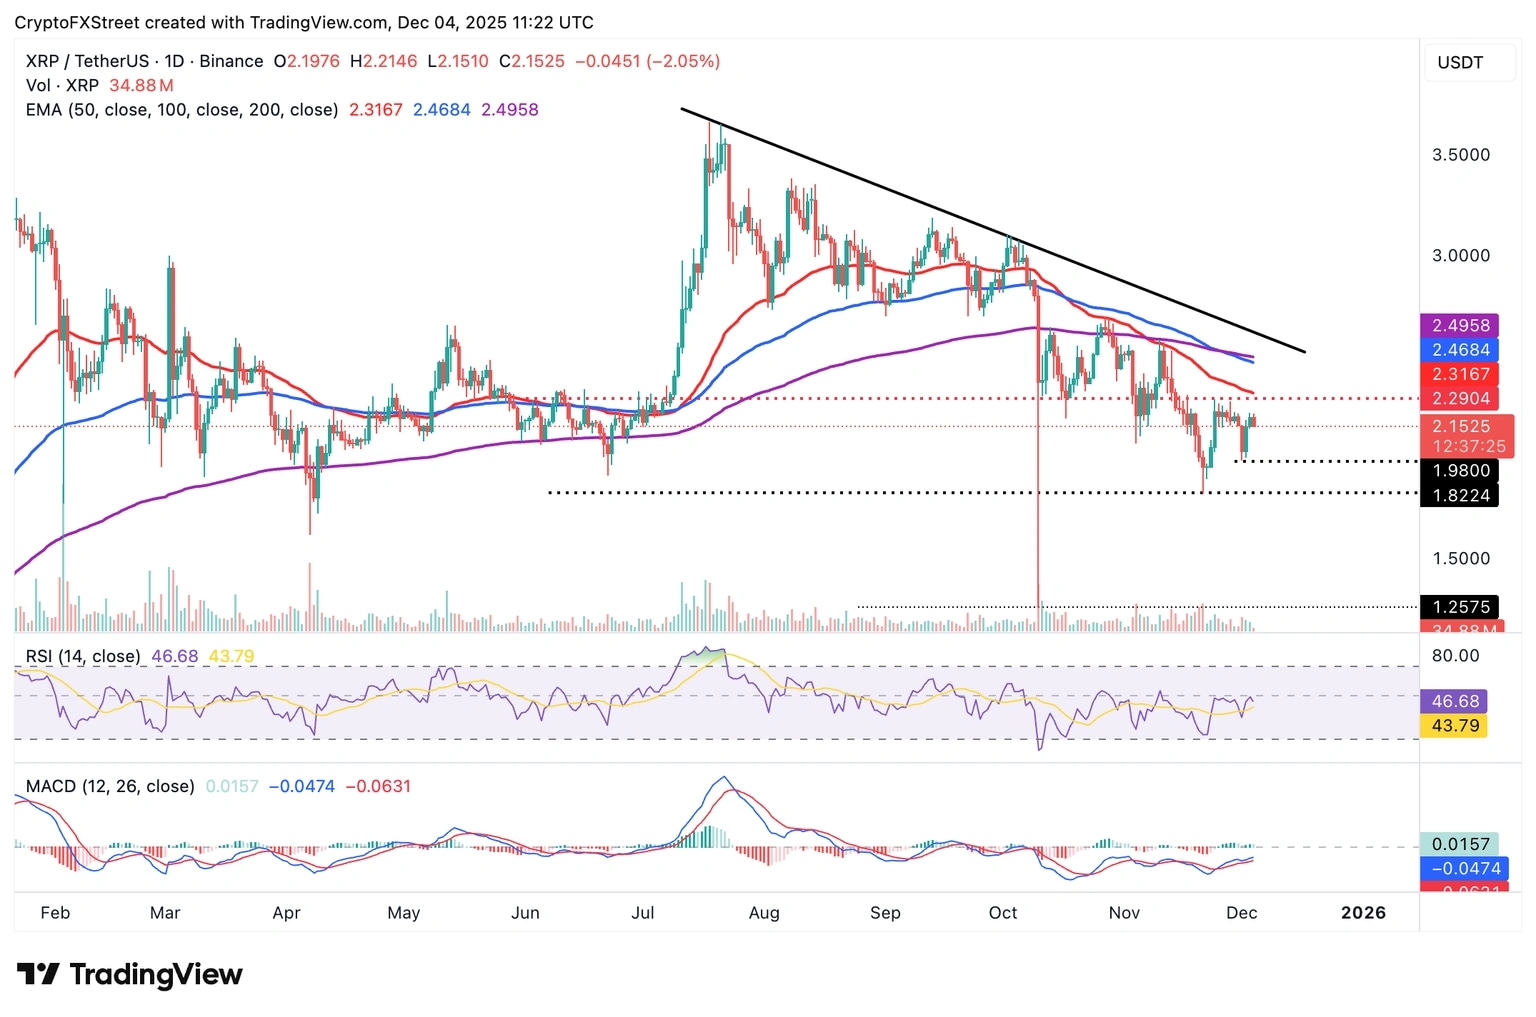
Ripple (XRP) is trading under pressure at the time of writing on Thursday, after bulls failed to break the short-term resistance at $2.22. The reversal may extend toward Monday’s low of $1.98, especially if risk-off sentiment persists in the broader cryptocurrency market.
Stock image.
Defying market optimism, Goldman Sachs Group sought to curb enthusiasm over copper’s record-breaking rally, saying the metal’s breakout above $11,000 a tonne is unlikely to last as global supplies remain adequate.
In a note to clients this week, Goldman analysts led by Aurelia Waltham argued that copper’s recent rally centres around “expectation of future market tightness, rather than current fundamentals,” adding that they do not expect prices at current levels to hold.
Albert Mackenzie, copper analyst at Benchmark Minerals, shared a similar view. “When you see an all-time high being broken, it tends to pull back or slow down,” he said in an interview with MINING.COM. Lately, however, “it just keeps on going up and up,” Mackenzie noted, pointing to several consecutive months of record-setting sessions.
The tamed expectations come at a time when copper had just set a new record high of $11,540 a ton on the London Metal Exchange, fueled by fears of a global supply squeeze as the metal continues to be shipped into the US ahead of potential tariffs.
Those concerns were heightened last week after trading house Mercuria Energy Group warned of the “extreme” dislocations in the current market.
“There’s growing recognition that ongoing US-bound flows could fuel shortages in China and other markets, even in a weakening demand environment,” Kostas Bintas, Mercuria’s head of metals, said during an industry event held in Shanghai last month.
“Demand is not good, there is a surplus — and the price going higher. There is a special dynamic,” he said, even predicting that non-US markets could even “be left without copper cathodes”.
Goldman’s analysts, however, have a different take. While they acknowledged the supply drain that is taking place, resulting in a higher copper price forecast for the first half of next year, the “critically low” inventories outside America could be avoided via higher regional premiums and tighter LME spreads.
“While our much smaller 2026 surplus of 160,000 tons moves the market closer to balanced, it means that we do not expect the global copper market to enter a shortage any time soon,” they wrote, adding that prices will be “constricted” in a range between $10,000-$11,000 a ton next year.
Copper has a long history of lofty predictions that have failed to materialize. And although disruptions at major mines through 2025 have tightened supply, growth in global demand has softened in recent months despite continued strength from sectors such as clean energy.
Looking ahead, Goldman said it does not see a global copper shortage until at least 2029, as demand is still forecast to be about half a million short of supply this year. A key factor, the bank noted, is the pivotal Chinese market, where consumption could slump by nearly 8% year-on-year in the fourth quarter.
Benchmark’s Mackenzie also casts doubt on the sustainability of a copper rally built on supply tightness. “I don’t necessarily know whether the narrative is entirely correct,” he said, suggesting that today’s fundamentals may not justify the exuberance driving the rally.
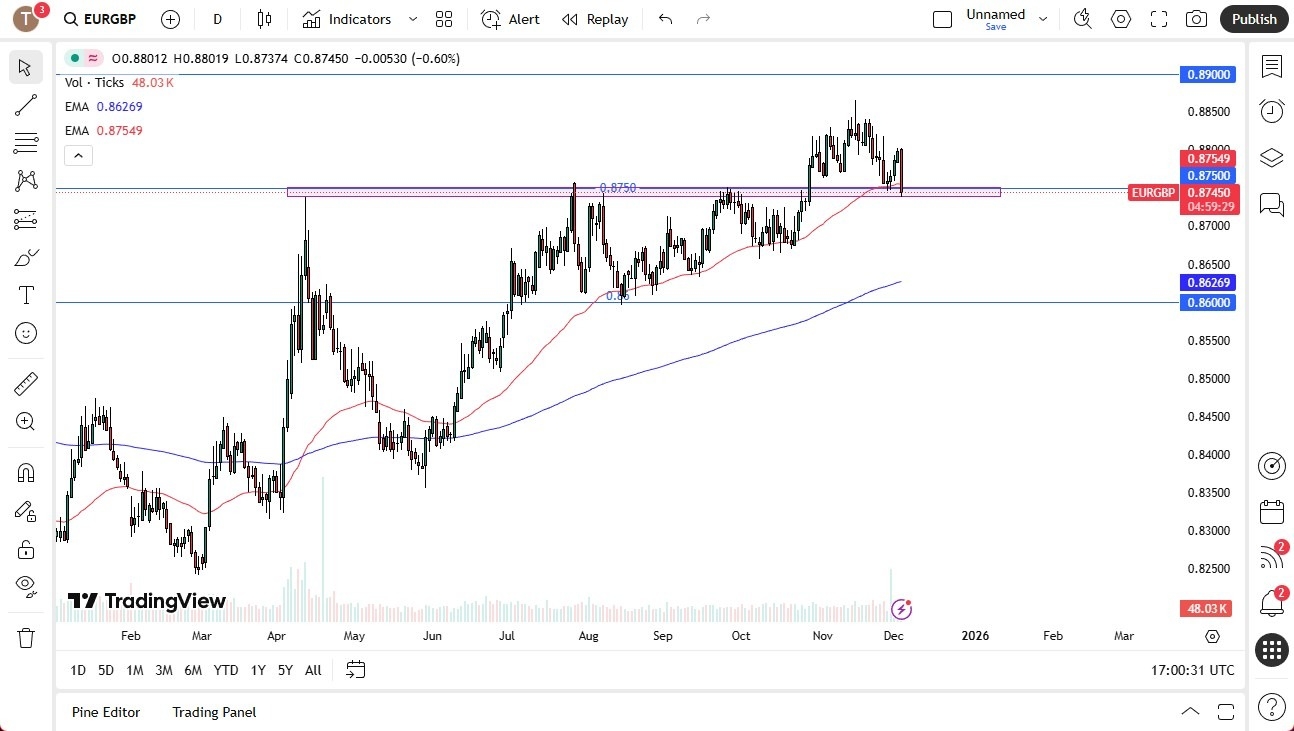
The Euro has fallen pretty significantly during the trading session here on Wednesday to test the 0.8750 level. This is an area where I expect to see a significant amount of support, and therefore, it’ll be interesting to see how this plays out.

We are hanging around the 50-day EMA and previous resistance. So, it all lines up for a potential setup, but we’ll have to wait and see. The size of the candlestick is pretty impressive, and it does suggest that perhaps the market is going to continue to see a little bit of downward pressure, but ultimately, I look at this as a market, so that if we can get a little bit of a bounce, then I think we will probably return back to the 0.88 level. Longer term, one would suspect that perhaps we could go to the 0.89 level based on the previous consolidation range and the measured move.
However, when you look at this from a longer-term perspective, and I mean multi-year, the 0.89 level is an area that’s been important a multitude of times. So even if we do turn around and rally from here, I’m not going to get married to the position. In fact, I probably would take profit somewhere near the 0.8850 level and see if we pull back.
That could be an excellent selling opportunity. We have already done that. So, the question is, did we put in a top? If we break down below 0.87, then I suspect we did, and we probably go much lower.
Ready to trade our daily forecast and analysis? Here’s a list of some of the top forex brokers UK to check out.
Christopher Lewis has been trading Forex and has over 20 years experience in financial markets. Chris has been a regular contributor to Daily Forex since the early days of the site. He writes about Forex for several online publications, including FX Empire, Investing.com, and his own site, aptly named The Trader Guy. Chris favours technical analysis methods to identify his trades and likes to trade equity indices and commodities as well as Forex. He favours a longer-term trading style, and his trades often last for days or weeks.
From dainty rose tea sets to smart kettles and tea-inspired fragrances, we’re rounding up unique gifts for tea lovers.
If you’re holiday shopping for someone who happens to love a cup of tea, consider giving them a gift that will make their daily routine all the more special.
For example, gift a MacKenzie Childs checkered tea kettle, a functional option for those with a playful kitchen aesthetic. There’s also a classic white Le Creuset kettle or a luxurious Breville smart kettle with brass finishes.
Matcha-lovers would surely appreciate a pack of ceremonial grade matcha, especially when paired with a ceramic matcha set and whisk.
You can send your loved one a Harry & David holiday tea set, complete with mugs, tea bags and more for under $80, or gift the host and hostess a set of tea they can enjoy after the party.
For those looking for something a little less literal, find tea-inspired candles and fragrances, like Le Labo’s The Matcha 26 eau de parfum or a bergamot and green tea candle at Anthropologie.
Shop all of this and more below!
By clicking on these shopping links, visitors will leave ABCNews.com and Goodmorningamerica.com, and these e-commerce sites are operated under different terms and privacy policies. ABC will receive a commission for purchases made through these links. SOME PRICES ARE DYNAMIC AND MAY CHANGE FROM THE DATE OF PUBLICATION. Have questions about ordering or a purchase? Click here.
For the person who loves to read over a cup of tea. This set features a collection of loose-leaf teas inspired by European café recipes.

The Harry & David Holiday Tea Gift Set comes with black tea bags, clover honey, a ceramic teapot and two ceramic mugs.

This 6-piece ceramic matcha tea set is an Etsy bestseller. It comes with a beautiful sage green bowl and chasen holder, plus a matcha whisk, a bamboo scoop, a scoop rest and a sifter.

If the person you’re gifting loves matcha, send them this Jade Leaf ceremonial grade matcha powder with 4.5 stars on Amazon and more than 100,000 reviews.

This is a great housewarming gift for the tea lover in your life.

A pretty, dainty tea set for a tea party.
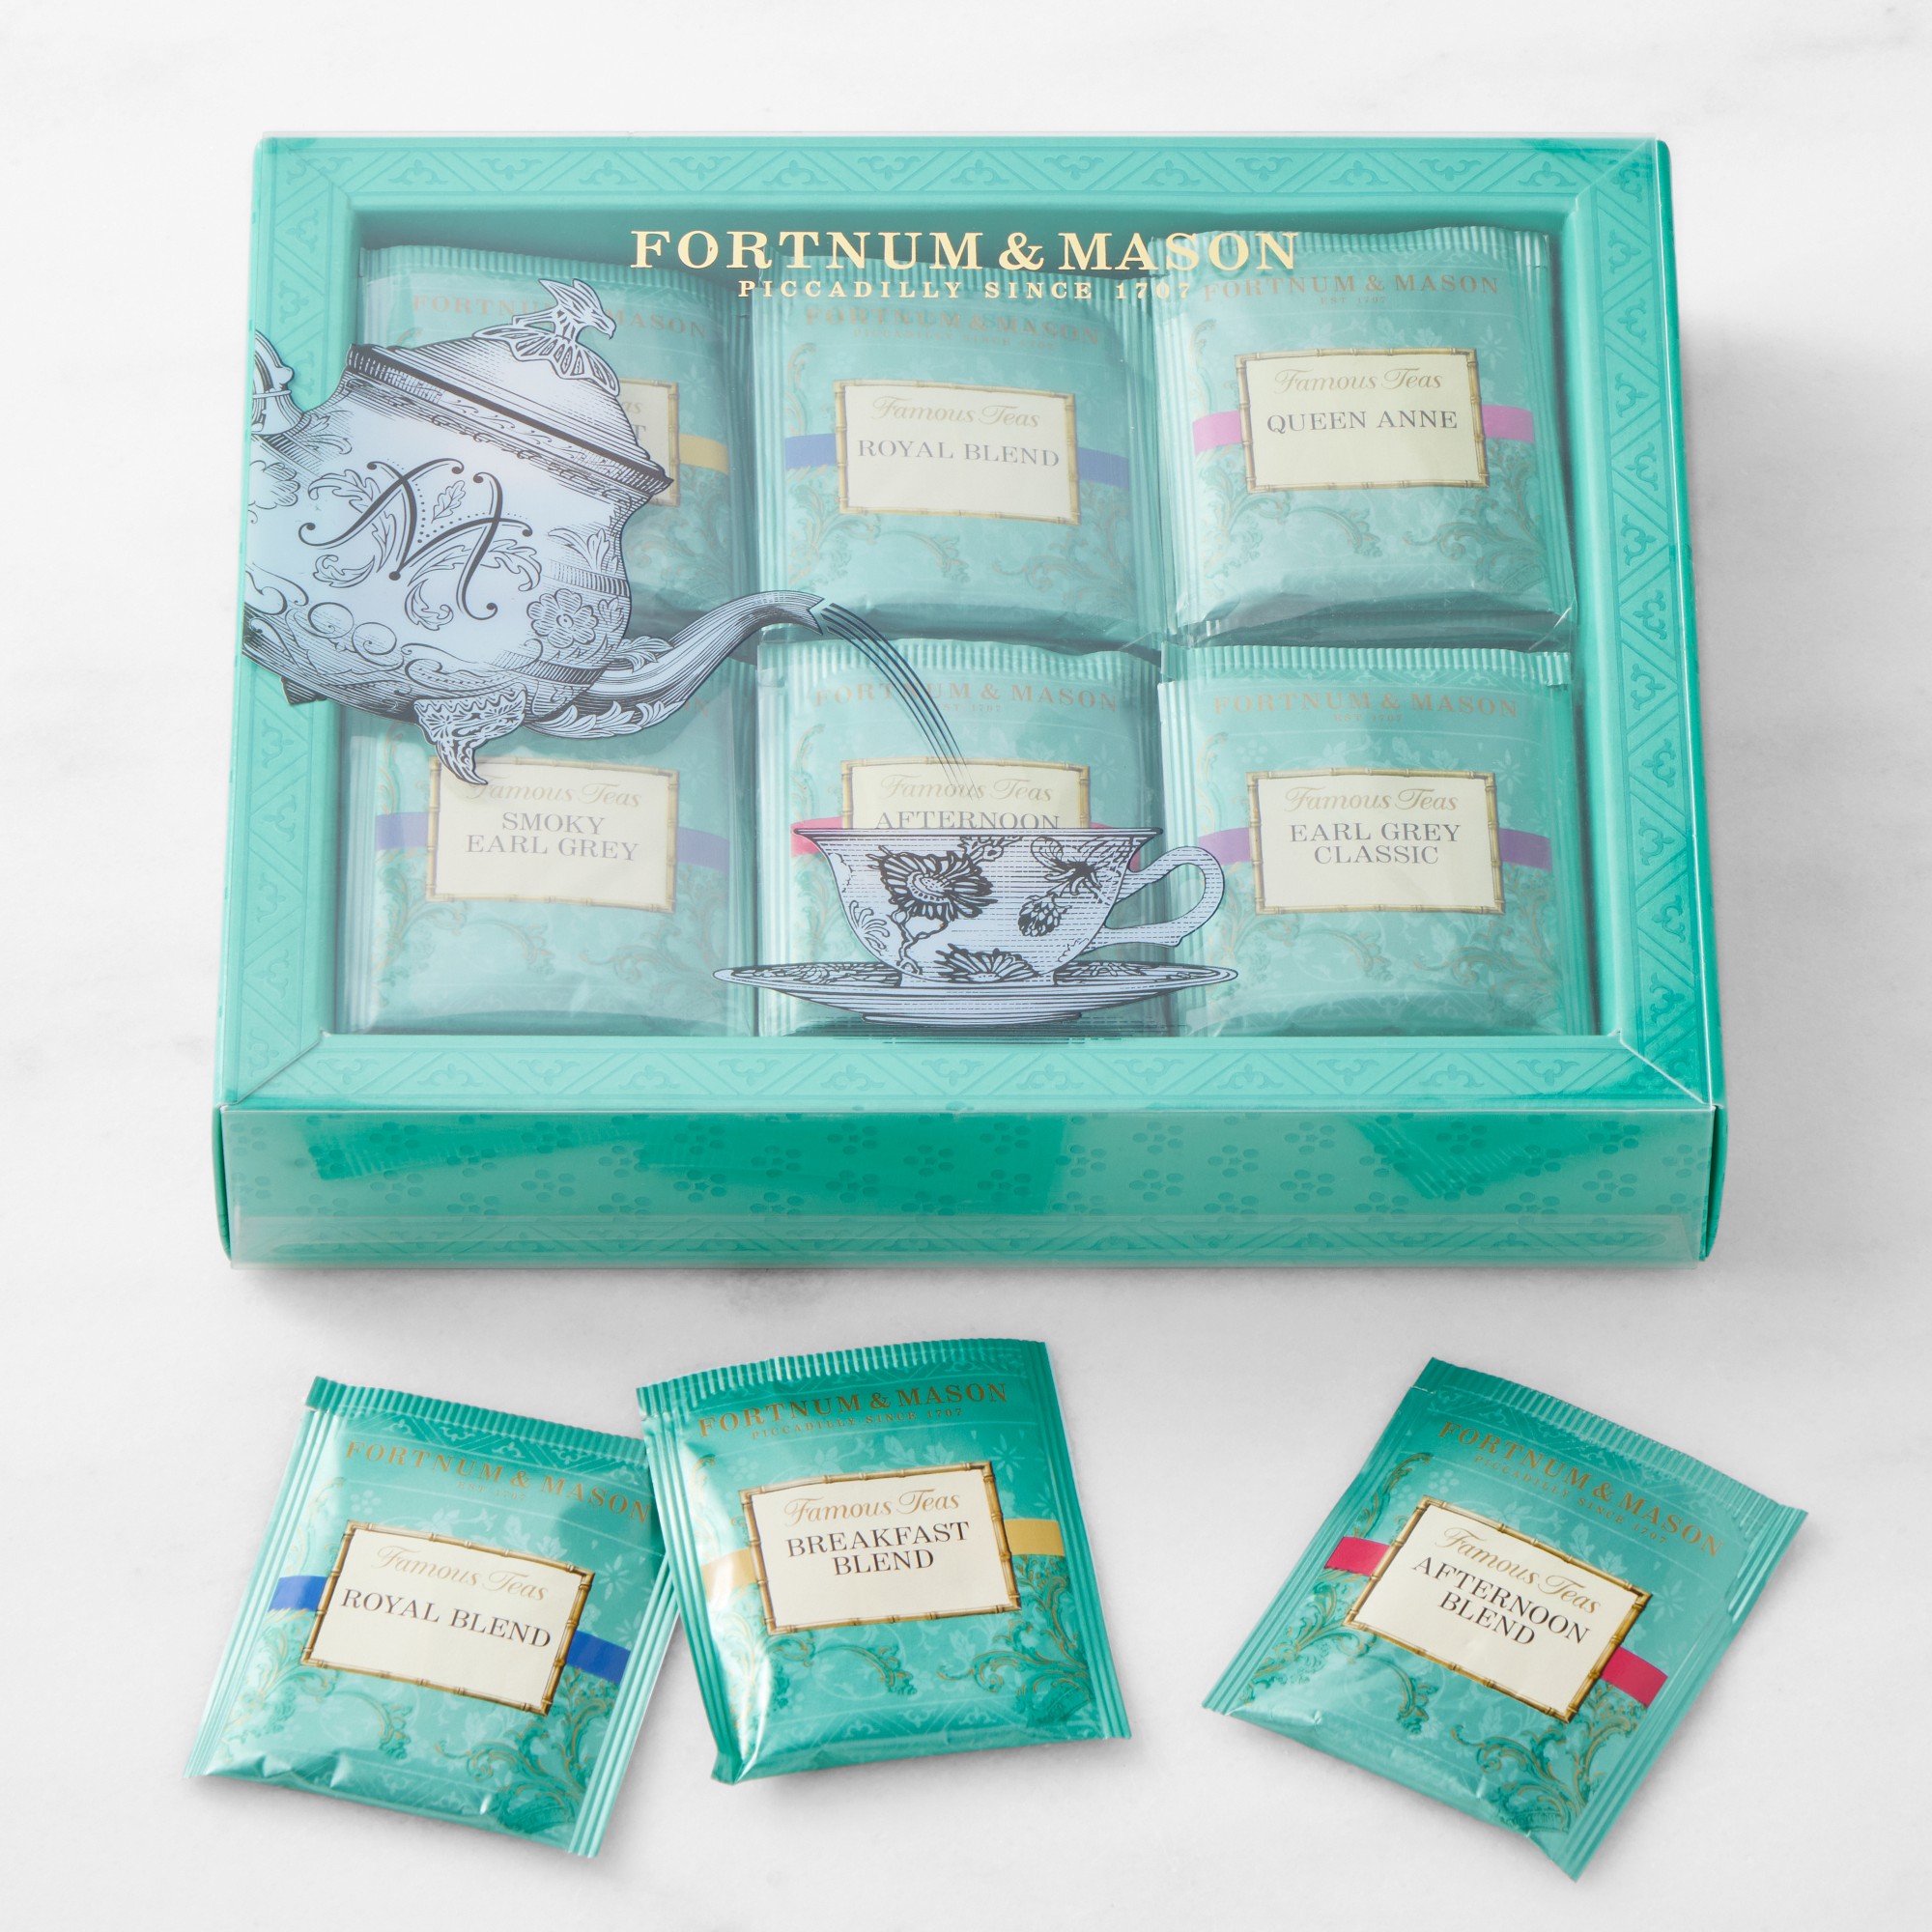
This Fortnum & Mason tea set includes six of the brand’s popular teas: Royal Blend Tea, Breakfast Blend Tea, Afternoon Blend Tea, Queen Anne Blend Tea, Earl Grey Classic Tea and Smoky Earl Grey Tea.

If they’re already stocked with tea, this cute Tea Tools Kit includes stainless steel tea tongs, a tea infuser and a honey dipper.

A luxurious tea kettle with an electronic heating system featuring settings for green and white tea, oolong tea, French-press coffee, black and herbal tea, and a boil setting.

A cute checked tea kettle that doubles as a kitchen accessory.
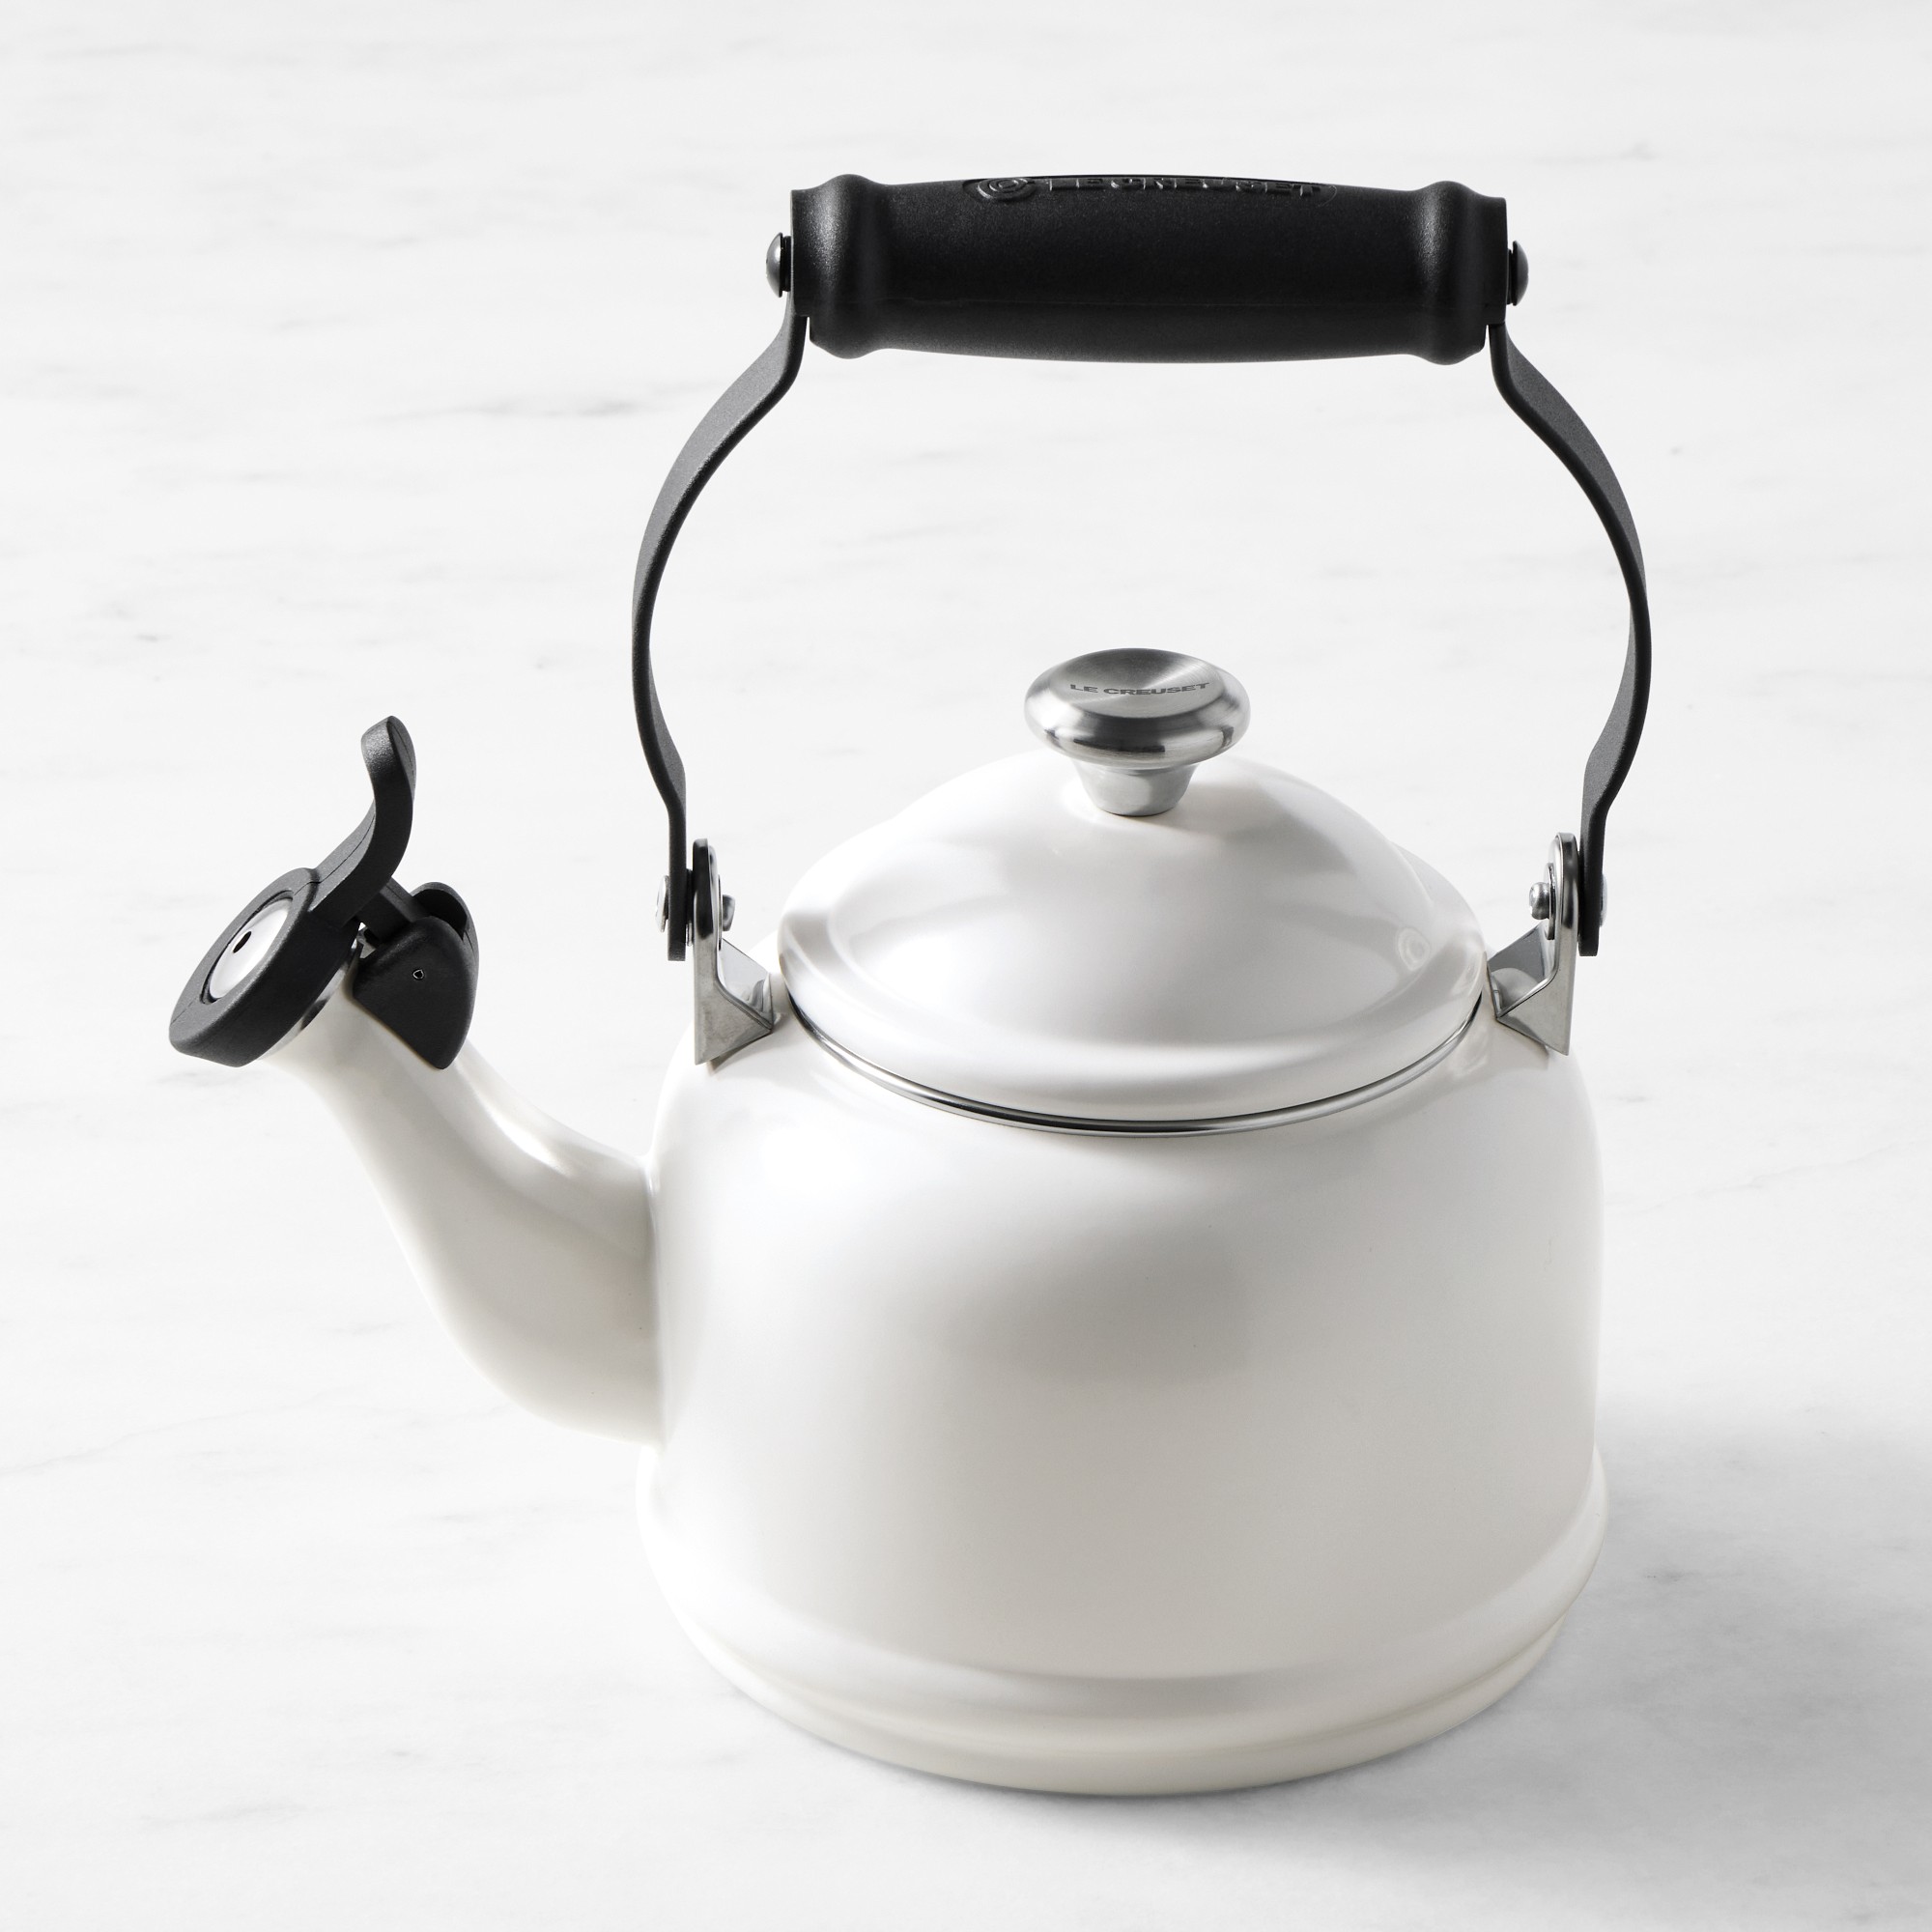
The Le Creuset Classic Demi Tea Kettle is available in multiple colors to best suit their kitchen, from a classic white to a deep agave, olive green and more.
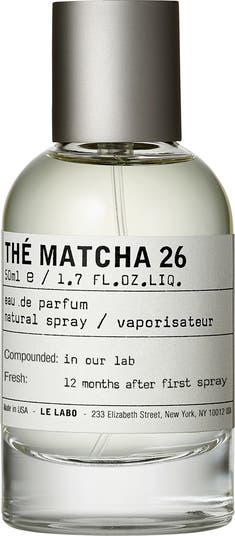
A less literal tea-themed gift. This unique Le Labo fragrance features notes of fig, bergamot, bitter orange, sesame, cedarwood, vetiver and matcha tea accord. “In the same way matcha tea is much more than just a drink in Japanese culture, THÉ MATCHA 26 is much more than a scent. It is a moment of introspection that offers a quiet inner celebration of grace and soulful beauty. A simple whiff takes us away from the hum of the outside and brings you back in,” its product description on Nordstrom reads.
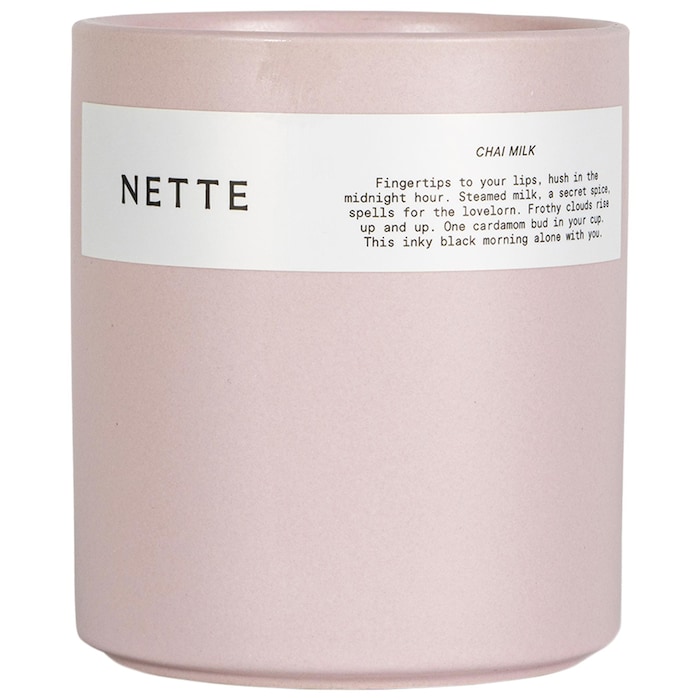
This warm and spicy Nette candle has notes of cardamom, cinnamon and steamed milk. Light it at home to create a cozy morning ambiance.

This room spray smells of bergamot orange and dried black tea leaves.

A refreshing bergamot mint tea candle they can keep in their kitchen.
Ethereum’s price movements in early December show a constructive rebound following a corrective phase in November. After retesting a descending trendline and reclaiming the short-term EMA cluster, ETH has stabilized near the $3,050 support zone. Maintaining this level could influence the next resistance tests around $3,400–$3,500. However, analysts caution that these scenarios are not guaranteed and depend on market participation and liquidity conditions.
ETH/USD has been in a corrective downtrend on the daily chart, with recent price action approaching a supply zone between $3,500 and $3,700. Supply zones represent areas where selling pressure historically outweighs buying, often causing price consolidation or pullbacks. The primary support below remains in the $2,400–$2,550 range, which was significant during Ethereum’s prior rally.
ETH/USD shows short-term bullish momentum toward $3.3k–$3.4k, but a drop below $2.95k could revisit $2.8k lows. Source: CyrilXBT via X
According to cryptocurrency analyst CyrilXBT, if ETH holds above the $3.0k–$3.05k zone during pullbacks, the price could push toward the $3.3k–$3.4k range. This perspective highlights the importance of the $3,050 level as a pivot for short-term bullish momentum. Nonetheless, failure to defend this support could lead to a retest of lower demand zones.
On the 4-hour chart, ETH has reclaimed the EMA ribbon—a cluster of exponential moving averages that helps traders gauge short-term momentum. A successful EMA reclaim often signals that buyers are regaining control, while failure to hold can indicate potential weakness. A breakout from the prior trading range, accompanied by elevated volume, suggests possible continuation, but analysts note the rally remains corrective rather than impulsive.
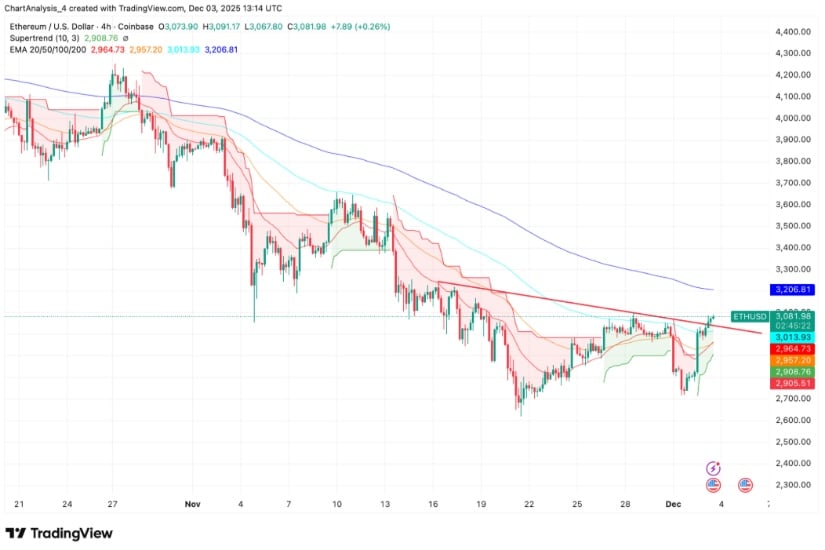
ETH holds short-term support near $2,964–$2,957 but faces key resistance at the 100- and 200-day EMAs ($3,013–$3,206). Source: TradingView
Market commentator Jainam Mehta, “The chart shows cleaner higher-low formations on both the 4-hour and daily charts.” Higher-low patterns are significant because they indicate that buyers are entering on dips, providing incremental support for potential upward movement. ETH currently trades above the 20-day and 50-day EMAs near $2,964 and $2,957, which may act as near-term support.
Critical resistance levels are located at the 100-day and 200-day EMAs, around $3,013 and $3,206, respectively. Historically, these EMAs have served as supply zones during prior rallies. A sustained move above these thresholds could open the way for targets near $3,360 and $3,477, with a larger pivot around $3,566.
On the downside, failure to hold $3,050 or rejection at the 200-day EMA could lead to a deeper pullback. Immediate downside targets include the psychological $2,900 level and the 50-day EMA at $2,957. Further declines could extend toward $2,800–$2,720, particularly if high leverage accelerates selling pressure.
Analysts emphasize that these levels provide structural reference points but warn that short-term volatility may create false signals, such as EMA whipsaws or liquidity sweeps.
The Fusaka upgrade, activated on December 3, improves Layer 2 settlements and lowers node costs, offering some fundamental support. According to on-chain data provider Glassnode, Ethereum has recovered approximately 45% from November lows. Spot market inflows also indicate renewed interest, with ETH registering $58.10 million in net inflows on December 3—the largest in over a month.
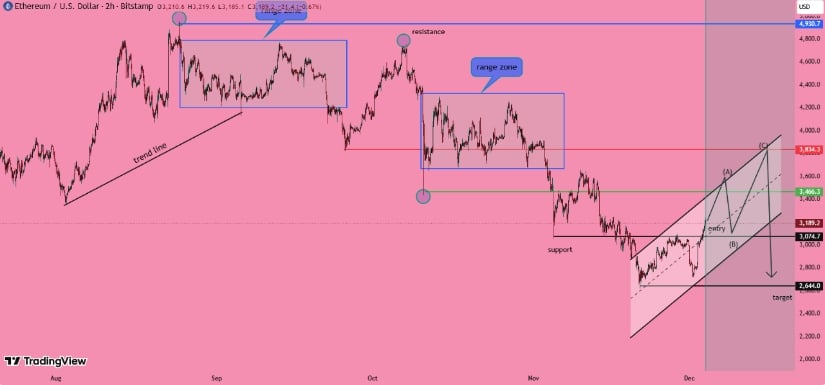
ETH/USD is retracing within a rising channel; holding $3,074 and breaking $3,466 could extend a short-term rally toward $3,834, while rejection risks a drop to $2,644. Source: Elise-Golden-Spar on TradingView
Derivatives data show rising open interest totaling $38.34 billion, suggesting that institutional and high-volume traders are positioning for potential volatility. However, these metrics carry dual interpretations: while they indicate accumulation, they may also imply an elevated risk of liquidation if the price reverses suddenly.
Long-term Ethereum price predictions for 2025 remain uncertain. Market participants should consider potential macroeconomic factors, the pace of Ethereum network upgrades, and competition from other smart contract platforms. Even with technical and fundamental support, outcomes can diverge significantly based on adoption trends, regulatory developments, and broader crypto market sentiment.
Short-term scenarios suggest that ETH could approach $3,400–$3,500 if support around $3,050 holds. Key resistance at $3,500–$3,700 will determine whether the rally extends. Traders should also monitor volume confirmation, EMA behavior, and market positioning.
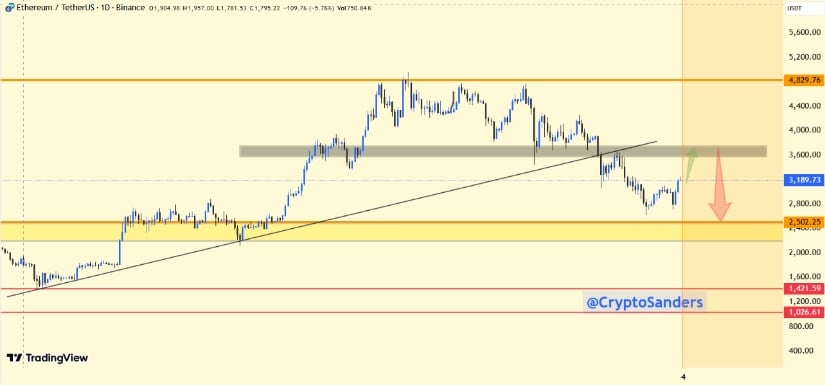
ETH/USD bounces toward $3,500–$3,700 resistance, with support at $2,400–$2,550; a break higher targets $4,400–$4,800, while rejection risks $1,400–$1,000. Source: CryptoSanders9563 on TradingView
Conversely, failure to clear resistance or a breakdown below $3,050 could trigger a sharper correction. Risk management is crucial in this environment, as algorithmic trading and leverage could magnify price swings. Analysts recommend tracking both structural signals (EMA clusters, support/resistance zones, higher-lows) and short-term noise (liquidity sweeps, sudden inflow spikes) to distinguish reliable trends.
Ethereum currently shows tentative signs of stabilization, with short-term support holding near $3,050 and technical indicators improving. Both bullish and bearish outcomes are possible, and the outcome will depend on the interplay among market participation, resistance levels, and macro factors.

Ethereum was trading at around 3,191.64, up 4.43% in the last 24 hours at press time. Source: Ethereum price via Brave New Coin
Investors and traders are advised to watch for sustained closes above key EMAs, monitor supply zones, and assess liquidity trends. While early accumulation is evident, the broader market trend remains cautious, underscoring the need for disciplined risk management and vigilance against potential volatility.