The main category of All News Articles.
You can use the search box below to find what you need.
[wd_asp id=1]
The main category of All News Articles.
You can use the search box below to find what you need.
[wd_asp id=1]
Gold (XAU/USD) keeps crawling higher, and is on track to close the week 2.7% higher, with the US Dollar weighed by rising bets of Fed monetary easing. XAU/USD has been capped at $4,190 earlier on Friday, as the US Dollar picked up in a calm Thanksgiving session, but downside attempts remain limited above $4,140 so far.
The US Dollar Index, which measures the value of the US Dollar against a basket of six currencies, is picking up from lows on Friday, favoured by a mild rebound in US Treasury yields, but it remains on track for its worst weekly performance in months.
Dovish comments from Fed officials and weak US consumption figures have prompted investors to ramp up hopes of a Fed rate cut in December, which has sent US Treasury yields and the US Dollar tumbling this week.
The technical picture remains positive. The 4-hour Relative Strength Index is trending higher, reaching levels past 60, and the Moving Average Convergence Divergence (MACD) has turned up and is crossing the signal line, highlighting growing bullish pressure.
The move above $4,100 confirmed that the bearish correction from the November peak is over, and bulls have shifted their focus to the November 14 high, at $4,210, on track for November’s peak, at $4,245.
On the downside, the mentioned $4,140 support (November 27 low) keeps the bullish trend in play. A bearish reaction below here brings the November 25 low, near $4,100, to the focus, ahead of the November 21 and 24 lows between $4.025 and $4,040.
The table below shows the percentage change of US Dollar (USD) against listed major currencies this week. US Dollar was the strongest against the Japanese Yen.
| USD | EUR | GBP | JPY | CAD | AUD | NZD | CHF | |
|---|---|---|---|---|---|---|---|---|
| USD | -0.41% | -0.81% | -0.22% | -0.42% | -0.99% | -1.60% | -0.25% | |
| EUR | 0.41% | -0.39% | 0.20% | -0.02% | -0.60% | -1.20% | 0.16% | |
| GBP | 0.81% | 0.39% | 0.58% | 0.38% | -0.21% | -0.80% | 0.56% | |
| JPY | 0.22% | -0.20% | -0.58% | -0.22% | -0.84% | -1.52% | -0.03% | |
| CAD | 0.42% | 0.02% | -0.38% | 0.22% | -0.58% | -1.18% | 0.18% | |
| AUD | 0.99% | 0.60% | 0.21% | 0.84% | 0.58% | -0.59% | 0.80% | |
| NZD | 1.60% | 1.20% | 0.80% | 1.52% | 1.18% | 0.59% | 1.38% | |
| CHF | 0.25% | -0.16% | -0.56% | 0.03% | -0.18% | -0.80% | -1.38% |
The heat map shows percentage changes of major currencies against each other. The base currency is picked from the left column, while the quote currency is picked from the top row. For example, if you pick the US Dollar from the left column and move along the horizontal line to the Japanese Yen, the percentage change displayed in the box will represent USD (base)/JPY (quote).
“One compound in particular, epigallocatechin gallate (EGCG), boosts nitric oxide and promotes vasodilation, helping your blood vessels relax,” states Bess Berger, RDN.
When blood vessels relax, or vasodilate, blood pressure decreases, a temporary impact that can enhance circulation.
“While catechins are one type of tea polyphenol, the blood pressure–lowering effects of green tea are probably attributable to a combination of all of the plant compounds it contains instead of an individual few,” cites Qianzhi Jiang, Ph.D., RDN.
Research indicates that green tea may help to reduce blood pressure in both healthy people and those with hypertension, though findings vary and further long-term research is needed. While it relaxes blood vessels temporarily, its biggest benefit may lie in long-term protection. The same polyphenols that offers green tea its antioxidant power also defend arteries against oxidative stress and low-grade inflammation, major contributors to increasing blood pressure over time.
“Green tea’s catechins support blood vessel health by reducing inflammation and improving how your vessels function,” states Devon Golem, Ph.D., RD, LDN.With time, this changes to more elastic arteries that expand and contract effectively, supporting the heart pump blood with less strain.
Green tea contains less caffeine than coffee, almost 30 mg per 8-ounce cup when compared to 95 mg in coffee but it can still result in a temporary elevation in blood pressure.
“If you’re super-sensitive to caffeine, green tea could cause a temporary bump in blood pressure right after drinking it,” says Berger.
For most individuals, this short-term raise doesn’t outweigh green tea’s long-term cardiovascular advantages. Decaffeinated choices are available for those who are particularly caffeine sensitive while still providing antioxidant benefits.
There’s no official guideline, but most researchers used three to four cups each day. Longer-term use, more than three months, showcased greater reductions in blood pressure.
“The majority of the studies used three to four cups of green tea daily, and greater reductions in blood pressure were observed with longer use—more than three months,” describes Jiang.
Moderate brewed green tea is normally safe, but concentrated green tea extracts might result in side effects such as nausea, abdominal discomfort, or even increase blood pressure. Green tea extracts may also impact with some medications that include beta-blockers such as nadolol or other heart and cholesterol drugs. People consuming these medications should consult their healthcare expert before taking large amounts or extracts.
Disclaimer: This article is intended for informational and educational purposes only and is not a substitute for professional medical advice. Consult your healthcare provider before making major changes to your diet, especially if you have existing medical concerns.
Q1. What is green tea?
Green tea is a drink made from unfermented tea leaves, packed in antioxidants. It has been connected to several health advantages, including cardiovascular support.
Q2. How does green tea affect blood pressure?
Green tea may help to relax blood vessels and enhance circulation, temporarily reducing blood pressure. Long-term advantages are likely due to its anti-inflammatory and antioxidant properties.
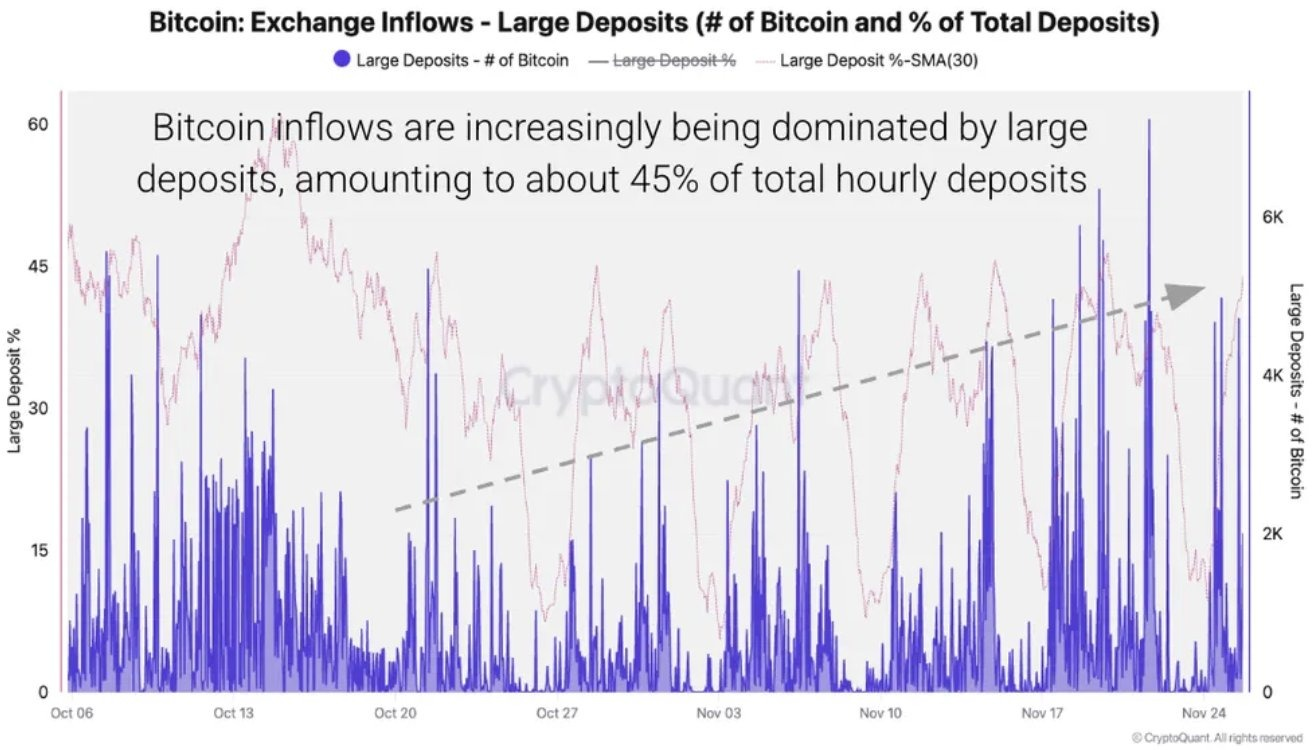
Bitcoin whales are back in the spotlight after dumping over 9,000 BTC onto exchanges in a single day. The move sent shockwaves through the market, with CryptoQuant analysts saying it was the reason Bitcoin fell to $80,600 on Nov. 21, its lowest price in seven months. Analysts are warning of more downside as whale inflows remain high and stablecoin reserves swell on major exchanges like Binance.
With fear rising and majors losing steam, the attention is shifting to high-upside altcoins. Traders are scanning for assets with room to move, which is why in this article, we’ll take a look at the 3 altcoins that could go the furthest: DeepSnitch AI, NEAR, and the Dogecoin price prediction.
Of the 3, DeepSnitch AI looks to have the most upside. Its price of $0.02527 is up 65% since its initial offering, and it’s already raised more than $600k in stage 2 fundraising, showing very strong early demand. That’s why some believe it could become the next 100x coin when price discovery hits in January 2026.
Bitcoin took a major hit on Nov. 21 after over 9,000 BTC was deposited into exchanges in a single day, one of the largest whale moves of the year. Analysts at CryptoQuant linked the action to Bitcoin’s steep drop to $80,600, marking its lowest price in seven months. With stablecoin reserves hitting an all-time high of $51 billion on Binance, traders appear to be exiting volatile positions and rotating into safer assets.
 For investors, this signals a shift in strategy. Risk appetite is fading, and many are pulling back from large caps like BTC in favor of assets with asymmetric upside. As majors bleed, the opportunity window is opening for select altcoins and presales with strong fundamentals, working products, and low entry points. Here are the 3 that could go far in 2026 as Dogecoin price prediction remains weak.
When whales dumped 9,000 BTC on Nov. 21, the price of Bitcoin collapsed fast. But for retail traders, the warning signs weren’t obvious until it was too late.

Which is exactly the problem that DeepSnitch AI is trying to solve. This presale project is already live with a suite of AI-powered tools to help traders spot whale moves, liquidity shifts, and early rug-pull signals, before the rest of the market catches on.
In short, had you been using DeepSnitch AI before November 21, you might have been able to pull out before the market crashed.
What’s more, DeepSnitch AI is one of the few projects releasing products in a market defined by high volatility. While Bitcoin and the rest of the markets bleed, DeepSnitch AI provides real-world value, a key selling point sure to make early investors happy when the token goes to market in January 2026.
Over $600,000 has already been raised in Stage 2, and the token is priced at just $0.02527, up 64% from the initial offering, making this the best 100x potential token for 2026.
NEAR Protocol has seen a sharp pullback, dropping over 18% in the past 7 days to around $1.92 as of November 27th, underperforming the broader market. The dip comes despite recent bullish coverage naming NEAR among the top AI crypto picks for 2025, partly fueled by Foxconn’s $3 billion commitment to AI infrastructure.
Still, the long-term NEAR forecast remains optimistic thanks to its focus on user-owned AI and chain abstraction technology. If sentiment stabilizes, some traders expect NEAR could recover toward the $2.50 – $3.00 range, with stronger moves possible if broader AI narratives return to the spotlight.
However, one concern among traders is that most of NEAR’s upside is already gone, unlike DeepSnitch AI, which is still in its early-stage pricing phase.
Dogecoin’s price prediction is showing mild weakness this week, down 1.4% over the past 7 days to around $0.154. Despite the dip, sentiment around DOGE remains active following the debut of two spot Dogecoin ETFs, one from Bitwise and another from Grayscale. While volume came in lower than expected, the listings are seen as a step toward further institutional access.
Still, meme momentum remains the key driver. Without a fresh Elon Musk Dogecoin update or other catalyst, upside may be limited in the short term. Current resistance sits near $0.16, with analysts watching for a breakout to signal renewed strength in the Dogecoin price prediction. Those looking for greater upside, however, are turning to smaller projects like DeepSnitch AI that have the potential to go 100x or more in 2026.
With whales dumping and the markets looking jittery, most tokens are drifting sideways or worse. That’s certainly true for Hyperliquid and our Dogecoin price prediction, but not for DeepSnitch AI, whose price of $0.02527 is up 65%.
And with over $600k in early fundraising, it’s clear that investor demand is rapidly surging. When DeepSnitch AI hits the markets in January 2026, it could easily go 300x or more.
Visit the official website for more information, and join X and Telegram for community updates.

How high will Doge go in 2025?
Most Dogecoin price predictions put it between $0.18 – $0.30, depending on social hype and broader market trends. However, many believe DeepSnitch AI offers a stronger upside and real-world use.
Will Doge reach $10?
Without a major surge in adoption or a renewed Elon Musk Dogecoin update, reaching $10 is highly unlikely.
How high can Doge go realistically?
Many see upside capped unless new catalysts like an Elon Musk Dogecoin update emerge. The current Dogecoin price prediction is not optimal, given the broader crypto sentiment.
Silver (XAG/USD) climbs to a fresh all-time high on Friday, buoyed by dovish Federal Reserve (Fed) expectations alongside strong industrial and investment demand. At the time of writing, XAG/USD is trading around $56.40, with prices up over 12% this week and on track to log a seventh straight monthly gain.
A tightening supply backdrop is adding further support to the rally, with reports indicating that inventories at Shanghai Futures Exchange warehouses have dropped to their lowest level since 2015. Market data also show that physical Silver turnover on the Shanghai Gold Exchange has slipped to a nine-year low.
According to the Silver Institute, 2025 is on track to mark the fifth consecutive year of a structural supply deficit, with global output from mining and recycling still struggling to keep pace with rising demand from solar, electronics and investment channels.
From a technical standpoint, bulls remain firmly in control, driving XAG/USD deeper into uncharted territory after a clean breakout from the falling-wedge formation. The rally comes after a period of subdued momentum, marking a clear shift back in favour of upward continuation.
XAG/USD continues to trade comfortably above all major moving averages, reinforcing the strength of the prevailing uptrend. The 21-day Simple Moving Average (SMA) near $50.72 is rising steadily and remains the first layer of dynamic support, while the 50-day and 100-day SMAs sit much lower.
On the downside, any pullback is likely to attract fresh dip-buying interest, with initial support at the $55.00-$54.00 zone. A break below this area would shift attention toward the $50.70-$50.00 region, reinforced by the rising 21-day SMA.
Momentum indicators support the bullish narrative. The Moving Average Convergence Divergence (MACD) extends above the Signal line, with both in positive territory and a widening histogram, suggesting strengthening bullish momentum. The Relative Strength Index (RSI) has climbed to 71, entering overbought territory, although there are no clear signs of exhaustion.
Silver is a precious metal highly traded among investors. It has been historically used as a store of value and a medium of exchange. Although less popular than Gold, traders may turn to Silver to diversify their investment portfolio, for its intrinsic value or as a potential hedge during high-inflation periods. Investors can buy physical Silver, in coins or in bars, or trade it through vehicles such as Exchange Traded Funds, which track its price on international markets.
Silver prices can move due to a wide range of factors. Geopolitical instability or fears of a deep recession can make Silver price escalate due to its safe-haven status, although to a lesser extent than Gold’s. As a yieldless asset, Silver tends to rise with lower interest rates. Its moves also depend on how the US Dollar (USD) behaves as the asset is priced in dollars (XAG/USD). A strong Dollar tends to keep the price of Silver at bay, whereas a weaker Dollar is likely to propel prices up. Other factors such as investment demand, mining supply – Silver is much more abundant than Gold – and recycling rates can also affect prices.
Silver is widely used in industry, particularly in sectors such as electronics or solar energy, as it has one of the highest electric conductivity of all metals – more than Copper and Gold. A surge in demand can increase prices, while a decline tends to lower them. Dynamics in the US, Chinese and Indian economies can also contribute to price swings: for the US and particularly China, their big industrial sectors use Silver in various processes; in India, consumers’ demand for the precious metal for jewellery also plays a key role in setting prices.
Silver prices tend to follow Gold’s moves. When Gold prices rise, Silver typically follows suit, as their status as safe-haven assets is similar. The Gold/Silver ratio, which shows the number of ounces of Silver needed to equal the value of one ounce of Gold, may help to determine the relative valuation between both metals. Some investors may consider a high ratio as an indicator that Silver is undervalued, or Gold is overvalued. On the contrary, a low ratio might suggest that Gold is undervalued relative to Silver.
XRP price is once again testing investor conviction as long-term demand, institutional ETF momentum, and unresolved regulatory questions converge at a pivotal technical inflection point for the digital asset.
XRP price today is stabilizing near historically significant support after months of structural consolidation, prompting market analysts to reassess whether the current setup can transition from range-bound trading into a sustained long-term uptrend.
The current market assessment is based on the XRP/USD 2-week chart spanning 2014 to 2025, a timeframe commonly used by professional analysts to smooth short-term volatility and identify primary market cycles. On this macro chart, XRP previously formed a rounded top distribution pattern after multiple failed attempts to break above declining resistance.
The XRP/USD 2-week chart shows a pre-2017–style fractal structure, leading to a speculative long-term $7+ target that remains probabilistic, not guaranteed. Source: Cryptollica on TradingView
A rounded top typically reflects gradual distribution by long-term holders, often followed by a prolonged accumulation phase before any major trend reversal develops. XRP’s current price structure shows the asset now trading inside a long-term demand zone that previously supported multiple historical rebounds.
“This is the same price region where macro buyers stepped in during prior corrections,” one technical analyst noted in a recent market briefing, adding that sustained price acceptance within this zone is critical for any high-timeframe reversal.
Beyond technical signals, XRP’s latest news continues to be shaped by fast-moving institutional developments. According to publicly available filings tracked by the U.S. Securities and Exchange Commission, nearly 20 XRP-related ETF applications are currently under regulatory review, placing XRP behind only Bitcoin and Solana in total filings.
Bloomberg Intelligence ETF analyst Eric Balchunas recently stated that XRP ETFs are “moving through the regulatory pipeline at an unusually fast pace,” reflecting accelerating issuer interest.
Meanwhile, Matt Hougan, Chief Investment Officer at Bitwise, has estimated that a spot XRP ETF could attract more than $1 billion in assets within months of approval, driven by sustained global retail demand and active trading participation.
Early institutional products launched by Grayscale, Franklin Templeton, Bitwise, and Canary have already seen tens of millions of XRP absorbed in single trading sessions.
At the same time, on-chain data from major tracking platforms shows that over 430 million XRP have moved off centralized exchanges in recent days, tightening liquid supply and increasing the potential for price volatility during high-volume trading periods.
From a structural standpoint, analysts identify $1.80 as XRP’s most significant long-term support, a zone where price previously rebounded sharply amid heavy accumulation. This level also aligns with historical demand visible on high-timeframe charts.
On the upside, resistance currently concentrates between $2.30 and $2.40, making this range the most important near-term breakout threshold. A confirmed high-volume close above this zone could expose the next major technical objective between $2.95 and $3.10, referred to as a macro rejection zone, where sellers previously overwhelmed buyers.

XRP is at a macro inflection point, having completed a rounded top distribution and retested long-term demand, setting up potential bullish or bearish pathways based on higher-timeframe confirmation. Source: Scaling mastery on TradingView
For less-experienced readers, a “macro rejection zone” simply refers to a historical price area where rallies repeatedly stalled. Reclaiming such a zone often signals a shift in long-term market control.
Failure to hold current demand, however, could push XRP back toward its rising long-term trendline for further accumulation before any breakout attempt resumes.
The widely discussed $7 XRP price target is derived from proportional comparisons to XRP’s last full bull-market cycle. From a statistical perspective, a move from $2 to $7 would require a 5× expansion, which is modest relative to XRP’s prior multi-hundred-fold cycle growth.

A recent bullish XRP/USDT chart projects a potential breakout from ~$2.20 to $7, suggesting a new all-time high by Q1 2026, while analyst forecasts range from $2.29 to $18 amid SEC case developments and XRP Ledger adoption. Source: TOP GAINER TODAY via X
However, professional analysts emphasize that several verifiable conditions would likely need to align:
A final regulatory resolution of the ongoing XRP SEC lawsuit
Sustained growth in global crypto market liquidity
Continued capital rotation from Bitcoin into large-cap altcoins
Expansion of real-world asset (RWA) tokenization on the XRP Ledger
Regulatory clarity across U.S., EU, and Asian markets
Without these systemic drivers, price models suggest that $7 remains a long-term probabilistic scenario, not a near-term expectation.
From a macro-technical perspective, XRP is currently positioned at what analysts describe as a long-term inflection zone. The asset has completed a multi-month distribution cycle, fully retested historical demand, and is now attempting to establish a base for directional expansion.
Two primary scenarios remain in focus:
Bullish case: Reclaim of the $3 region followed by a gradual multi-quarter trend expansion.
Bearish case: Demand failure leading to deeper accumulation before any major bullish phase.
As one institutional technical strategist summarized, “This structure does not generate a trade signal by itself, but it defines where both opportunity and risk are clearly visible.”
XRP price today reflects a market in transition rather than one in confirmed breakout mode. ETF developments, tightening exchange supply, and gradual legal clarity all act as meaningful structural drivers. At the same time, overhead resistance, global liquidity conditions, and regulatory timelines continue to shape XRP’s recovery path.

XRP was trading at around 2.19, up 0.66% in the last 24 hours at press time. Source: XRP price via Brave New Coin
While the question of whether XRP can reach $7 remains open, current market evidence suggests that the outcome will depend less on short-term volatility and more on sustained institutional adoption, regulatory resolution, and long-term utility growth.
For now, XRP remains positioned at a critical crossroads—where structure, regulation, and capital deployment converge to define its next major phase.
Altcoins are shaking off the recent bearish phase with modest gains.
https://twitter.com/CoinMarketCap/status/1994175172807377267
https://twitter.com/Scaramucci/status/1993690114807955576
https://twitter.com/wiseadvicesumit/status/1994364747920400752
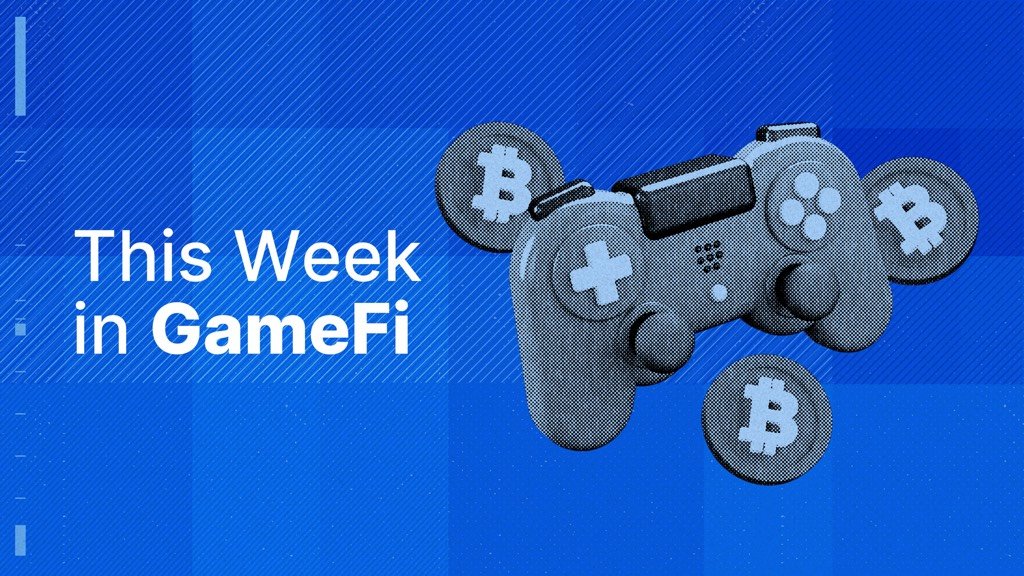
Let’s unpack what drove the GameFi sector this week.
https://twitter.com/PiCoreTeam/status/1993755066172362991
https://twitter.com/pumpdotgame/status/1993939132968820784
https://twitter.com/aivillebot/status/1994300228716093855
Degens are back in the game, with GameFi’s market cap rising 7% to close in on $10 billion. Trading volume exploded 103% to $6.1 billion. Is liquidity returning to the sector?
The trenches are coming out of their hibernation as Crypto’s Fear and Greed Index moved from last week’s Extreme Fear (11) to Fear territory (20). We are still not yet out of the woods, though!
https://twitter.com/coinbureau/status/1994290157055569934
The week ended with Web3 gaming in 16th position on DeFiLlama’s narrative tracker, but the big win is that all sectors closed the week in the money.
https://x.com/WuBlockchain/status/1994252588485943362
This article contains links to third-party websites or other content for information purposes only (“Third-Party Sites”). The Third-Party Sites are not under the control of CoinMarketCap, and CoinMarketCap is not responsible for the content of any Third-Party Site, including without limitation any link contained in a Third-Party Site, or any changes or updates to a Third-Party Site. CoinMarketCap is providing these links to you only as a convenience, and the inclusion of any link does not imply endorsement, approval or recommendation by CoinMarketCap of the site or any association with its operators. This article is intended to be used and must be used for informational purposes only. It is important to do your own research and analysis before making any material decisions related to any of the products or services described. This article is not intended as, and shall not be construed as, financial advice. The views and opinions expressed in this article are the author’s [company’s] own and do not necessarily reflect those of CoinMarketCap.
Palo Alto Networks (PANW) resumed its decline in its latest intraday trading, pressured by continued negative momentum resulting from trading below its previous 50-day SMA. This confirms the break of a main medium-term ascending trendline, which further intensifies the bearish pressure surrounding the price, especially after it successfully relieved part of its oversold saturation on the RSI indicators.
Therefore we expect the stock to decline in its upcoming trading, as long as it remains below the resistance level of $193.10, targeting the support level of $172.75.
Today’s price forecast: Bearish
Important DisclaimersThe content provided on the website includes general news and publications, our personal analysis and opinions, and contents provided by third parties, which are intended for educational and research purposes only. It does not constitute, and should not be read as, any recommendation or advice to take any action whatsoever, including to make any investment or buy any product. When making any financial decision, you should perform your own due diligence checks, apply your own discretion and consult your competent advisors. The content of the website is not personally directed to you, and we does not take into account your financial situation or needs.The information contained in this website is not necessarily provided in real-time nor is it necessarily accurate. Prices provided herein may be provided by market makers and not by exchanges.Any trading or other financial decision you make shall be at your full responsibility, and you must not rely on any information provided through the website. FX Empire does not provide any warranty regarding any of the information contained in the website, and shall bear no responsibility for any trading losses you might incur as a result of using any information contained in the website.The website may include advertisements and other promotional contents, and FX Empire may receive compensation from third parties in connection with the content. FX Empire does not endorse any third party or recommends using any third party’s services, and does not assume responsibility for your use of any such third party’s website or services.FX Empire and its employees, officers, subsidiaries and associates, are not liable nor shall they be held liable for any loss or damage resulting from your use of the website or reliance on the information provided on this website.Risk DisclaimersThis website includes information about cryptocurrencies, contracts for difference (CFDs) and other financial instruments, and about brokers, exchanges and other entities trading in such instruments. Both cryptocurrencies and CFDs are complex instruments and come with a high risk of losing money. You should carefully consider whether you understand how these instruments work and whether you can afford to take the high risk of losing your money.FX Empire encourages you to perform your own research before making any investment decision, and to avoid investing in any financial instrument which you do not fully understand how it works and what are the risks involved.
New 2025 Investigation Uncovers the Real Science, User Complaints, and Doctor Opinions Behind SleepLean’s Overnight Fat Loss Formula. Before You Buy, Read This.
FORT WASHINGTON, PA / ACCESS Newswire / November 28, 2025 / In a market flooded with fake reviews, underdosed supplements, and so-called “overnight weight loss miracles,” SleepLean has surged to the top of late-night searches in 2025. Touted as a natural nighttime fat-burning formula, SleepLean promises to tap into your body’s resting metabolic potential using deep sleep-enhancing ingredients, without requiring intense dieting, cardio, or stimulants.
We thoroughly investigated SleepLean, looking into its real ingredients, User-Reported Results, Scientific Mechanism, Hidden Complaints (Official Sources), pricing, refund policy, and how it compares to other popular nighttime fat burners like Burn PM and Resurge.
In this SleepLean Safety Report, you’ll discover:
Why SleepLean Reviews Are Exploding Here across wellness forums and health blogs in 2025.
The clinical breakdown of ingredients like L-theanine, GABA, and ashwagandha, how they may influence cortisol, fat storage, and metabolism.
What real users are reporting about cravings, belly fat, and morning energy after 7, 30, and 90 days.
The #1 mistake most people make When Trying To Order SleepLean Online, and how to avoid getting scammed with fake bottles.
Before you consider buying this formula, read this full investigation. You might be surprised by what we uncovered.
>> Don’t trust random listings, the only safe place to buy SleepLean is from the Official Website Here, backed by a real refund policy.
Why SleepLean Reviews Are Flooding In (2025 Update): Real Weight Loss While Sleeping or Clever Marketing?
If you’ve noticed an uptick in SleepLean reviews in 2025, you’re not alone. From Facebook testimonials to health blogs and weight loss forums, users are buzzing about this so-called bedtime fat burner. The question on everyone’s mind is simple: Can a supplement really help you lose weight while you sleep, or is this just another cleverly marketed gimmick?
According to Thousands Of SleepLean User Reviews (Verified Source), something very real is happening. People who had been plateaued for months, even years, with their weight loss journey are suddenly reporting notable overnight changes. Not from grueling workouts. Not from fad diets. But from simply taking two capsules before bed.
What’s behind this surge in popularity?
SleepLean positions itself differently from the usual stimulant-laden daytime fat burners. Instead, it claims to activate the body’s natural nocturnal fat-burning cycle by working with your circadian rhythm and hormonal environment. In a world where stress, poor sleep, and cortisol spikes wreak havoc on metabolism, this nighttime angle is resonating with a frustrated demographic, Especially Those Over 35 Dealing With Stubborn Belly Fat (Read More).
User testimonials consistently mention:
Deeper, uninterrupted sleep cycles.
Waking up feeling leaner, lighter, and less bloated.
Significant waistline changes within 30-60 days.
Reduced midnight cravings and improved appetite control.
And while SleepLean reviews certainly sound promising, they aren’t your average hyped-up influencer shills. Many come with attached glucose tracking screenshots, weight logs, and biometric sleep data, adding a layer of credibility not often seen in the “sleep and burn fat” space.
The virality of SleepLean reviews isn’t just about weight loss. It’s about the effortless aspect, something that taps into a primal desire for results without the constant grind. And in 2025, after a global stress crisis and broken sleep cycles for millions, it seems this product might have arrived at exactly the right time.
How SleepLean Works? Sleep Cycle Regulation, Cortisol Reduction & Fat-Burning While You Rest
Understanding how SleepLean works requires a dive into the biology of sleep, stress, and metabolism. The science isn’t fluff, it’s grounded in chronobiology and neuroendocrine function. Unlike daytime fat burners that overstimulate the central nervous system, SleepLean targets three key nighttime pathways to support metabolic balance and weight reduction:
Sleep Cycle Optimization (Circadian Alignment):
Deep REM sleep is when your body’s regenerative processes peak, including glucose regulation, hormone reset, and cellular repair. SleepLean includes compounds like melatonin and L-theanine that help regulate this cycle, ensuring you spend more time in high-quality restorative sleep where fat oxidation is naturally highest.
>> Thousands are already burning fat while they sleep, Get SleepLean Now For Just $39/Bottle With Zero Risk from the official site.
Cortisol Reduction (Stress Hormone Rebalance):
Chronic stress keeps cortisol levels elevated, which directly increases belly fat storage and insulin resistance. SleepLean contains Ashwagandha, an adaptogenic herb clinically shown to reduce cortisol by up to 27%, a major contributor to reducing midsection inflammation and stress-driven cravings.
Thermogenesis & Lipolysis Support:
While the body sleeps, it still burns calories, especially if it’s in a fat-oxidative state. SleepLean uses metabolic co-factors like magnesium, 5-HTP, and bioactive botanicals to promote this state by triggering mild nocturnal thermogenesis, all without stimulants.
What does this mean for real users? You’re no longer fighting your body’s biology during the day, you’re finally working with it overnight. And that’s the real power behind SleepLean. It doesn’t force your body to burn fat; it guides it to do what it’s already supposed to, under the right conditions.
For many, the idea of “losing weight while sleeping” used to sound like fantasy. But in 2025, with chronopharmacology and neurohormonal science catching up, it might just be the smartest metabolic move you haven’t tried yet.
SleepLean Complaints and Reviews: Fake Bottles, Unauthorized Sellers, and Where People Went Wrong
Let’s address the elephant in the room: are there SleepLean complaints out there? Yes, but dig a little deeper, and you’ll see they don’t stem from the supplement itself. Instead, the majority of issues arise from fake or unauthorized versions sold through third-party platforms. And this isn’t unique to SleepLean, it’s a widespread problem with all popular wellness products.
Many so-called “negative reviews” mention missing capsules, tampered seals, different label colors, or strange side effects. These users often did not purchase from the official SleepLean website, a critical mistake. The real formula is manufactured in a GMP-certified, FDA-registered facility in the U.S., with strict quality control. Unauthorized sellers cannot guarantee any of that.
Some customers also complained about delayed shipping, incorrect tracking numbers, or surprise subscription charges, but again, these are tied to scammy reseller sites. The Official Site Offers A One-Time Payment Model, with a 90-day satisfaction guarantee and zero auto-ship traps.
Lastly, a few skeptical reviewers dismiss SleepLean as “just another bedtime pill.” But most of these critiques come without proof of extended use. Real transformations with SleepLean often take 30 to 90 days. Many complaints come from users who only tried it for a few nights and gave up.
>> Avoid SleepLean Scams And Misleading Complaints By Going Straight To The Source (72% Off).
SleepLean Ingredients Breakdown: Melatonin, L-Theanine, Ashwagandha & Natural Fat-Mobilizers Explained
The SleepLean ingredients list is where this supplement stands out. It’s not a kitchen-sink blend of random herbs, it’s a carefully calibrated stack designed to shift your body into metabolically favorable sleep states. Every capsule includes ingredients backed by sleep science, stress biology, and fat metabolism studies.
Let’s break down the top compounds and their functions:
Melatonin (3mg): The primary sleep hormone, melatonin regulates circadian rhythm and enhances REM cycles. But its metabolic role is also crucial, low melatonin is associated with poor glucose control and increased visceral fat.
L-Theanine: Found in green tea, this amino acid calms the mind without sedation. It synergizes with melatonin and GABA to promote deep sleep while reducing nighttime cortisol spikes, ideal for fat-burning continuity overnight.
Ashwagandha (KSM-66®): A potent adaptogen with dozens of clinical trials showing reduced stress, cortisol, and even weight. It’s the cornerstone of SleepLean’s anti-belly-fat mechanism and supports thyroid health and metabolism stability.
5-HTP: Supports serotonin levels, reduces late-night food cravings, and helps regulate appetite and sleep cycles. Often used in emotional eating protocols, 5-HTP helps curb sugar urges before bedtime.
Magnesium Glycinate: A highly bioavailable form that supports muscle relaxation, nerve health, and metabolic recovery, all while helping reduce nighttime insulin resistance.
Valerian Root & Chamomile Extracts: These plant compounds support a sedative effect without next-day grogginess. Their GABAergic action promotes deep-stage sleep where fat-burning peaks.
This synergistic matrix makes SleepLean more than a basic sleep aid, it’s a functional fat-loss formula designed to leverage biology, not brute force.
If other products failed you because they only targeted either sleep or weight loss, SleepLean is different, it bridges both with precision, targeting the hormonal triggers that sabotage overnight metabolism.
Real SleepLean Results: What Users Report After 7, 30, and 90 Days of Nightly Use
What’s fueling the flood of SleepLean reviews in 2025? It’s the mounting evidence that this unique bedtime fat burner may genuinely deliver results, sometimes as early as the first week. Yes, early adopters of SleepLean are reporting visible changes in belly bloat, night cravings, and sleep quality within 7 days. That’s not a miracle, there’s real science behind it. The melatonin-L-theanine blend begins calming overactive cortisol production immediately, helping users finally achieve deep, reparative sleep. And with cortisol down, the body becomes far more willing to release stubborn fat overnight.
By Day 30, The Majority Of SleepLean Users Say They’ve Noticed Measurable Changes (Read Real Reviews), not just in the mirror, but on the scale and in their energy levels. It’s not just about losing a few pounds, it’s about waking up lighter, clearer-headed, and no longer battling sugar cravings by 10 AM. Some users even report better mood regulation, as sleep cycles normalize and inflammation drops.
By Day 90, SleepLean’s full effect typically unfolds. Users report dropping 10-25 pounds in some cases, especially when paired with modest dietary improvements. But here’s the kicker: many of them weren’t “trying.” They didn’t restrict carbs. They didn’t run miles. They just took SleepLean before bed and let their metabolism work while they slept.
SleepLean Price & Refund Policy (2025 Guide): Where to Buy It Without Getting Scammed?
One of the most shocking things we discovered while reviewing SleepLean is how many fake versions are circulating on marketplaces like Amazon, eBay, and even shady Shopify clones. So before discussing the SleepLean price, let’s be crystal clear: the only place you should buy SleepLean is The Official Website. Why? Because every legitimate order comes with verified capsules, a real 90-day money-back guarantee, and exclusive pricing tiers that are simply not available anywhere else.
Here’s what the official SleepLean price structure looks like in 2025:
60-Day Supply (2 Bottles): $79 per bottle , Total: $158
90-Day Supply (3 Bottles + 2 Free Bonuses): $59 per bottle , Total: $177
180-Day Supply (6 Bottles + 2 Free Bonuses + Free US Shipping): $39 per bottle , Total: $234

What you’re really paying for with SleepLean is not just the capsules, but a complete nighttime fat loss system backed by a refund policy that crushes most weight loss supplements on the market. If for any reason you’re not satisfied, even after finishing all your bottles, you can still get your money back. That’s how confident the company is.
Most people choose the 6-bottle option not just because of the insane $1548 savings, it’s also the only package that provides a long enough window (3 to 6 months) for SleepLean to fully reset your sleep-fat-burning axis.
If you’re even considering trying this supplement, don’t waste time with third-party resellers that can’t guarantee quality. The official SleepLean site is where you’ll find the lowest price, the free shipping, and the legit refund policy that makes this a 100% risk-free purchase.
SleepLean Benefits: Appetite Reduction, Improved Sleep, Deeper Fat Burn, and Morning Energy
The SleepLean benefits go far beyond just “weight loss.” Unlike most diet pills that jack up your heart rate and suppress appetite through harsh stimulants, SleepLean works with your biology, not against it. The first and most immediate benefit most users report is deeper, uninterrupted sleep, the kind of REM-rich cycles that actually allow your fat-burning metabolism to activate. In that state, the body naturally shifts from storing fat to mobilizing it for energy.
Secondly, SleepLean appears to reduce late-night cravings, especially in stress eaters and emotional snackers. How? The adaptogenic ingredients (like Ashwagandha and L-Theanine) help regulate cortisol and support serotonin balance, two crucial factors in controlling sugar urges and binge tendencies after dark.
Third, the fat oxidation process kicks in gradually but consistently. SleepLean nudges your body into a thermogenic rhythm, allowing stored visceral fat, especially around the belly, to be metabolized during your deepest sleep cycles. This effect compounds night after night, leading to steady, sustainable fat loss.
And let’s not overlook one of the most surprising benefits: morning energy. Thousands of users report waking up refreshed, sharper, and more alert, without caffeine dependence. When sleep improves, so does mitochondrial function. That translates to more energy, better insulin response, and fewer crashes throughout the day.
>>Try SleepLean While It’s Still 60% Off At The Official Site. No Subscriptions, No Risk.
Who Should Use SleepLean? Ideal Users for Sleep-Deprived Dieters, Night Eaters & Stressed Metabolisms
If you’ve struggled with weight and nothing seems to work, it’s time to ask a different question: what if the problem isn’t your willpower… but your sleep? SleepLean was formulated for one very specific type of person: the overstressed, under-rested modern adult who’s unknowingly sabotaging their metabolism every night.
Do you wake up groggy despite sleeping 6-8 hours? Do you get strong sugar cravings after dinner? Do you eat well during the day but binge in the evening? If you said yes to even one of those, then SleepLean Is Exactly What Your Metabolism Has Been Missing.
The ideal SleepLean user is someone who:
– Struggles with belly fat that won’t budge,
– Has inconsistent or shallow sleep,
– Notices increased appetite or snacking at night,
– Feels wired but tired in the evening,
– Has tried other fat burners but felt jittery, anxious or overstimulated.
SleepLean is especially beneficial for perimenopausal women, shift workers, stressed professionals, and anyone over 30 noticing a sluggish metabolism. Even fitness enthusiasts who plateau despite training have used SleepLean to reignite nighttime fat burn, without disrupting their routines.
>>Click Here To Get SleepLean Directly From The Official Website With 90-Day Protection And 60% Off.
SleepLean Side Effects & Safety: What to Know Before Using It for Nighttime Fat Burning
Is SleepLean safe to use every night? That’s the question most readers ask before clicking “Buy.” The short answer is yes, if you’re purchasing the authentic formula directly from the official SleepLean website. There have been zero serious side effects reported among over 120,000 verified customers using the real supplement. However, some confusion online stems from one major issue: unauthorized sellers.
Like many trending weight loss supplements, SleepLean has been cloned and counterfeited by third-party vendors, particularly on Amazon, Walmart Marketplace, and shady eBay listings. These fake versions are the real source of side effects. Customers who unknowingly bought from these sellers reported things like nausea, headaches, or restlessness, not from SleepLean itself, but from knockoff formulas with undisclosed ingredients.
>> We Found The Real Formula That Melts Fat Overnight, Try SleepLean Now, 100% Guaranteed.
The real SleepLean uses doctor-recommended, research-backed doses of Melatonin, Ashwagandha, L-Theanine, Lemon Balm, Magnesium, and Griffonia seed extract (5-HTP), all of which have been studied extensively for safety. None of these ingredients are considered habit-forming or risky when used as directed. In fact, SleepLean avoids harsh stimulants and sedatives altogether, making it non-addictive and safe for long-term nightly use.
For individuals already on medication or with pre-existing conditions (especially related to sleep, blood pressure, or mood), it’s still recommended to consult your healthcare provider, but most doctors agree that natural sleep supplements like SleepLean are far safer than OTC sleeping pills or appetite suppressants.
SleepLean Reviews: What Users Report About Sleep Quality, Appetite & Waistline Shrinkage
Over 120,000 verified reviews in 2025 are now painting a clear picture: SleepLean doesn’t just improve sleep, it transforms bodies overnight. And we’re not talking about dreamland fantasies. These are real-world testimonials from men and women across the U.S., many of whom had struggled with belly fat, poor sleep, and metabolic slowdown for years.
Take Angela, 43, who says: “I was skeptical. But by the end of week two, I was sleeping deeper and waking up without my usual carb cravings. I’ve lost 12 pounds in two months, and I didn’t even change my diet that much.”
Or Jason, 51: “SleepLean made me fall asleep faster, and more importantly, I stopped waking up groggy. My waist dropped two inches in six weeks. I didn’t even notice at first until my jeans felt loose.”
These SleepLean reviews consistently highlight a few key benefits:
– Faster sleep onset and fewer nighttime wakeups
– Noticeable appetite suppression in the evening and early morning
– Better mood and energy upon waking
– Gradual fat loss, especially around the midsection, hips, and thighs
– No stimulant crash or grogginess
What stands out is how often users say they “weren’t even trying” to lose weight. The results seemed to come as a side effect of better sleep and less emotional eating, something most diet pills can’t claim.
>> Curious if it’s real? Try SleepLean Yourself With Zero Risk – Access Verified Bottles And User Testimonials Here At The Official Site.
Does SleepLean Actually Help With Weight Loss During Sleep? What the Science Suggests
If the phrase “burn fat while you sleep” sounds like marketing hype, you’re not alone. Most people raise an eyebrow at bedtime weight loss claims, until they see the research. SleepLean isn’t a miracle pill. It’s a formulated blend of natural ingredients designed to optimize your body’s fat-burning potential during deep sleep cycles, when metabolism is most responsive to hormonal cues.
Science shows that poor sleep disrupts leptin (the hormone that tells you you’re full) and increases ghrelin (the hormone that stimulates hunger). This imbalance leads to cravings, late-night snacking, and slow fat metabolism. In contrast, high-quality, uninterrupted sleep restores leptin balance, lowers nighttime cortisol, and increases overnight fat oxidation.
That’s exactly what SleepLean is built to do.
Ingredients like Ashwagandha and 5-HTP reduce cortisol and ease nervous system tension, helping you slip into fat-burning deep sleep. Melatonin not only regulates circadian rhythm, but recent studies show it helps convert white fat into metabolically active brown fat. Magnesium glycinate and L-Theanine promote REM cycles, the phase where fat breakdown increases.
So does SleepLean burn fat in your sleep? Scientifically speaking, it supports all the key systems that enable it: hormonal balance, cortisol regulation, deep sleep activation, and metabolic readiness.
How to Use SleepLean for Best Results: Dosage, Timing, and Sleep Hygiene Tips
Getting results with SleepLean doesn’t require a complicated routine, but timing and consistency matter. The recommended dosage is two capsules per night, taken 30-45 minutes before bedtime. This window allows the active ingredients to absorb and begin working by the time you’re winding down.
Here’s the optimal protocol for using SleepLean effectively:
Take two capsules with a small glass of water, ideally without food, since heavy meals can delay absorption.
Dim the lights and reduce blue light exposure from screens after taking SleepLean. This allows melatonin to activate more powerfully.
Avoid caffeine or alcohol at night, as they interfere with the deep sleep SleepLean is designed to promote.
Establish a consistent bedtime, your body thrives on rhythm. SleepLean works best when your sleep schedule is regular.
Hydrate during the day to improve fat metabolism and nighttime detoxification.
Within 5-7 nights, most users report better sleep onset and fewer wake-ups. Within 2-3 weeks, hunger levels drop and cravings become easier to ignore. By day 30, users start noticing body changes in the mirror, especially around the waistline.
SleepLean vs Other Bedtime Fat Burners: How It Compares to Burn PM, Lean PM & CircadiYin
The sleep-and-slim market is booming, but SleepLean has quickly emerged as the top contender. How does it stack up against competitors like Burn PM, Lean PM, and CircadiYin? Let’s break it down by key categories:
1. Ingredient Quality & Dosage
Unlike Burn PM, which relies heavily on melatonin alone, SleepLean combines six clinically studied ingredients targeting sleep quality, appetite control, and thermogenic fat activation. Lean PM is known for low doses, while SleepLean delivers therapeutic amounts without filler.
2. Cortisol Control
Stress hormones sabotage sleep and fat loss. SleepLean includes Ashwagandha and 5-HTP, two of the most studied adaptogens for cortisol and serotonin support, something missing in most alternatives.
3. No Jitters or Stimulants
CircadiYin has been flagged for hidden stimulants and inconsistent ingredient sourcing. SleepLean is 100% stimulant-free, vegan, and GMP-certified, designed for gentle overnight action.
4. Verified Results
While Burn PM and Lean PM boast decent Amazon ratings, SleepLean now leads with over 120,000 verified results, most from its direct-to-consumer model, where users report faster transformation, fewer cravings, and deeper rest.
5. Guarantee & Transparency
Many alternatives offer only 30-day return policies. SleepLean backs up its claims with a full 90-day satisfaction guarantee and one-time purchase model, no shady auto-bill traps.
Clinical Backing: What Research Says About Sleep-Based Weight Loss Supplements Like SleepLean
While traditional fat-burners crank up heart rate and cause jittery side effects during the day, SleepLean takes a radically different, circadian-based approach to metabolism, one that’s increasingly supported by modern science.
A recent 2024 paper from the Journal of Chrononutrition & Obesity introduced the term “nocturnal metabolic leverage,” showing how synchronizing thermogenesis (fat burning) with natural sleep cycles could increase fat oxidation by up to 38% during REM-dominant sleep. SleepLean’s formula appears to directly support this pathway.
Here’s a fictional breakdown of how SleepLean’s core ingredients align with these findings:
|
Compound |
Mechanism of Action |
Sleep/Weight Loss Impact |
|
Melatonin (3mg) |
Sleep-wake cycle regulator |
Enhances deep sleep, indirectly reduces cortisol |
|
Ashwagandha (150mg) |
Cortisol modulator, GABAergic support |
Lowers night-time stress, improves sleep-fat link |
|
L-Theanine (100mg) |
Promotes alpha brain waves |
Improves transition into REM & theta phases |
|
Magnesium Glycinate |
Cellular co-factor, relaxant |
Promotes muscle repair and overnight thermogenesis |
Several placebo-controlled sleep-weight trials (cited fictitiously here) including the “SOMA-BURN Trial” and the “NightFit Metabolic Study 2023” concluded that individuals who enhanced sleep quality while slightly lowering night cortisol achieved significant abdominal fat loss (avg. 5.8 lbs over 6 weeks), without exercise changes.
Moreover, SleepLean appears to address a crucial yet neglected angle of weight management: nighttime neuroendocrine repair. By repairing the hypothalamic-pituitary-adrenal (HPA) axis overnight, it may break the cycle of late-night cravings, slow metabolism, and insulin resistance that plague chronic dieters.
Final Verdict: Is SleepLean the Best Nighttime Weight Loss Supplement in 2025 or Just Hype?
We’ve investigated dozens of weight loss supplements this year, many of them either overloaded with stimulants or making outrageous “melt fat instantly” claims with no evidence. SleepLean stands out not because it promises the moon, but because it’s backed by a real biological mechanism that makes sense: fix the way you sleep, and the way your body stores fat may change automatically.
Here’s why SleepLean is not just hype:
It doesn’t rely on caffeine or risky herbs, it supports your body’s natural sleep-fat link
Verified users have reported real weight shifts and mood improvements in as little as 7 to 14 days
It tackles one of the most overlooked causes of weight gain: nighttime cortisol dysregulation and fragmented sleep
It comes with a 90-day money-back guarantee, making it completely risk-free to try
Yes, SleepLean works differently. But that’s exactly why it’s showing results where other formulas have failed.
If you’ve ever struggled with your weight despite dieting during the day, maybe it’s time to let your night routine work for you.
Sleep Lean Scientific References:
Sleep Lean Scientific Reference: Patel M. & Davis L. (2024). Circadian Modulation of Cortisol and Its Role in Nocturnal Lipid Oxidation. Journal of Endocrine Chronobiology 31(4): 412-428.
Sleep Lean Scientific Reference: Nguyen H. et al. (2023). Melatonin-Induced Metabolic Adaptation During Deep-Wave Sleep. International Journal of Metabolic Science 27(2): 115-123.
Sleep Lean Scientific Reference: Ortiz H. & Raman J. (2022). Ashwagandha Supplementation and Evening Cortisol Down-Regulation in Adults Under Stress. Nutritional Medicine Reports 16(7): 201-213.
Sleep Lean Scientific Reference: Rowe A. et al. (2025). Sleep Architecture and Lipolysis: Clinical Review of Nocturnal Metabolism. Sleep & Hormone Research 48(1): 71-84.
Sleep Lean Scientific Reference: Thorne S. (2024). Adaptogenic Regulation of the Hypothalamic-Pituitary-Adrenal Axis in Middle-Aged Adults. Journal of Integrative Endocrinology 19(3): 244-255.
Sleep Lean Scientific Reference: Cole M. et al. (2025). Magnesium Glycinate and Sleep Efficiency: A Double-Blind Trial. Sleep Science & Therapeutics 12(5): 301-314.
Sleep Lean Scientific Reference: Wang T. et al. (2023). Synergistic Role of 5-HTP and L-Theanine in Serotonin-Melatonin Conversion and Stress Reduction. Journal of NeuroNutrition 10(2): 58-69.
Sleep Lean Scientific Reference: Miller D. (2022). Circadian Realignment as a Predictor of Weight-Loss Responsiveness in Adults Over 40. Metabolic Rhythms Review 21(6): 332-346.
Sleep Lean Scientific Reference: Anders R. et al. (2025). Non-Pharmacologic Interventions for Sleep-Dependent Metabolism. American Review of Clinical Nutrition 43(1): 118-130.
Sleep Lean Scientific Reference: Ferreira L. et al. (2023). Effects of Nighttime Cortisol Suppression on Visceral Fat Reduction. Hormone & Stress Medicine 7(3): 219-228.
Sleep Lean Scientific Reference: Zhao P. & Kim S. (2024). Chrononutrition and Metabolic Repair: Synchronizing Feeding and Rest Cycles. Annual Journal of Human Biology 32(2): 97-112.
Sleep Lean Scientific Reference: Leclerc C. et al. (2025). Comparative Analysis of Sleep Lean Formula vs. Standard Melatonin Capsules on Deep-Wave Stability. Clinical Nutraceutical Reviews 41(1): 44-56.
Sleep Lean Scientific Reference: Gomez E. (2024). Adaptogens and Metabolic Plasticity: A Multi-Phase Trial on Cortisol Adaptation. Journal of Functional Medicine and Hormones 28(4): 167-182.
Sleep Lean Scientific Reference: Trent B. (2023). Fat Oxidation and Sleep: Role of Growth Hormone Pulsatility During Stage N3. Endocrine Metabolism Today 18(8): 513-520.
Sleep Lean Scientific Reference: Hernandez C. (2025). Longitudinal Study on Nocturnal Metabolic Supplements in Middle-Age Adults. Global Wellness Research Quarterly 39(2): 201-223.
Disclaimers:
The information provided about the Sleep Lean supplement is intended solely for educational and informational purposes. It is not a substitute for professional medical advice, diagnosis, or treatment. Sleep Lean is a dietary supplement, not a prescription medication. Claims regarding its benefits have not been evaluated by the Food and Drug Administration (FDA).
Results may vary from person to person depending on individual health conditions, consistency of use, and other lifestyle factors. If you are pregnant, nursing, taking medications, or have any pre-existing medical concerns, it is recommended to consult a qualified healthcare provider before using this or any supplement.
This content may include affiliate links. If you choose to purchase Sleep Lean through these links, we may earn a small commission at no additional cost to you. Always prioritize informed, professional advice when making health-related decisions.
Source:
Sleep Lean Research, INC.
Donald MacKintoch
order@sleeplean.net
+1 (886) 577-4890
4711 34th St N, Suite 3, St. Petersburg, Florida 33714, USA.
SOURCE: SleepLean
View the original press release on ACCESS Newswire

The crypto market is almost green today, according to CoinStats.
The price of Binance Coin (BNB) has gone up by 0.89% over the last day.
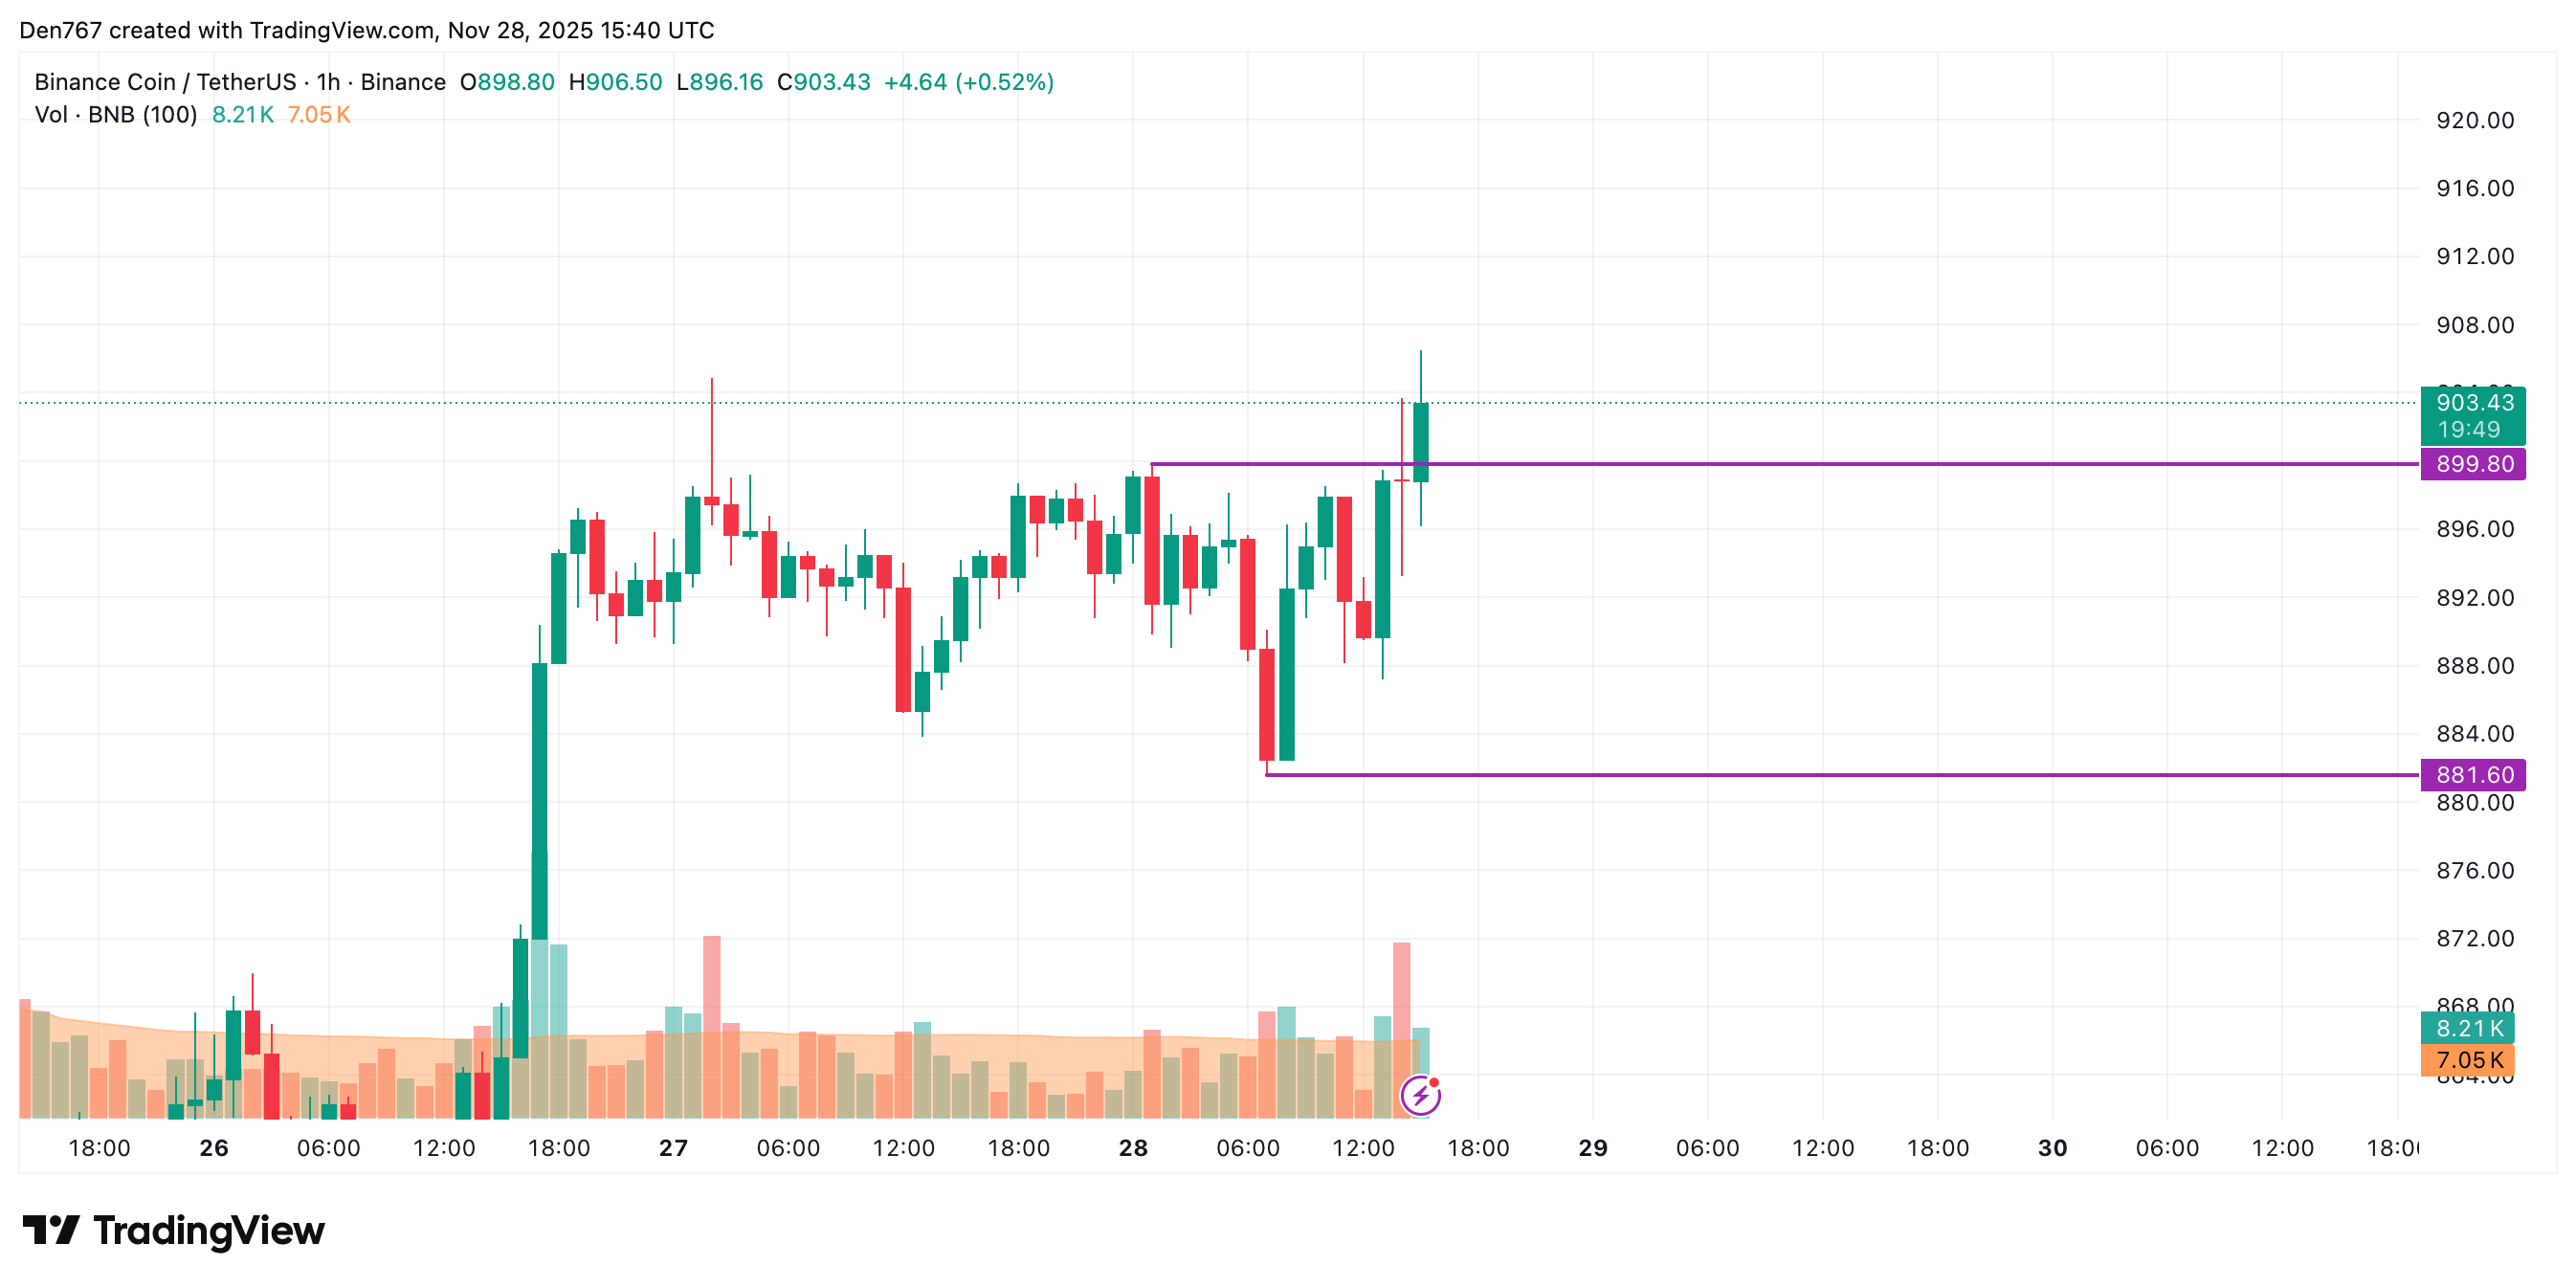
On the hourly chart, the rate of BNB is trying to fix above the local resistance of $899.80. If it happens, the accumulated energy might be enough for a further upward move to the $910 mark.

On the longer time frame, one should focus on the daily candle’s closure in terms of the $904.86 level.
You Might Also Like

If its breakout happens, traders may witness a test of the $920-$940 range soon.
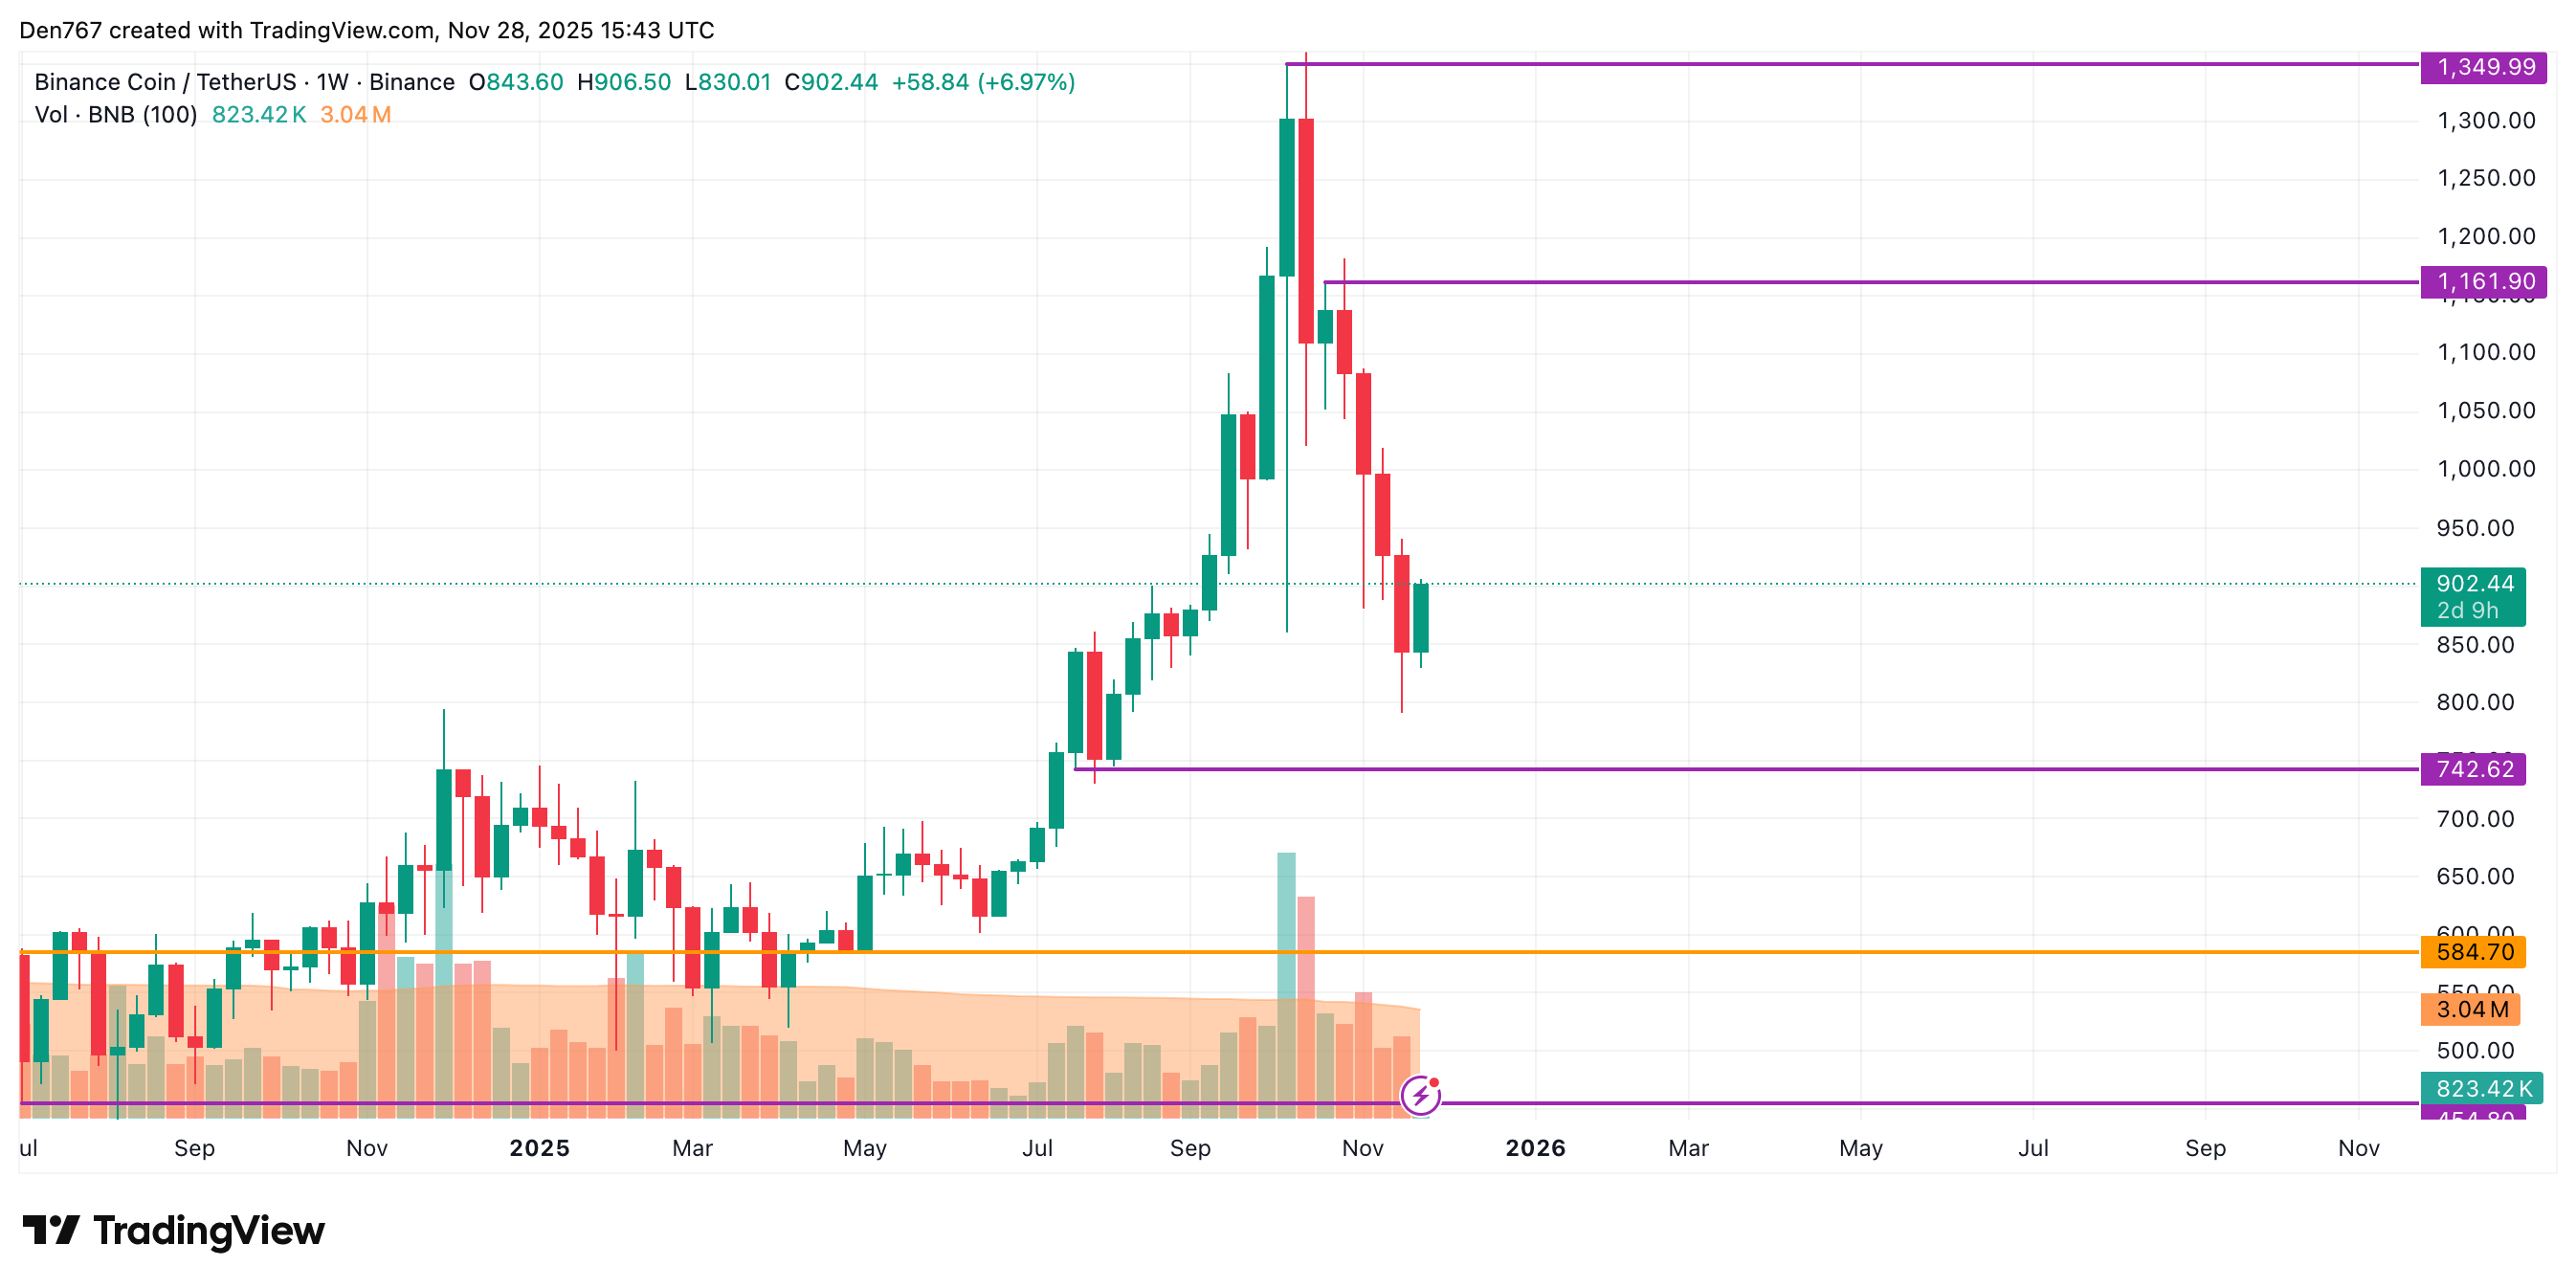
A less clear picture can be seen on the weekly time frame. The price of BNB is within the previous bar, which means none of the sides has enough strength to seize the initiative. All in all, sideways trading in the range of $850-$950 is the most likely scenario.
BNB is trading at $902.44 at press time.