The main tag of Forex News Today Articles.
You can use the search box below to find what you need.
[wd_asp id=1]

5 10, 2025

Japanese Yen Weekly Forecast: Will LDP Election Result Spur Yen Slide as BoJ Awaits?

By |2025-10-05T21:28:55+03:00October 5, 2025|Forex News, News|0 Comments

FX Empire – Japan Producer Prices

Bookmark our real-time updates to stay ahead of USD/JPY volatility.

USD/JPY Outlook: Economic Indicators and the BoJ

  • Bullish Yen Scenario: Upbeat Japanese data or hawkish BoJ rhetoric could drag USD/JPY toward 145.
  • Bearish Yen Scenario: Weaker data or dovish policy signals may send the pair toward 150.

The US economic calendar will likely determine the likelihood of an October Fed rate cut this week. Labor market data, consumer sentiment, and Fed speakers will be in the spotlight.

Key events include:

  • Initial Jobless Claims (October 9): Expected to increase from 218k (week ending September 20) to 223k (week ending September 27).
  • Michigan Consumer Sentiment (October 10): Forecast to fall from 55.1 in September to 55.0 in October.
  • Nonfarm Payrolls (provisionally October 10): Expected to increase by 39k in September after a 22k rise in August.
  • Unemployment Rate (provisionally October 10): Forecast to remain at 4.3% in September.
  • Average Hourly Earnings (provisionally October 10): Expected to rise 3.7% year-on-year in September, mirroring August’s increase.

Weaker-than-expected US labor market data and consumer sentiment could fuel bets on aggressive Fed rate cuts. A more dovish Fed rate path would weigh on the US dollar and the USD/JPY pair.

On the other hand, stronger-than-expected labor market data and an upswing in consumer confidence could signal a less dovish Fed policy stance. Fading bets on multiple Fed rate cuts in the fourth quarter would lift US dollar demand and send USD/JPY higher.

Traders should be aware that the labor market data may face more delays if lawmakers fail to pass a stopgap funding bill. The US government shutdown postponed last week’s jobless claims data and the US jobs report.

Beyond the data, traders should also monitor Fed speeches, including remarks from Fed Chair Powell on Thursday, October 9. There is also a wave of Fed speakers scheduled throughout the week and the FOMC meeting minutes to consider.

Short-term Forecast:

  • Bullish US Dollar Scenario: Strong US economic data or hawkish Fed rhetoric may send USD/JPY toward 150.
  • Bearish US Dollar Scenario: Weaker US data or dovish Fed signals could push USD/JPY toward 145.

USD/JPY Price Action

Daily Chart

On the daily chart, USD/JPY trades below the 50- and 200-day Exponential Moving Averages (EMAs), signaling a bearish bias.

A breakout above the 50- and 200-day EMAs could pave the way toward the 149.358 resistance level. A sustained move through 149.358 may bring the August high of 150.917 into play.

On the downside, a break below last week’s low of 146.585 could expose the crucial 145 support level. If breached, the July low of 142.681 would be the next key support level.

Source link

5 10, 2025

Weekly Forex Forecast 05/10 : EUR/USD, USD/CAD, S&P 500

By |2025-10-05T15:25:24+03:00October 5, 2025|Forex News, News|0 Comments

Last week maintained the dominant trends seen in recent weeks, with major US stock market indices and precious metals breaking to new record or long-term high prices.

Fundamental Analysis & Market Sentiment

I wrote on the 28th September that the best trades for the week would be:

  1. Long of the S&P 500 Index after a daily (New York) close above 6,703. This set up at Wednesday’s close, and over the remainder of the week, the price rose by 0.09%.
  2. Long of the NASDAQ 100 Index after a daily (New York) close above 24,794. This set up at Wednesday’s close, and over the remainder of the week, the price fell by 0.10%.
  3. Long of Gold following a New York close above $3,800. This set up at Monday’s close, and over the remainder of the week, the price rose by 1.37%.
  4. Long of Silver. Silver rose by 3.87% over the week.

These trades produced an overall gain of 5.23%, equal to 1.31% per asset.

A summary of last week’s most important data (some US releases were postponed due to the government shutdown in the USA):

  1. US JOLTS Job Openings – this was a little stronger than expected, suggesting the US economy may be slowing down a little less than was thought.
  2. US ISM Services PMI – slightly worse than expected.
  3. US ISM Manufacturing PMI – as expected.
  4. Reserve Bank of Australia Cash Rate & Rate Statement – the RBA left its Official Cash Rate on hold at 3.60% as expected, was slightly hawkish in its rhetoric.
  5. Swiss CPI (inflation) – contracted by 0.2% month-on-month, as expected.
  6. Chinese Manufacturing PMI – this was approximately as expected.

It was a relatively quiet week in the market, especially concerning themes and perceptions. There is little to say. The US government went into one of its periodic shutdown caused by political deadlock, but these shutdowns have become normalized in recent years and rarely cause much in the markets.

Bullishness remains solid in stock markets, especially in the USA, with major stock indices there continuing to rise to new highs. Precious metals have also been rising strongly, in the case of Gold, to new all-time high prices. The Forex market remains relatively quiet.

This is likely to be a good time to trade or invest, with Silver really taking off, while Gold and major US stock market indices continue to break to new record high prices.

The Week Ahead: 6th– 10th October

The coming week might see more activity in the market, as we have US non-farm payrolls data due which could impact perceptions of where the US economy is headed over the near term. There is also key average hourly earnings due, as well as FOMC minutes and a central bank meeting in New Zealand.

This week’s most important data points, in order of likely importance, are:

  1. US Average Hourly Earnings
  2. US Non-Farm Employment Change
  3. US Preliminary UoM Inflation Expectations
  4. US Preliminary UoM Consumer Sentiment
  5. FOMC Meeting Minutes
  6. Reserve Bank of New Zealand Policy Meeting
  7. US Unemployment Claims
  8. Canadian Employment Change
  9. Canadian Unemployment Rate

It is a public holiday in China on Monday and Tuesday.

Australia moves to daylight savings time at the start of this week.

Monthly Forecast October 2025

Currency Price Changes and Interest Rates

For the month of October 2025, I forecast that the EUR/USD currency pair will rise in value.

Weekly Forecast 5th October 2025

I made no weekly forecast last week.

There were no unusually large price movements in currency crosses last week, so I have no weekly forecast this week.

The Japanese Yen was the strongest major currency last week, while the US Dollar was the weakest. Volatility was unchanged compared to last week, with again only 15% of major pairs and crosses changing in value by more than 1%.

Next week’s volatility is likely to increase.

You can trade these forecasts in a real or demo Forex brokerage account.

Technical Analysis

Key Support/Resistance Levels for Popular Pairs

Currency Pair

Key Support / Resistance Levels

AUD/USD

Support: 0.6584, 0.6572, 0.6559, 0.6552Resistance: 0.6613, 0.6659, 0.6696, 0.6720

EUR/USD

Support: 1.1728, 1.1682, 1.1602, 1.1515Resistance: 1.1768, 1.1789, 1.1821, 1.1844

GBP/USD

Support: 1.3467, 1.3448, 1.3413, 1.3386Resistance: 1.3534, 1.3561, 1.3587, 1.3656

USD/JPY

Support: 146.68, 146.11, 145.14, 144.96Resistance: 147.79, 148.47, 149.60, 150.01

AUD/JPY

Support: 97.14, 96.80, 96.68, 96.30Resistance: 97.50, 97.63, 98.22, 98.81

EUR/JPY

Support: 172.81, 172.26, 171.99, 171.57Resistance: 173.46, 173.98, 174.61, 174.75

USD/CAD

Support: 1.3935, 1.3903, 1.3879, 1.3864Resistance: 1.3959, 1.4012, 1.4055, 1.4131

USD/CHF

Support 0.7932, 0.7878, 0.7800, 0.7700Resistance: 0.7971, 0.8008, 0.8039, 0.8049

Key Support and Resistance Levels

US Dollar Index

Last week, the US Dollar Index printed a bearish inside candlestick following on from the previous week’s bullish pin bar continuation. However, the candlestick is not very bearish as it has a significant lower wick and the price action is clearly within a consolidation zone. Despite being below its level of 26 weeks ago, the price is above where it was 13 weeks ago, so by my preferred metric, I can declare the long-term bearish trend is over. This places the US Dollar in an interesting position.

There is more consensus now in the market about the Fed’s path of rate cuts over the rest of 2025 and 2026, and I think this means the current consolidation in the greenback is likely to continue over the near term. So, I am neutral on the Dollar, and think trades should be taken over the coming week on the merits of other assets but not the Dollar.

Weekly Forex Forecast 05/10 : EUR/USD, USD/CAD, S&P 500

US Dollar Index Weekly Price Chart

EUR/USD

The EUR/USD currency pair rose very weakly last week by printing a bullish inside candlestick, although like DXY considered above, it has a significant wick against this move. It is worth noting that there is a bullish long-term trend which is still valid. The Euro is also showing some relative strength lately, rising to new long-term highs against several other currencies beyond the US Dollar.

Bulls should be worried that the bearish pin bar couple of weeks ago rejected a new 4-year high just above a consolidation zone just after the initial breakout. The price is struggling to regain its recent highs above $1.1800.

Despite these cautionary factors, I remain long of this currency pair as this currency pair historically tends to respect its long-term trends very well, and I see a potential new long trade entry if get a daily (New York) close above $1.1867. However, if you are going to buy on the dips, the support levels at $1.1728 and $1.1682 look like attractive areas to spot bullish bounces.

Weekly Forex Forecast 05/10 : EUR/USD, USD/CAD, S&P 500

EUR/USD Weekly Price Chart

USD/CAD

The USD/CAD currency pair daily chart shows a higher low, and notably, both the two lows are also triple bottoms when you drill into the daily chart! This could be seen as a bullish price action signal, worthy of entering a long trade. However, there is a confluence of a big round number not far above, at $1.4000, and a key resistance level just above it, could still stop a meaningful advance here.

If you are looking for a long trade on the recent pullback at the end of last week, bullish bounces at $1.3935 or $1.3903.

Weekly Forex Forecast 05/10 : EUR/USD, USD/CAD, S&P 500

USD/CAD Dailly Price Chart

S&P 500 Index

The S&P 500 Index printed a bullish candlestick candlestick last week, which reached and closed at yet another all-time high. The price is trading in blue sky and it could only be more bullish if the price had closed right on the high. However, Friday did see the Index give up some of its recent gains.

US stock markets are rising strongly although many analysts see the market as hugely overvalued. I put the continued advance to new highs down to the Trump effect as people believe President Trump will do anything to boost the market.

The index has risen by about 15% since the start of 2025 with the rise really happening in the aftermath of the Trump tariff panic. It is an open question how much further the current bull run will go, but betting against new record highs in the US stock market is a brave and probably foolish move, unless it’s a cautious play in individual underperforming stocks.

I remain bullish on the S&P 500 Index and see it as an unequivocal buy.

Weekly Forex Forecast 05/10 : EUR/USD, USD/CAD, S&P 500

S&P 500 Index Weekly Price Chart

NASDAQ 100 Index

Everything I wrote above about the S&P 500 Index also applies to the NASDAQ 100 Index, except the NASDAQ 100 Index has risen by 18%, more than the S&P’s 2025 to date increase of 15%.

I remain bullish on the NASDAQ 100 Index and see it as an unequivocal buy.

Weekly Forex Forecast 05/10 : EUR/USD, USD/CAD, S&P 500

NASDAQ 100 Index Weekly Price Chart

XAG/USD

Silver had yet another great week, showing yet another outsize rise in value of almost 4%, and powering up to a new 14-year high which is now very close to the all-time high made in 2011. It also outperformed Gold and all other precious metals. These are bullish signs, as is the breakout from the linear regression analysis shown within the price chart below – the price is well above the upper bound.

With Silver’s outperformance against Gold, it is probably worth being bold on the long side here.

Having said, if you are just entering a new long trade here, as the move is quite extended, a smaller position size might be wise. Volatility is high, so a strong downwards movement is possible when the retracement finally comes.

I remain very bullish on Silver but worry that it may have peaked on such a large move. Trading the trend with a trailing stop is a good answer to this dilemma if you do it systematically. There could well be profit taking at $50, especially if Gold reaches $4,000 systematically.

Weekly Forex Forecast 05/10 : EUR/USD, USD/CAD, S&P 500

XAG/USD Weekly Price Chart

XAU/USD

Gold rose last week to rise to print a new all-time high, but closed a bit below that high and the round number at $4,000. It is worth noting that Gold underperformed Silver last week, but not by a lot

The long-term bullish trend and break to new record highs are bullish factors, as is the strong US stock market, as the US stock market has tended to be positively correlated with Gold, to the surprise of many who see it as a hedge against inflation.

For anyone who is only entering a long trade now, it might be wise to use a smaller position size to account for any sudden high-volatility snapback towards lower prices. Just like the stock market, you have to wonder how much further this bull run will last – but it is backed by a very strong long-term bullish trend, and you trade against that at your peril unless you start to see clear signs of a reversal in the price action – which is not showing here yet.

There could well be profit taking at $4,000, especially if Silver reaches $50 simultaneously.

I am bullish on Gold, but it might be wise to take a smaller long position here than with Silver, which looks more bullish.

Weekly Forex Forecast 05/10 : EUR/USD, USD/CAD, S&P 500

XAU/USD Weekly Price Chart

Bottom Line

I see the best trades this week as:

  1. Long of the S&P 500 Index.
  2. Long of the NASDAQ 100 Index.
  3. Long of Silver.
  4. Long of Gold.

Ready to trade our Forex weekly forecast? Check out our list of the top 100 Forex brokers.

Source link

5 10, 2025

Pound to Euro Week Ahead Forecast: Divided Between 1.11 and 1.22 Targets

By |2025-10-05T13:24:21+03:00October 5, 2025|Forex News, News|0 Comments


– Written by

The Pound to Euro exchange rate (GBP/EUR) outlook remains under pressure near 1.1430 as bond-market jitters and fiscal concerns weigh on Sterling.

Exchange rate forecasts remain sharply divided: Goldman Sachs sees losses to 1.11 on a 12-month view, citing labour market vulnerabilities and fiscal consolidation risks, while Scotiabank expects gains to 1.22 by the end of next year, arguing the pound’s fundamentals remain supportive.

GBP/EUR Forecasts: Watching the bond market

Goldman Sachs forecasts that the Pound to Euro (GBP/EUR) exchange rate will weaken steadily to 1.11 on a 12-month view.

In contrast, Scotiabank expects gains to 1.22 by the end of next year.

During the week, GBP/EUR dipped to 8-week lows below 1.1430 during the week amid renewed jitters in the bond market and higher yields.

Goldman Sachs notes that the Pound could gain yield support, but commented; “Nonetheless, we still see a sufficiently broad range of factors to support further Sterling underperformance versus European peers from here.”

Save on Your GBP/EUR Transfer

Get better rates and lower fees on your next international money transfer.
Compare TorFX with top UK banks in seconds and see how much you could save.


Compare the Best GBP/EUR Rates »

It added; “Vulnerabilities in the UK labour market, the need for further fiscal consolidations at the Autumn budget, global cyclical risks, and a challenging structural valuation picture still point to a gradual drift higher in EUR/GBP from here in our view. (GBP/EUR losses)

ANZ also noted potential vulnerability; “On the fiscal side, with the Autumn Budget due in November, there are broader concerns about fiscal headroom in view of the expected spending plans and increase taxes for both households and businesses.”

It added; “With reduced gilt demand from defined-benefit pension funds, the UK’s reliance on foreign inflows and taxes to fund deficits has increased.”

Scotiabank is more positive on the Pound fundamentals; “Political uncertainty relating to the UK’s fiscal outlook has moderated considerably, shifting sentiment in a constructive manner.”

It added; “The pound’s fundamental outlook remains bullish given the BoE’s cautiously neutral stance.”

Wells Fargo; “In light of still-elevated wage and price growth, we now expect the U.K. central bank to hold rates steady during the fourth quarter. We see BoE rate cuts resuming in early 2026, as economic growth and inflation slow more clearly.”

As far as the Euro-Zone is concerned, there was a notably weaker than expected German IFO reading for September with declines in the current conditions and expectations components.

ING commented; “The optimism of the first months of the year has swiftly been brought back down to earth. This does not automatically mean that hopes for a recovery should be given up entirely – but it does mean that the economy is set for yet another year in stagnation. It now really needs a ‘Fall of reforms’ to make sure that three years of stagnation are not followed by a fourth.

Rabobank noted that geo-political risk factors could undermine the Euro; “We start with the NATO statement, which met for the second time in two weeks to discuss matters under Article 4 of the Washington Treaty.”

Like this piece? Please share with your friends and colleagues:


International Money Transfer? Ask our resident FX expert a money transfer question or try John’s new, free, no-obligation personal service! ,where he helps every step of the way,
ensuring you get the best exchange rates on your currency requirements.

TAGS: Pound Euro Forecasts

Source link

4 10, 2025

EUR/USD, USD/JPY and AUD/USD Forecast – US Dollar Continues to be Choppy

By |2025-10-04T01:00:38+03:00October 4, 2025|Forex News, News|0 Comments

USD/JPY Technical Analysis

The US dollar has rallied a bit during the early hours here against the Japanese yen, but it does look like it’s struggling a bit. I think it’s probably only a matter of time before we do bounce, but getting above the 200-day EMA seems to be a bit of a chore in the short term. Longer term, we’re closer to the bottom of a range than we are at the top. So, I think it does make a certain amount of sense that eventually we will try to reach the top again near the 149 yen level.

AUD/USD Technical Analysis

The Australian dollar has rallied ever so slightly during the session here on Friday, but we find ourselves just hanging around the 0.66 level. Now, while we are in an uptrend, it’s been more of a grind than anything else. What I’m watching for is whether or not we start falling from here because if we break down below the Friday candlestick of last week, that actually makes a lower high and a lower low, the beginning of a downtrend.

To the upside, if we can break above the 0.6650 level, we may challenge 0.67, but the Australian dollar has very little in the way of momentum and has been in this attitude since the middle of April. So, with that being the case, I’m not overly impressed, but this is a market that I think continues to be very choppy more than anything else.

For a look at all of today’s economic events, check out our economic calendar.

Source link

3 10, 2025

USD/JPY Forecast oday 03/10: Testing Support (Video&Chart)

By |2025-10-03T22:58:57+03:00October 3, 2025|Forex News, News|0 Comments

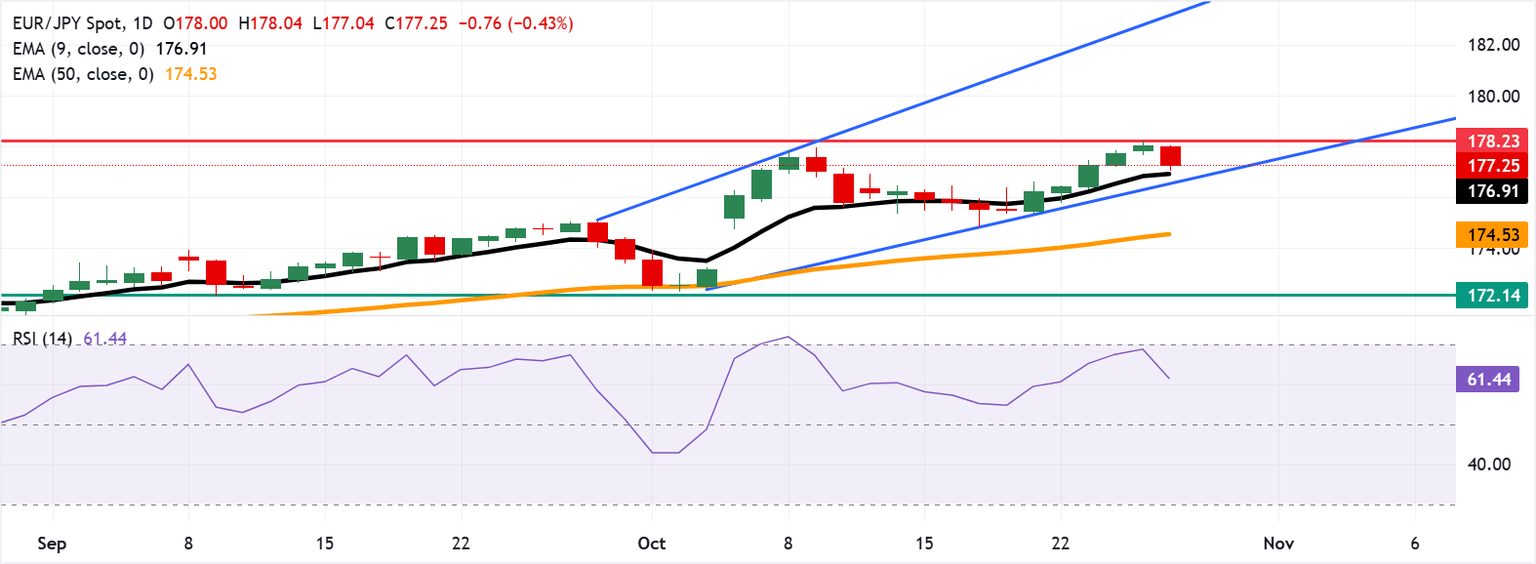
  • The US dollar has been very noisy overall, as we have seen a lot of questions asked of the dollar against the Japanese yen.
  • We are falling toward the bottom of the previous consolidation area, and it is worth noting that the 146 yen level has been massive support, and we did bounce from there to show signs of life.

50 Day EMA

At the top of the candlestick, we have the 50 day EMA. And if we can break above there, it’s possible that we could go look into the 149 yen level. That is the top of the previous consolidation range. And therefore, a lot of people will be looking at it very intently. Anything above there opens up the possibility of moving to the 151 yen level. This is a market that I think given enough time, we’ll have to make a bigger decision. But right now, the interest rate differential still favors the U.S. dollar of the Japanese yen.

And that, of course, makes quite a bit of sense that traders would be willing to buy on the dips. The last couple of days have been rather rough for the US dollar against the Japanese yen. But we are seeing the US dollar fight against other currencies around the world, not just the yen. So, I’m looking for a balance here. If we were to break down below the 145.50 yen level, then I think that throws that narrative out the window.

Nonetheless, this is a market that I’ve been collecting swap in for quite some time, buying dips, selling bounces, that type of thing. Ultimately, the 50 day EMA and the 200 day EMA indicators are sitting on top of each other and flat showing signs of hesitation, just sideways action. And that action will continue to be sideways. I think the main theory and main theme here of what’s going on, but given enough time, I do favor the upside.

Want to trade our USD/JPY forex analysis and predictions? Here’s a list of forex brokers in Japan to check out.

Christopher Lewis has been trading Forex and has over 20 years experience in financial markets. Chris has been a regular contributor to Daily Forex since the early days of the site. He writes about Forex for several online publications, including FX Empire, Investing.com, and his own site, aptly named The Trader Guy. Chris favours technical analysis methods to identify his trades and likes to trade equity indices and commodities as well as Forex. He favours a longer-term trading style, and his trades often last for days or weeks.
Source link

3 10, 2025

EUR/USD Forecast Today 03/10: Euro Volatile (Video&Chart)

By |2025-10-03T20:58:21+03:00October 3, 2025|Forex News, News|0 Comments

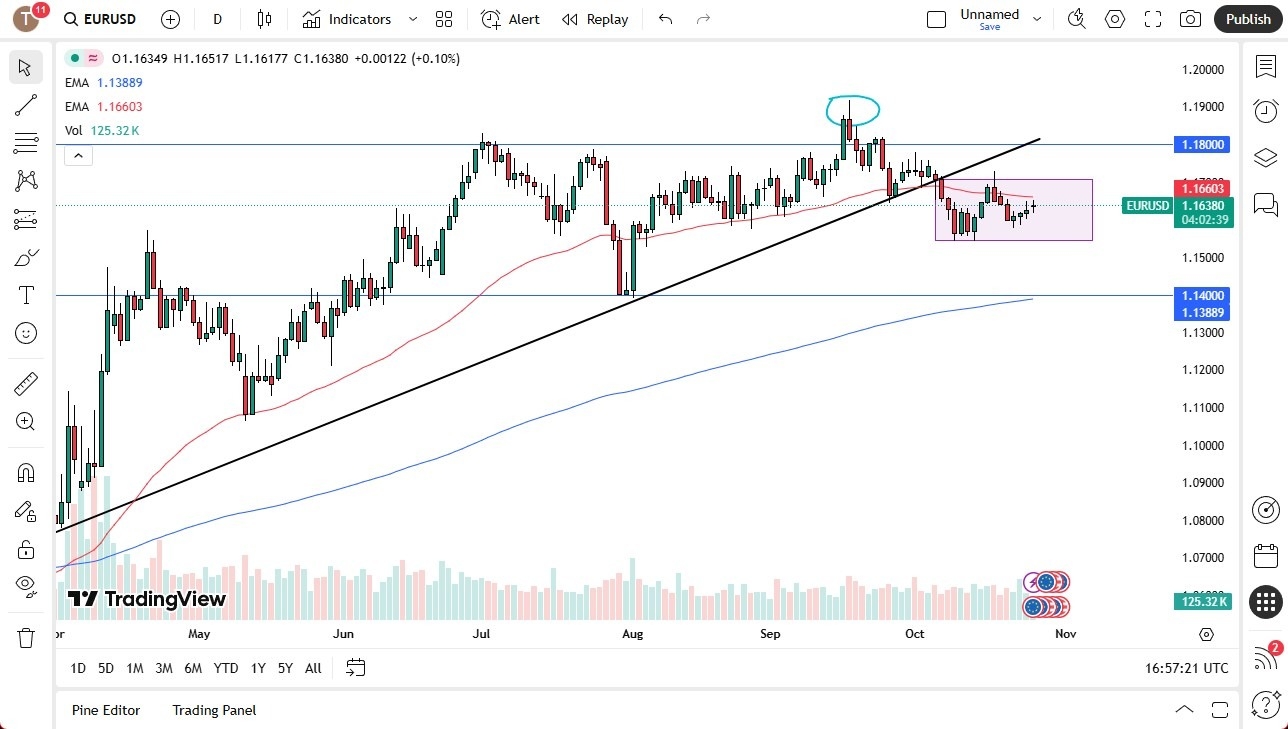
  • We’ve been all over the place during the trading session here on Thursday as we continue to see a lot of questions asked about the euro in general, because we have been trying everything we can to break out to the upside, but we just can’t seem to do it.
  • That being said, I also look at this as a market that continues to look at the 50 day EMA as a potential floor in the market right along with an uptrend line underneath there.

The rally that we have seen over the last four days has failed. Typically, it’ll happen in Asia, maybe drift into Europe a little bit. By the time the Americans get back on, the euro has been selling off.

Noise Above?

The 1.18 level above is significant resistance, and I think we need to watch that very closely. If we can get above there on a daily close, then the market could go to the 1.19 level, possibly even the 1.20 level. If we break down below that uptrend line, underneath that offer support, it opens up 1.16 as a potential target. If we break down below there, then the 1.14 level could very well be the next target. Ultimately, if we really start to break down at this point, I think you’ll see the US dollar shrink in against everything, not just the euro. It is worth noting that the absolute peak of the euro on this run has been during the FOMC meeting and press conference, and we’ve pretty much struggled since then. So, what that tells me is that the market is telling you something different than the narrative of the US dollar falling apart. I’m watching this trend line very closely because we break down below there, things could get interesting to the downside.

Ready to trade our daily Forex analysis? We’ve made a list of the best forex trading platforms for beginners worth trading with.

Christopher Lewis has been trading Forex and has over 20 years experience in financial markets. Chris has been a regular contributor to Daily Forex since the early days of the site. He writes about Forex for several online publications, including FX Empire, Investing.com, and his own site, aptly named The Trader Guy. Chris favours technical analysis methods to identify his trades and likes to trade equity indices and commodities as well as Forex. He favours a longer-term trading style, and his trades often last for days or weeks.
Source link

3 10, 2025

The GBPJPY attempts to settle above the support– Forecast today – 3-10-2025

By |2025-10-03T18:56:54+03:00October 3, 2025|Forex News, News|0 Comments

The GBPJPY pair remains affected by the negative pressure that comes from stochastic reach to the oversold level, to notice its attempt to reach below the support at 197.80, facing the moving average 55 then bouncing again to settle above the support as appears in the above image.


The stability above the current support will increase the chances of renewing the bullish attempts, to expect targeting some positive stations by its rally towards 198.80 and 199.80, while moving to the negative track requires forming strong bearish waves, to surpass the moving average 55, then target 196.30 level.


The expected trading range for today is between 197.55 and 198.80


Trend forecast: Bullish


Source link

3 10, 2025

The EURJPY keeps the bullish bias– Forecast today – 3-10-2025

By |2025-10-03T16:56:07+03:00October 3, 2025|Forex News, News|0 Comments

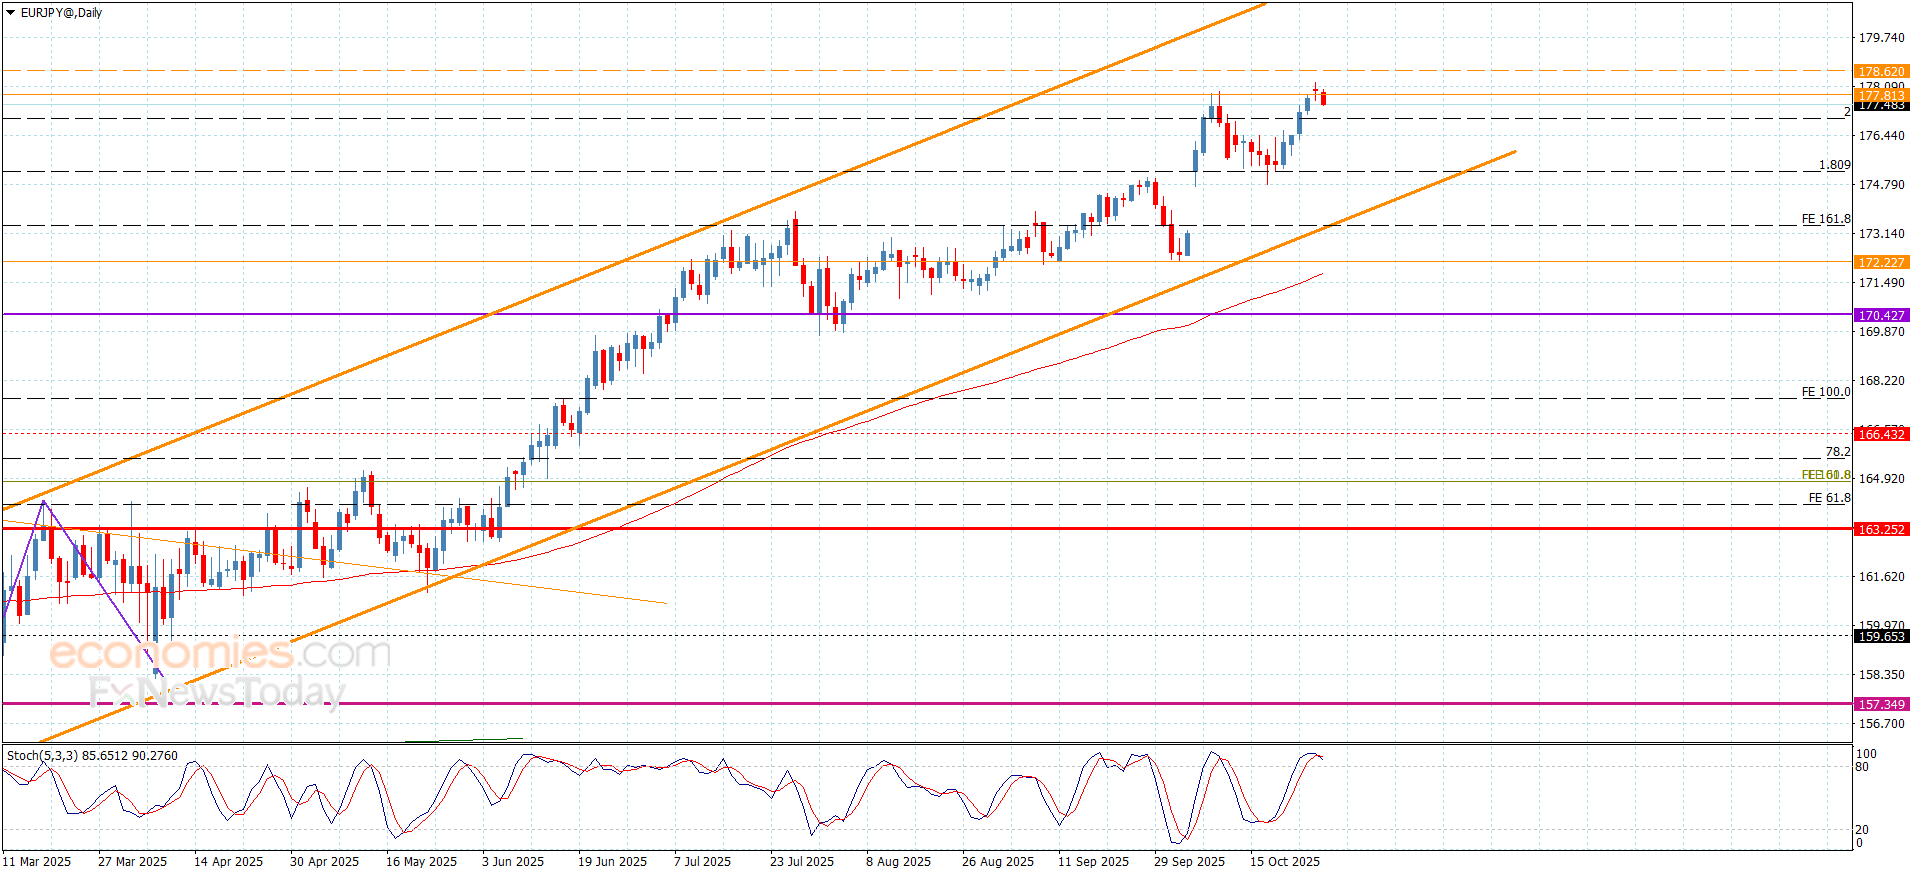
The EURJPY pair kept its positive stability above the extra support level at 172.20, which allowed it to achieve some gains, to notice its rally towards 173.20, approaching from the initial barrier at 173.40 level.


By the above image, we notice stochastic attempt to exit the oversold level, opening the way for more of the positive stations by its rally to 174.40, while suffering new negative pressure and reaching below 172.20 might push it to attack the support of the main bullish channel at 171.45 before any attempt to hit the positive targets.


The expected trading range for today is between 172.20 and 173.70


Trend forecast: Bullish


Source link

3 10, 2025

Pound Sterling bulls hesitate ahead of US PMI data

By |2025-10-03T14:54:45+03:00October 3, 2025|Forex News, News|0 Comments

After losing about 0.3% and snapping a four-day winning streak on Thursday, GBP/USD holds steady at around 1.3450 in the European session on Friday. The pair’s technical outlook points to a loss of bullish momentum as market focus shifts to the Institute for Supply Management’s (ISM) Services Purchasing Managers’ Index (PMI) data for September.

Pound Sterling Price This week

The table below shows the percentage change of British Pound (GBP) against listed major currencies this week. British Pound was the strongest against the Canadian Dollar.

USD EUR GBP JPY CAD AUD NZD CHF
USD -0.27% -0.40% -1.41% 0.22% -0.84% -0.76% -0.06%
EUR 0.27% -0.14% -1.28% 0.49% -0.56% -0.50% 0.19%
GBP 0.40% 0.14% -1.07% 0.63% -0.49% -0.36% 0.33%
JPY 1.41% 1.28% 1.07% 1.70% 0.63% 0.53% 1.41%
CAD -0.22% -0.49% -0.63% -1.70% -1.01% -0.98% -0.31%
AUD 0.84% 0.56% 0.49% -0.63% 1.01% 0.06% 0.76%
NZD 0.76% 0.50% 0.36% -0.53% 0.98% -0.06% 0.84%
CHF 0.06% -0.19% -0.33% -1.41% 0.31% -0.76% -0.84%

The heat map shows percentage changes of major currencies against each other. The base currency is picked from the left column, while the quote currency is picked from the top row. For example, if you pick the British Pound from the left column and move along the horizontal line to the US Dollar, the percentage change displayed in the box will represent GBP (base)/USD (quote).

In the second day of the US federal government shutdown on Thursday, the Senate did not vote on the funding legislation in observance of the Yom Kippur holiday.

Nevertheless, United States (US) President Donald Trump’s administration announced late Wednesday that they froze $26 billion for Democratic-leaning states. Additionally, Trump noted that he will meet with the head of the Office of Management and Budget, Russ Vought, to discuss which federal programs could be cut.

In case lawmakers make progress on finding an agreement to restore funding to the government following these developments, the US Dollar (USD) could gather strength heading into the weekend and cause GBP/USD to stretch lower.

Because of the shutdown, the US Bureau of Labor Statistics will not publish the Nonfarm Payrolls data for September later in the day. Instead, investors will scrutinize the ISM Services PMI report and its Employment Index component.

The ISM Services PMI is expected to stay in the expansion territory, slightly above 50, in September. If the headline PMI drops below 50, the immediate reaction could hurt the USD. In case the headline PMI remains above 50 and the Employment Index, which was 46.5 in August, rises above 50, the USD could outperform its rivals and weigh on GBP/USD.

GBP/USD Technical Analysis

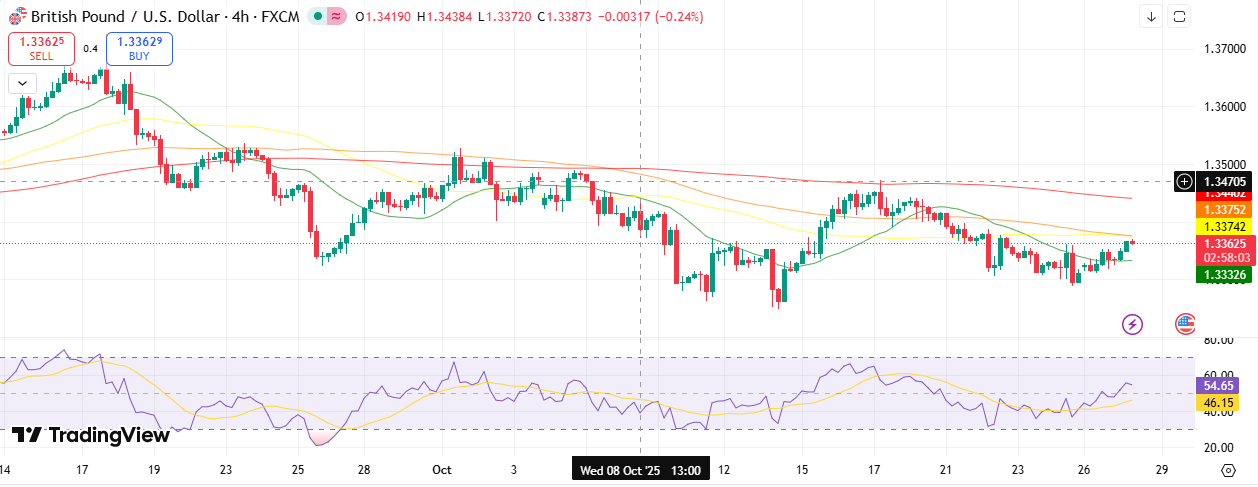
The Relative Strength Index (RSI) indicator on the 4-hour chart stays near 50, pointing to a lack of directional momentum.

The 100-day Simple Moving Average (SMA) and the 20-day SMA form a strong resistance level at 1.3500. The 100-period and the 200-period SMAs on the 4-hour chart reinforce this hurdle as well. In case GBP/USD clears 1.3500, technical buyers could show interest. In this scenario, 1.3550 (Fibonacci 23.6% retracement of the latest uptrend) could be seen as the next resistance level before 1.3600 (static level, round level).

On the downside, support levels 1.3410-1.3400 (Fibonacci 50% retracement, round level) and 1.3360 (Fibonacci 61.8% retracement).

Pound Sterling FAQs

The Pound Sterling (GBP) is the oldest currency in the world (886 AD) and the official currency of the United Kingdom. It is the fourth most traded unit for foreign exchange (FX) in the world, accounting for 12% of all transactions, averaging $630 billion a day, according to 2022 data.
Its key trading pairs are GBP/USD, also known as ‘Cable’, which accounts for 11% of FX, GBP/JPY, or the ‘Dragon’ as it is known by traders (3%), and EUR/GBP (2%). The Pound Sterling is issued by the Bank of England (BoE).

The single most important factor influencing the value of the Pound Sterling is monetary policy decided by the Bank of England. The BoE bases its decisions on whether it has achieved its primary goal of “price stability” – a steady inflation rate of around 2%. Its primary tool for achieving this is the adjustment of interest rates.
When inflation is too high, the BoE will try to rein it in by raising interest rates, making it more expensive for people and businesses to access credit. This is generally positive for GBP, as higher interest rates make the UK a more attractive place for global investors to park their money.
When inflation falls too low it is a sign economic growth is slowing. In this scenario, the BoE will consider lowering interest rates to cheapen credit so businesses will borrow more to invest in growth-generating projects.

Data releases gauge the health of the economy and can impact the value of the Pound Sterling. Indicators such as GDP, Manufacturing and Services PMIs, and employment can all influence the direction of the GBP.
A strong economy is good for Sterling. Not only does it attract more foreign investment but it may encourage the BoE to put up interest rates, which will directly strengthen GBP. Otherwise, if economic data is weak, the Pound Sterling is likely to fall.

Another significant data release for the Pound Sterling is the Trade Balance. This indicator measures the difference between what a country earns from its exports and what it spends on imports over a given period.
If a country produces highly sought-after exports, its currency will benefit purely from the extra demand created from foreign buyers seeking to purchase these goods. Therefore, a positive net Trade Balance strengthens a currency and vice versa for a negative balance.

Source link

3 10, 2025

Euro remains below key resistance area

By |2025-10-03T12:53:44+03:00October 3, 2025|Forex News, News|0 Comments

EUR/USD holds its ground and trades in positive territory, slightly below 1.1750, in the European session on Friday. With the postponement of the release of the September employment data because of the US federal government shutdown, investors will scrutinize the Institute for Supply Management’s (ISM) Services Purchasing Managers’ Index (PMI) data for September.

Euro Price This week

The table below shows the percentage change of Euro (EUR) against listed major currencies this week. Euro was the strongest against the Canadian Dollar.

USD EUR GBP JPY CAD AUD NZD CHF
USD -0.26% -0.39% -1.37% 0.23% -0.79% -0.66% -0.09%
EUR 0.26% -0.14% -1.26% 0.48% -0.52% -0.41% 0.15%
GBP 0.39% 0.14% -1.05% 0.62% -0.45% -0.27% 0.29%
JPY 1.37% 1.26% 1.05% 1.64% 0.63% 0.59% 1.33%
CAD -0.23% -0.48% -0.62% -1.64% -0.97% -0.89% -0.33%
AUD 0.79% 0.52% 0.45% -0.63% 0.97% 0.12% 0.69%
NZD 0.66% 0.41% 0.27% -0.59% 0.89% -0.12% 0.71%
CHF 0.09% -0.15% -0.29% -1.33% 0.33% -0.69% -0.71%

The heat map shows percentage changes of major currencies against each other. The base currency is picked from the left column, while the quote currency is picked from the top row. For example, if you pick the Euro from the left column and move along the horizontal line to the US Dollar, the percentage change displayed in the box will represent EUR (base)/USD (quote).

United States (US) President Donald Trump said on Wednesday that he will meet with Russ Vought, the head of the Office of Management and Budget, to see which federal programs could be cut. Additionally, the Trump administration announced that they froze $26 billion for Democratic-leaning states.

Markets could turn optimistic about the shutdown coming to an end soon, in case Democrats look to find a middle ground on the spending bill amid the threat of losing funds for their programs.

Nevertheless, the September employment report, which featured the Nonfarm Payrolls, Unemployment Rate and wage inflation figures, will not be released later in the day.

The ISM Services PMI is forecast to edge lower to 51.7 in September from 52 in August. In the absence of the NFP data, market participants could react to the Employment Index component of the survey, especially if the headline PMI arrives near the market expectation. If the Employment Index recovers above 50 and shows an increase in the service sector payrolls, the USD could gather strength heading into the weekend and cause EUR/USD to turn south. On the flip side, EUR/USD could gather bullish momentum in the American session if this data comes in below the August print of 46.5.

EUR/USD Technical Analysis

The Relative Strength Index (RSI) indicator on the 4-hour chart moves sideways near 50 and EUR/USD fluctuates between the 20-day and the 50-day Simple Moving Average (SMA), reflecting a neutral stance in the near term.

On the upside, 1.1750-1.1770 aligns as a strong resistance area, where the Fibonacci 23.6% retracement of the latest uptrend meets the 100-period SMA and the 20-day SMA. If EUR/USD manages to clear that hurdle, 1.1820 (static level) could be seen as the next resistance level before 1.1900 (static level, round level).

On the downside, the first support area is located 1.1710-1.1690 (200-period SMA, Fibonacci 38.2% retracement, 50-day SMA) ahead of 1.1640 (Fibonacci 50% retracement).

Euro FAQs

The Euro is the currency for the 19 European Union countries that belong to the Eurozone. It is the second most heavily traded currency in the world behind the US Dollar. In 2022, it accounted for 31% of all foreign exchange transactions, with an average daily turnover of over $2.2 trillion a day.
EUR/USD is the most heavily traded currency pair in the world, accounting for an estimated 30% off all transactions, followed by EUR/JPY (4%), EUR/GBP (3%) and EUR/AUD (2%).

The European Central Bank (ECB) in Frankfurt, Germany, is the reserve bank for the Eurozone. The ECB sets interest rates and manages monetary policy.
The ECB’s primary mandate is to maintain price stability, which means either controlling inflation or stimulating growth. Its primary tool is the raising or lowering of interest rates. Relatively high interest rates – or the expectation of higher rates – will usually benefit the Euro and vice versa.
The ECB Governing Council makes monetary policy decisions at meetings held eight times a year. Decisions are made by heads of the Eurozone national banks and six permanent members, including the President of the ECB, Christine Lagarde.

Eurozone inflation data, measured by the Harmonized Index of Consumer Prices (HICP), is an important econometric for the Euro. If inflation rises more than expected, especially if above the ECB’s 2% target, it obliges the ECB to raise interest rates to bring it back under control.
Relatively high interest rates compared to its counterparts will usually benefit the Euro, as it makes the region more attractive as a place for global investors to park their money.

Data releases gauge the health of the economy and can impact on the Euro. Indicators such as GDP, Manufacturing and Services PMIs, employment, and consumer sentiment surveys can all influence the direction of the single currency.
A strong economy is good for the Euro. Not only does it attract more foreign investment but it may encourage the ECB to put up interest rates, which will directly strengthen the Euro. Otherwise, if economic data is weak, the Euro is likely to fall.
Economic data for the four largest economies in the euro area (Germany, France, Italy and Spain) are especially significant, as they account for 75% of the Eurozone’s economy.

Another significant data release for the Euro is the Trade Balance. This indicator measures the difference between what a country earns from its exports and what it spends on imports over a given period.
If a country produces highly sought after exports then its currency will gain in value purely from the extra demand created from foreign buyers seeking to purchase these goods. Therefore, a positive net Trade Balance strengthens a currency and vice versa for a negative balance.

Source link

Go to Top