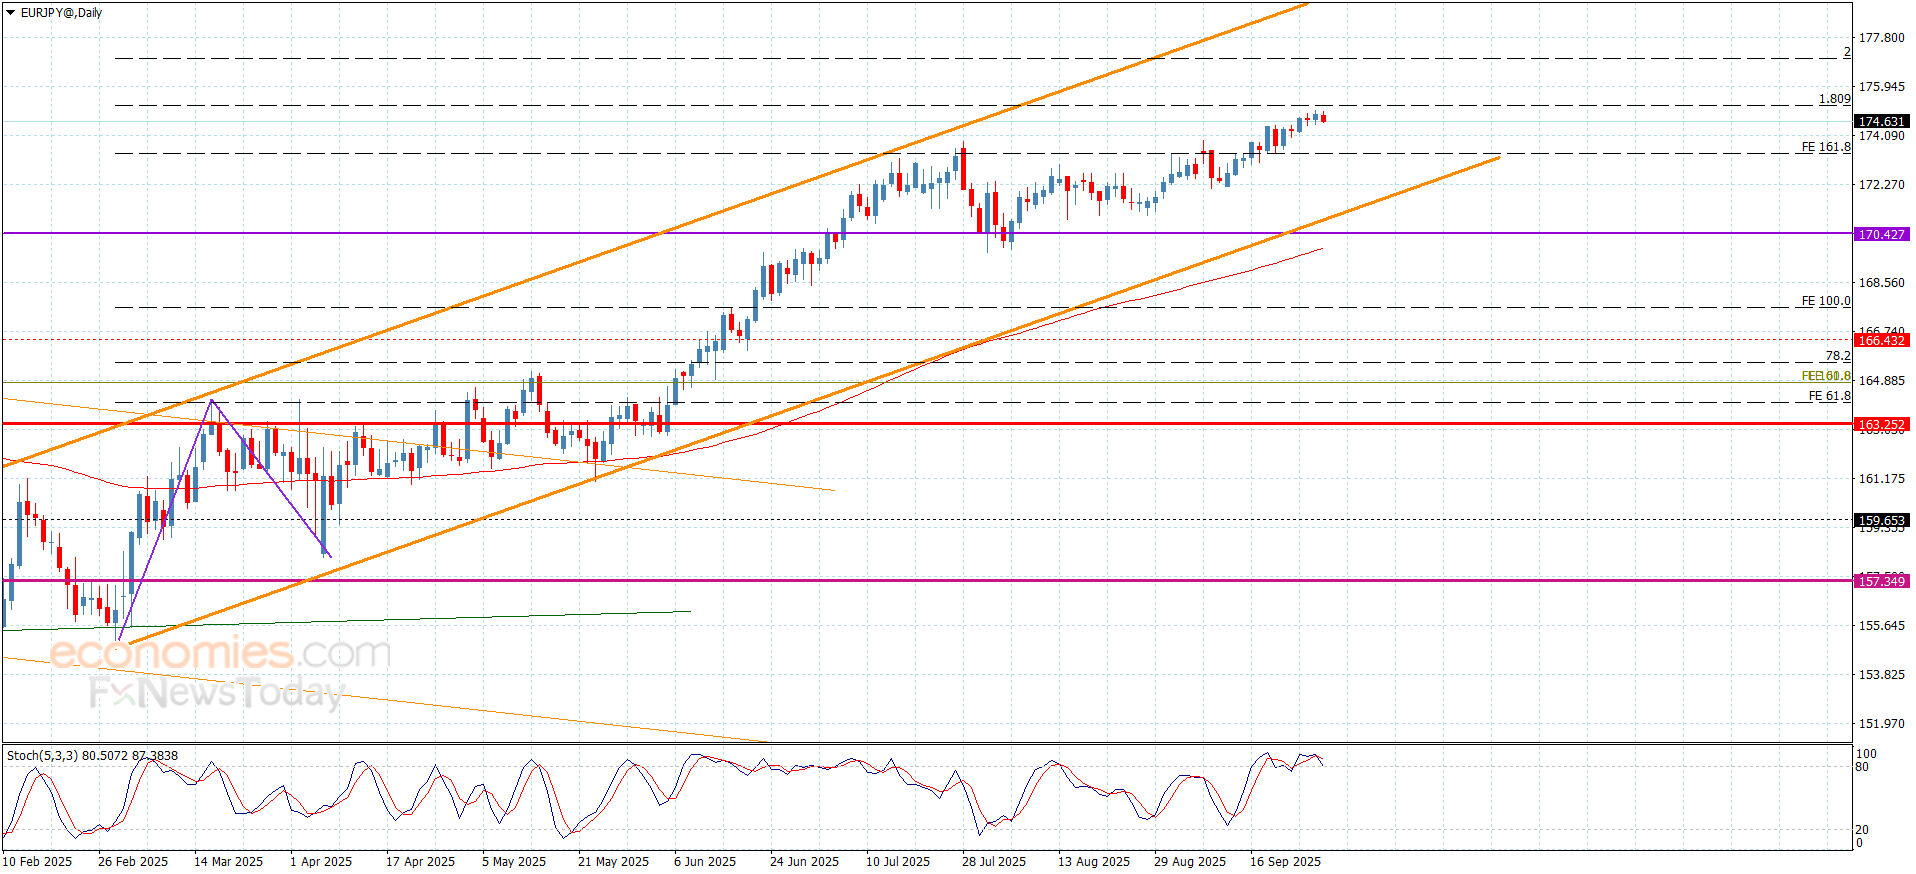
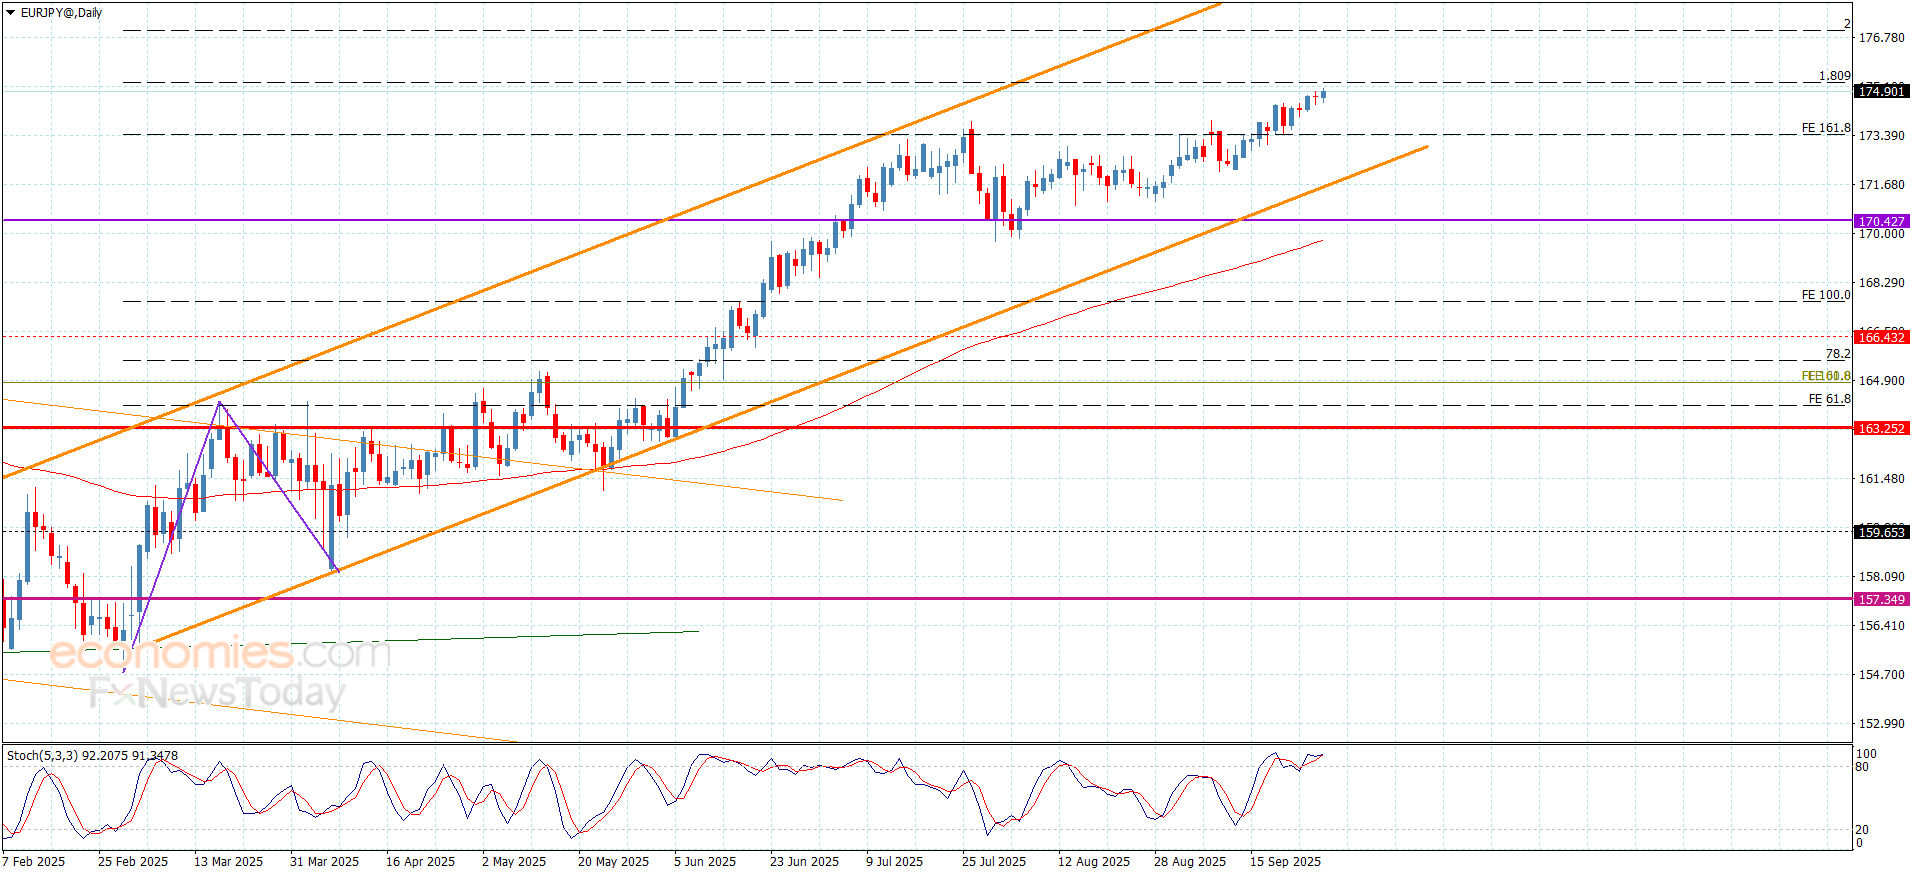
The EURJPY pair didn’t succeed in reaching the extra positive stations, affected by its neediness to the positive momentum, which forces it to settle below the barrier at 175.20, forming correctional waves by its stability near 174.65.
We expect providing mixed trading due to stochastic attempt to exit the overbought level, but it didn’t affect the main bullish trend, due to the stability of the trading within the bullish channel levels, by forming 173.45 level as an important extra support, therefore, we recommend waiting for breaching the barrier, to open the way for reaching extra positive stations, that are located near 176.00 reaching 176.95.
The expected trading range for today is between 174.20 and 175.20
The Euro-to-Dollar exchange rate slipped to three-week lows on Thursday, with EUR/USD testing support near 1.1650 after stronger-than-expected US data boosted the greenback.
Markets scaled back Fed cut bets, while analysts warned that a break of the 50-day moving average at 1.1660 could open the door to deeper losses.
ING, however, still sees scope for EUR/USD to rebound above 1.170 in the short term.
EUR/USD Forecasts: Slides to 3-Week Lows
The Euro to Dollar (EUR/USD) exchange rate was unable to make headway on Thursday and dipped to 3-week lows just below 1.1650 before a tentative recovery to 1.1680 on Friday.
The US data releases on Thursday were stronger than expected with no sign of an increase in layoffs which helped underpin the dollar.
There was a shift in market pricing with traders considering that the chances of two further Fed rate cuts by the end of 2025 had dipped towards 60%.
Save on Your EUR/USD Transfer
Get better rates and lower fees on your next international money transfer.
Compare TorFX with top UK banks in seconds and see how much you could save.
According to UoB; “While the decline is deeply oversold, there is no sign of stabilisation just yet. Today, as long as EUR holds below 1.1715, there is a chance for EUR to continue to decline. That said, the major support at 1.1610 is likely out of reach for now.”
SocGen considers that the dollar is around key support; “The pair is currently testing an ascending trend line established since August; the 50-day moving average near 1.1660 is a crucial support.”
It added; “Should it fail to defend the moving average near 1.1660, the down move may extend. In such a scenario, the next objectives could be located at the late August lows of 1.1600/1.1570 and 1.1500.”
ING is doubtful that the dollar can hold recent gains; “our baseline view is for the dollar to give back some gains, and we think a return above 1.170 can happen as early as today.”
It did note potential further Euro setbacks; “One risk, aside from any more US data strength, is that markets take rising geopolitical tension in Europe more seriously. NATO said yesterday that it is ready to shoot down any Russian planes violating its airspace.”
MUFG noted that the US data was stronger than expected; “It’s been some time since US data has surprised to the upside and driven both yields and the US dollar higher but the data yesterday and on Wednesday certainly did surprise to the upside and given positioning has been so skewed of late toward weakening economic data in the US we have seen a notable rebound for the dollar just when volatility is hitting new lows in FX and bonds.”
The bank expects that the labour market will be crucial for developments.
MUFG added; “If the labour market data was to prove better than expected next week, it would certainly undermine the primary argument put forward by Fed Chair Powell to cut rates further and force the Fed to give more weight to the upside inflation risks.”
Like this piece? Please share with your friends and colleagues:
International Money Transfer? Ask our resident FX expert a money transfer question or try John’s new, free, no-obligation personal service! ,where he helps every step of the way,
ensuring you get the best exchange rates on your currency requirements.
USD/JPY Correlation with Fed Policy Tightens as Pair Holds 149.00–150.00
The USD/JPY currency pair has remained glued to the trajectory of Federal Reserve rate expectations, with Fed funds futures correlations running at -0.94 through September 2026. That means every adjustment in rate cut bets translates almost directly into yen movement. After reclaiming the 200-day moving average and powering above 149.00 this past week, the pair is testing the critical 150.00 threshold, with resistance stacked at 151.00 and 152.40. A decisive break of 150.90, the July peak, would mark a full resumption of the uptrend from the August low at 139.87, with Fibonacci alignment at 151.22 signaling the next key marker.
Payrolls Data Looms as Make-or-Break Catalyst for USD/JPY
The September nonfarm payrolls report due Friday is the clear pivot point for USD/JPY price action. Recent economic surprises, including stronger U.S. personal income and spending, have tilted to the upside, but traders remain cautious about a downside shock. A strong payrolls print coupled with a firm unemployment rate would scale back cut expectations and fuel another surge through 151.00. Conversely, a weak reading would revive deeper cut pricing and likely drag the pair back to 148.80 support. Before payrolls, ADP jobs, JOLTs, ISM manufacturing, ISM services, and weekly claims all have the power to stir volatility, though none are likely to overshadow the official payroll data.
Japanese Fundamentals Take a Back Seat as Tokyo CPI Softens
While U.S. macro remains the driver, Japan’s domestic story continues to provide context. Tokyo CPI undershot expectations, hinting that inflationary pressure may be easing. That gives the Bank of Japan more room to watch data before pressing ahead with hikes, even as two policy board members dissented in favor of tightening at the last meeting. The release of the BoJ’s summary of opinions could add intrigue, but unless there is clear hawkish deviation, USD/JPY will stay locked to U.S. labor data and Treasury yields.
Technical Levels Signal Bulls in Control but Risks of Pullback Persist
Technically, USD/JPY’s reclaim of the 200DMA has reset the bullish outlook, but caution lingers given past failures above this level. RSI (14) remains in overbought territory, while MACD momentum continues to slope upward. Immediate support is reinforced at 149.00, followed by a cluster near 148.80. On the upside, a daily close beyond 150.90 would open 151.22 before setting the stage for 152.40. If buyers fail to sustain momentum, pullbacks could target 148.00 or deeper retracements toward 145.50, the September low.
Big Picture: USD/JPY Holds Medium-Term Uptrend Above 139.00
From a structural perspective, USD/JPY’s multi-year trend from the 2021 low at 102.58 remains intact. The correction from last year’s 161.94 high may have already bottomed at 139.87, with the breakout through 149.12 reinforcing that interpretation. As long as 139.00–139.20 holds, the bullish bias for a retest of 161.94 is preserved. A failure back below 139.00 would suggest the corrective wave is not yet complete, but that scenario looks less likely given current U.S. economic resilience.
The GBP/USD weekly forecast turns bearish after dipping to 7-week lows.
Upbeat US GDP and Jobless Claims, along with a cautious Fed, triggered a dollar recovery.
Markets now focus on labor market data due next week for a fresh impetus.
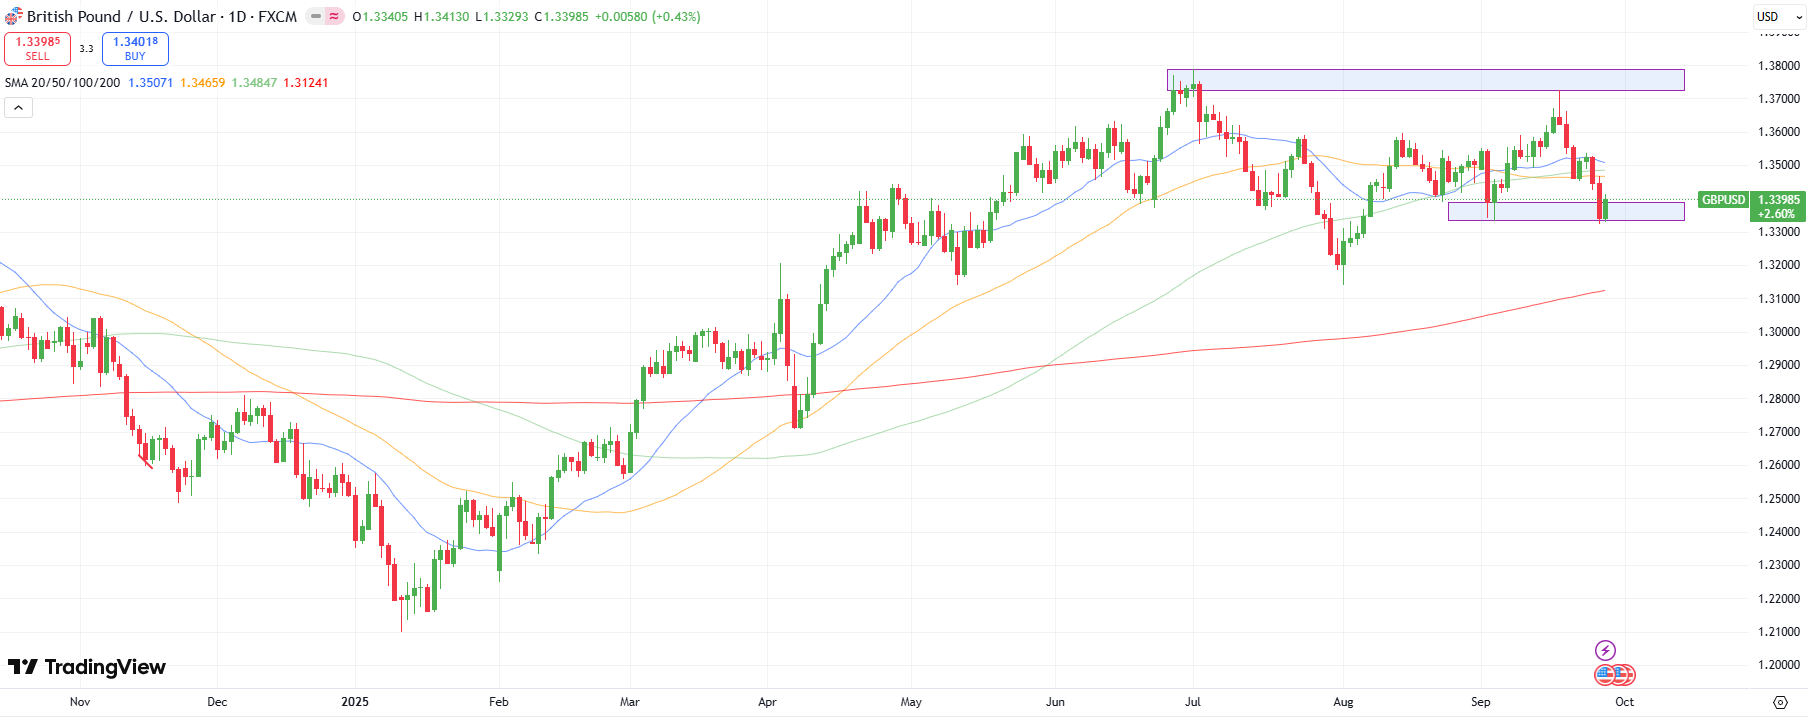
The GBP/USD weekly forecast has turned bearish after the price significantly declined last week, reaching 7-week lows near 1.3320. The move was attributed to a stronger dollar after a cautious Fed and upbeat data.
–Are you interested to learn more about ECN brokers? Check our detailed guide-
A broad US dollar resurgence followed stronger-than-expected US GDP growth, a recovery in durable goods orders, and a decline in jobless claims. This reinforced the view that the Federal Reserve may not deliver aggressive rate cuts this year. The Fed’s cautious tone was echoed by Fed Chair Powell and other policymakers, which further pushed the greenback up.
On the other hand, softer UK PMI data revealed slower growth momentum, further weighing on the demand for the pound. The Composite PMI fell to 51.0 in September from 53.5 in August, underscoring the fragility of the UK economy. Weaker gilt demand and political uncertainty also kept the sterling subdued.
The Friday’s Core PCE Inflation data came as expected at 2.9% y/y; the lack of upside surprise and a mildly better risk mode helped the GBP/USD stabilize into the weekend. However, the broader sentiment remains favorable for the US dollar as markets scale back bets for quicker Fed easing, while the Bank of England retains its cautious stance.
GBP/USD Key Events Next Week
GBP/USD weekly key events
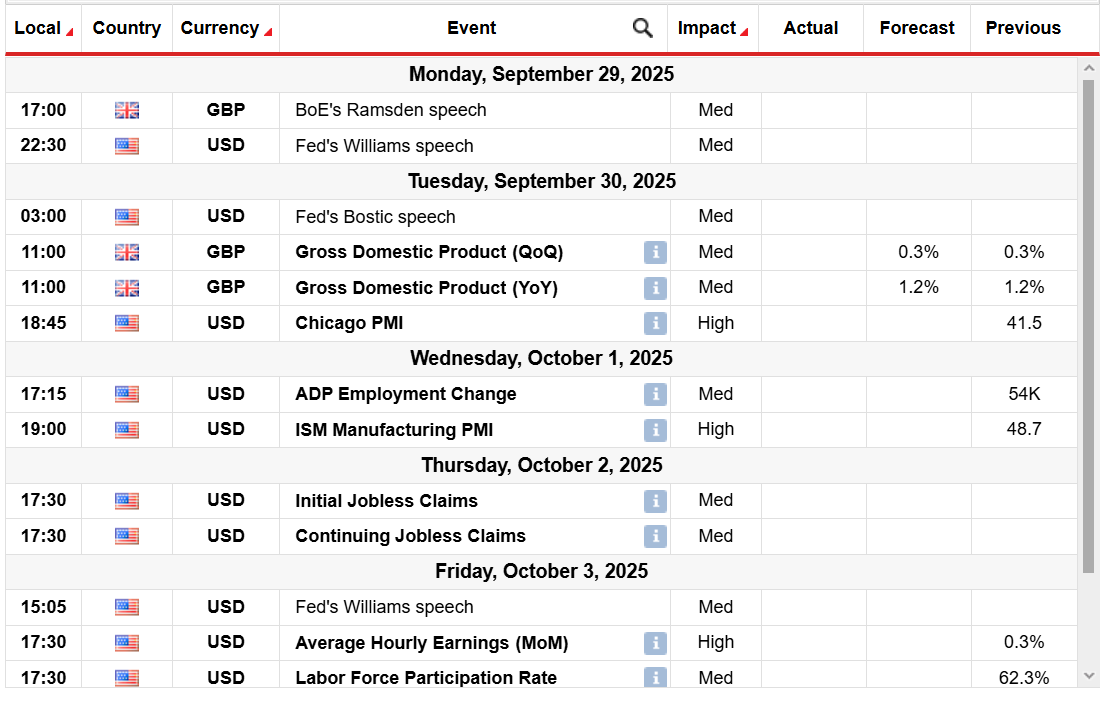
Moving to the last week of the month, the focus now shifts to the US labor market and the UK growth data, with the following significant events:
UK GDP (Tuesday)
JOLTs Job Opening (Tuesday)
ADP Employment Change (Wednesday)
US Non-Farm Payroll (Friday)
Another round of strong US data could further undermine the GBP/USD, while cooling labor market signs could dampen the dollar’s recovery. Traders will also monitor speeches by the Fed and BOE for fresh policy cues, along with tariff-related developments from the US.
GBP/USD Weekly Technical Forecast: Demand Zone Resisting Bears
GBP/USD daily chart
The daily chart for the GBP/USD reveals a neutral to bearish bias, as the downside meets solid support at 1.3340, with the price jumping to the 1.3400 mark while closing the week. However, the prices are lying well below the key moving averages, which could gather selling traction, pushing towards the 200-day MA at 1.3125. This needs a clear breakout of the demand zone.
–Are you interested to learn more about making money in forex? Check our detailed guide-
On the other hand, if the prices remain supported by the demand zone, the pound could further gain and test the MA confluence zone at 1.3480–1.3500. The markets are likely to consolidate, awaiting fresh impetus.
Looking to trade forex now? Invest at eToro!
67% of retail investor accounts lose money when trading CFDs with this provider. You should consider whether you can afford to take the high risk of losing your money.
USD/JPY Pushes Toward 150.00 as Fed Easing Bets Unwind
USD/JPY surged into Friday’s European session, trading as high as ¥149.96 before easing to ¥149.52 by 17:00 GMT, marking a weekly gain of 1.3%. The move was powered by a sharp reduction in expectations for aggressive Federal Reserve rate cuts after a combination of stronger-than-expected U.S. macroeconomic releases. Second-quarter GDP was revised up to 3.8% from 3.2%, while weekly jobless claims fell to 218,000, the lowest since July, countering fears of a softening labor market. The dollar index simultaneously climbed to 97.85 before easing back to 97.50, underlining broad greenback strength that lifted USD/JPY from its early-September lows of 146.90.
Tokyo CPI Miss Adds Pressure on the Yen
The Japanese yen’s weakness was exacerbated by softer-than-expected inflation data in Tokyo, where September headline CPI slowed to 2.5% year-on-year from 2.6% in August. The core measure held at 2.5% rather than accelerating to 2.6% as economists had forecast. Markets immediately trimmed the probability of an October Bank of Japan rate hike from 50% to just 35%. The moderation in Japan’s inflation gives policymakers at the BoJ further cover to maintain ultra-accommodative policy, reinforcing the divergence between U.S. and Japanese yields. The move has pushed the yen to its weakest level in eight weeks, with USD/JPY now retesting levels last seen on August 1, when the pair briefly reached 150.00.
Fed Cut Repricing Tightens Link Between Rates and USD/JPY
Correlation studies show USD/JPY tracking short-end U.S. yields and Fed funds futures with a coefficient near -0.94 over the past two weeks, a near-lockstep relationship. Futures markets now discount fewer than 50 basis points of additional easing in 2025, compared to nearly 100 basis points just a month earlier. This repricing, tied closely to resilient consumer spending and income growth in the U.S., has made USD/JPY extremely sensitive to U.S. data surprises. Traders note that while the Fed’s preferred inflation measure—the PCE deflator—rarely shocks, today’s release of spending and income details could prove more consequential for expectations and price action in USD/JPY.
Technical Levels: Resistance at 151.00, Support Near 149.00
USD/JPY’s technical picture has turned decisively bullish. The pair has broken above its 200-day moving average for the first time since June, now holding support near the ¥149.00 level. Momentum gauges confirm the strength of the move: the 14-day RSI is trending higher, and MACD remains firmly in positive territory. Bulls are eyeing resistance at ¥151.00, the October 2022 swing high, and further at ¥152.40, a level tested in late 2023. On the downside, any slip below ¥149.00 could expose the 20-day moving average near ¥148.25, while deeper pullbacks might target ¥147.50 where demand has previously emerged. Still, with Japan’s inflation losing steam and U.S. data consistently surprising to the upside, the bias remains skewed to the upside for now.
Market Sentiment and Trading Flows
Institutional accounts in Tokyo and New York have been adding to long USD/JPY positions on the break above 149.00, according to traders familiar with the flows. Options markets have shown heavy demand for 150.00 strike calls expiring next week, indicating positioning for a breakout. Meanwhile, volatility remains subdued, with one-month implied vol hovering at 9.2%, well below levels seen during past interventions by Japanese authorities. This signals that while risk of official action exists if USD/JPY sustains above 150.00, the market is not yet pricing imminent intervention.
Verdict: Bullish Bias with Near-Term Caution
Given the dovish backdrop in Tokyo, the resilience of U.S. growth, and the repricing of Fed cuts, USD/JPY remains tilted toward further upside. Support at ¥149.00 is critical, and as long as the pair holds above it, the path toward ¥151.00 appears open. Short-term traders should remain alert around today’s U.S. PCE data and subsequent Fed speakers, but the balance of risks suggests dips are likely to be bought. The current structure supports a Buy rating on USD/JPY with targets at ¥151.00 and ¥152.40, while acknowledging the risk of verbal or direct intervention should yen weakness accelerate beyond policymakers’ comfort zone.
GBP/USD Slides to Seven-Week Low as U.S. Data Outpaces U.K. Recovery
The GBP/USD pair has come under sustained selling pressure, dropping to 1.3322 this week, its weakest point in nearly two months, before stabilizing just above 1.3350. The move reflects a sharp 3% decline from the September high at 1.3725 as U.S. economic strength has undercut the case for aggressive Federal Reserve rate cuts, while the Bank of England remains caught between sticky inflation and weakening domestic growth.
Impact of U.S. Growth and Inflation Data on GBP/USD
The second-quarter U.S. GDP revision to 3.8% year-on-year, coupled with weekly jobless claims falling to 218,000 and durable goods orders surging 2.9%, has provided the dollar with renewed momentum. These numbers highlight U.S. economic resilience and have reduced expectations for back-to-back Fed cuts in 2025. Meanwhile, markets await the Core PCE inflation print at 2.9% year-on-year, a figure that could cement the Fed’s cautious stance and extend downside pressure on GBP/USD if it overshoots consensus.
Bank of England Uncertainty Weighs on Sterling
Governor Andrew Bailey has acknowledged that U.K. inflation is on a downward path but linked future easing directly to progress in consumer prices. This hesitancy is complicated by other MPC members, such as Megan Greene, warning against premature cuts amid lingering upside risks. Political noise in London—calls for re-nationalization of utilities and large-scale borrowing schemes—has rattled gilt markets already strained by fragile demand. With households sitting on unusually high savings and labor conditions softening, the pound has struggled to find a solid base against the dollar.
Technical Breakdown of GBP/USD Levels
Technically, GBP/USD’s inability to reclaim 1.3390, the 23.6% Fibonacci retracement of the January–July rally, leaves bears in control. A sustained break under 1.3330 risks a slide toward 1.3255, followed by deeper targets at 1.3145 and the 200-day SMA near 1.3130. On the flip side, only a decisive recovery above 1.3470–1.3500, where the 20- and 50-day SMAs converge, would ease bearish momentum and allow a rebound toward 1.3600. Until then, the bias remains skewed to the downside with 1.3300–1.3260 acting as the next key pivot zone.
Short-Term Pound Sterling Outlook Against the Dollar
The stochastic oscillator sitting below 20 suggests the pair is oversold, and price action beneath the lower Bollinger band signals the potential for a short-lived bounce. However, with market structure deteriorating since August’s 1.3139 low and with GBP/USD still capped under the broader 1.3675–1.3720 resistance band, upside moves should be treated as corrective rallies rather than a trend reversal. A failure to sustain above 1.3400 in the coming sessions would quickly put 1.3260 back on the radar.
Final Assessment: Bearish Bias Maintained on GBP/USD
Considering the stronger U.S. macro backdrop, upcoming PCE inflation data, and the Bank of England’s indecisive tone, GBP/USD remains in a bearish setup with high probability of retesting 1.3255–1.3150 in the short term. The pair is oversold enough for tactical rebounds, but with momentum firmly on the dollar’s side, rallies are likely to be capped. Based on current dynamics, the stance remains Sell on GBP/USD, with downside risks dominating until there is evidence of U.S. data softening or the BoE signaling a firmer stance against inflation.
The forex market is more attractive after the September 17th FOMC, but the devil is in the details.
In Today’s forex forecast, I’m sharing trade setups on the DXY, EURUSD, GBPUSD, USDJPY, NZDUSD, and XAUUSD.
Remember to scroll down after watching the video for additional comments and annotated charts.
US Dollar Index (DXY) Forecast
The DXY followed through on last week’s aggressive bounce from 96.60. That’s the bottom of a 2011 ascending channel I’ve discussed for months.
The September 17th FOMC meeting gave dollar bulls what they needed to defend the 96.60 level. It was a critical moment for the DXY, given the significance of this channel since 2011.
As long as the USD is above that mark on the high time frames, I’ll remain bullish.
Last week, the price managed to push above 97.70, a key benchmark for the price action in October. The level shifts to new support, especially with last week’s close above it.
However, dollar bulls face a critical test next week between 98.60 and 99.00. The 98.60 level has been crucial for the DXY since June, and 99.00 is channel resistance from May.
Some ranging for the DXY between 98.60 and 97.70 seems likely for early next week. Buyers may need to digest last week’s aggressive rally.
If bulls can clear the 99.00 resistance area, resistance levels like 99.35 and the 99.88 imbalance come into play.
Alternatively, a sustained break back below 97.70 would flip the DXY bearish.
I’ll remain bullish on the dollar, given the combination of last week’s close above 97.70 and the 2011 support that held strong in September.
Join us in the VIP Discord group for real-time market updates, VIP-only videos, my trades in real time, and the complete trading course.
Weekly Forex Forecast For DXY, EURUSD, GBPUSD, USDJPY, NZDUSD, and XAUUSD (September 29-October 3, 2025) 7
EURUSD Forecast
EURUSD played out nicely for us last week following Wednesday’s breakdown.
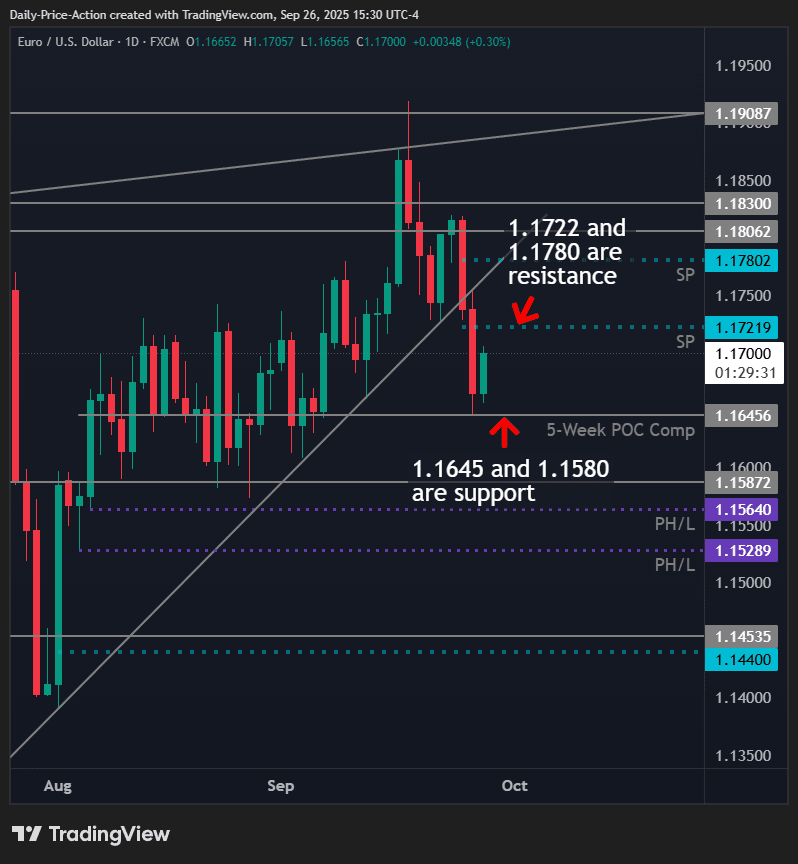
I discussed this in Wednesday’s video, noting that a sustained break below the February trend line would be bearish. It also had the potential to open up lower levels.
Sure enough, Wednesday’s session closed below, and the EURUSD hit resistance on Thursday right at the February trend line.
I also discussed in the VIP Discord group how 1.1645 could serve as support for the euro. That’s a 5-week composite point of control for EURUSD.
In other words, it’s where the EURUSD spent the most time in August and early September. Markets have memories, so areas like these often serve as support or resistance.
So far, euro bulls are defending 1.1645 to the pip. However, I’m not convinced that this bounce will be anything more than a relief rally.
There are two buy-side single prints (imbalances) at 1.1722 and 1.1780. Market makers may target these areas next week, but any retest is likely to be a selling opportunity.
Anticipate more ranging from EURUSD next week. Trading what’s on the chart (trading the range) will always be more profitable than trading what you want to happen.
Lastly, remember we have a poor low (unfinished auction) at 1.15643 and a single print at 1.1440. These could also be targeted, but only if the EURUSD drops below 1.1645 on the high time frames.
Weekly Forex Forecast For DXY, EURUSD, GBPUSD, USDJPY, NZDUSD, and XAUUSD (September 29-October 3, 2025) 8
GBPUSD Forecast
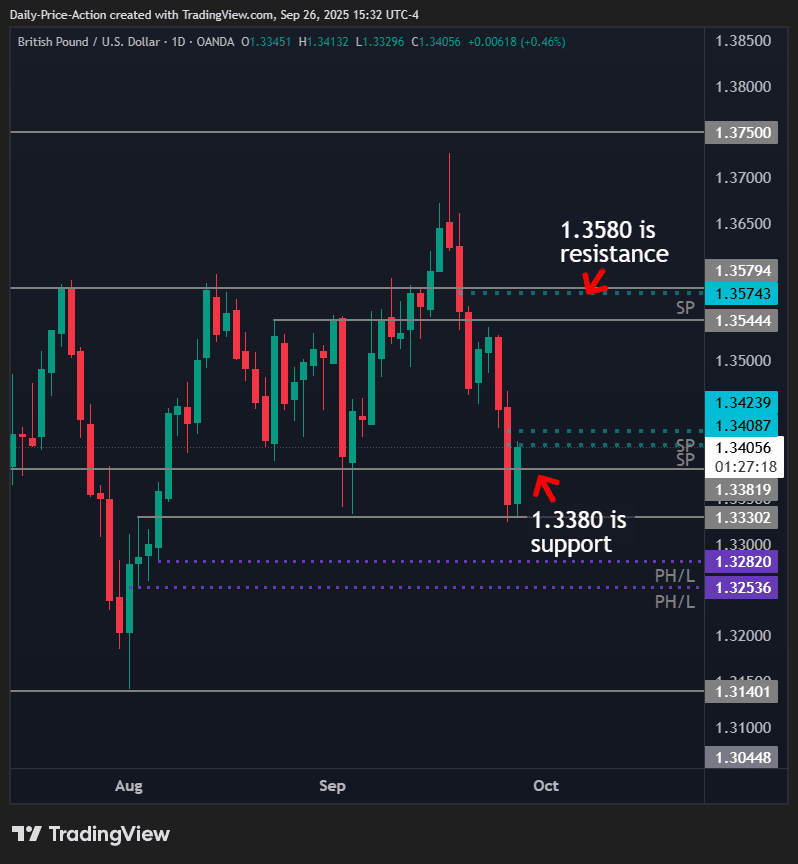
GBPUSD is another pair that worked out nicely last week. In the previous Weekly Forex Forecast, I mentioned how the break below 1.3580 looked bearish for the pound.
I also discussed how the 1.3529 single print could offer a short opportunity.
Last Tuesday’s session offered the ideal short entry with a high of 1.3537. That retest triggered a fresh wave of sellers, pushing GBPUSD into the 1.3330 support area.
For now, GBPUSD bulls are defending the September low at 1.3330. But like EURUSD, I’m not convinced that this bounce will be anything more than some relief.
Looking at the market profile for the pound, we have two buy-side single prints that could become a factor next week. The first is 1.3410, and the second is 1.3425.
These levels could serve as “magnets” early next week. Unless, of course, we see the pair tag these levels on Friday, since I’m writing this with several hours left in Friday’s session.
Either way, I expect sellers to defend the 1.3425 region if tested early next week.
Looking lower, we have a couple of poor lows. The first is 1.3282 and the second is 1.3254. Whether these become targets depends on whether GBPUSD sellers can break 1.3330 support next week.
If bulls reclaim 1.3380 on Friday, watch for some relief early next week.
Weekly Forex Forecast For DXY, EURUSD, GBPUSD, USDJPY, NZDUSD, and XAUUSD (September 29-October 3, 2025) 9
USDJPY Forecast
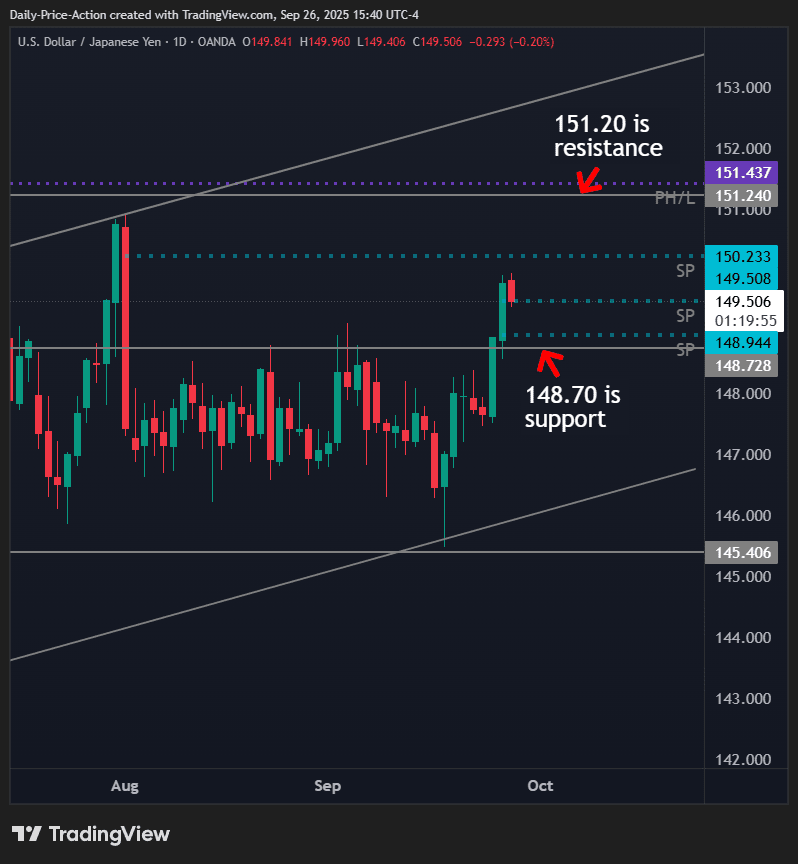
USDJPY broke out last week after nearly two months of sideways chop. I discussed the breakout and a potential trade plan in Thursday’s USDJPY video.
In that video, I mentioned the single prints that could become a factor. USDJPY tagged the 149.51 single print on Friday, but the 148.94 print remains open for business next week.
These levels could serve as key support for USDJPY if we get a pullback next week.
The challenge for bulls is where the DXY is trading. Last week’s retest of 98.60 was a significant moment for the dollar, which is also attracting sellers.
If USDJPY can hold above 148.70, a push higher into 150.23 and potentially 151.20 could be in the cards.
On the other hand, a break below 148.70 would cast a bearish shadow over USDJPY and expose the 147.00 level.
Weekly Forex Forecast For DXY, EURUSD, GBPUSD, USDJPY, NZDUSD, and XAUUSD (September 29-October 3, 2025) 10
NZDUSD Forecast
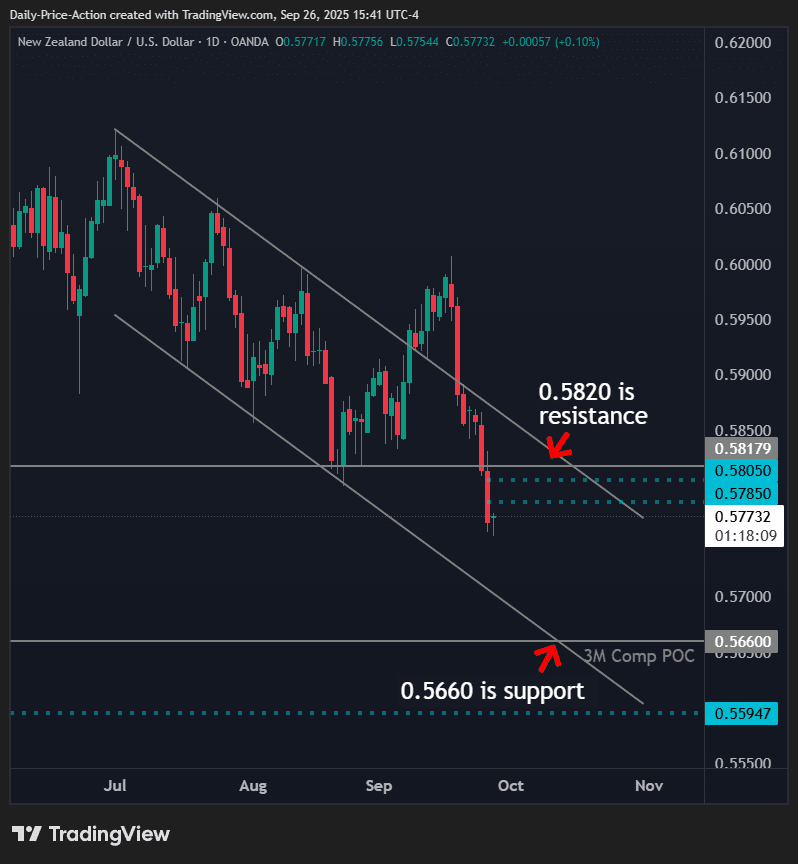
A few weeks ago, I included NZDUSD in the forecast, noting that the failure at 0.5890 looked bearish. It confirmed the failed breakout, exposing support at 0.5817 and lower.
Fast forward to today, and NZDUSD has accomplished both of those things.
The pair sold off from the 0.5890 region following the September 18th bearish close, and also broke below 0.5817 support last week.
That keeps sellers in control for next week.
However, like many of the major currency pairs, the New Zealand dollar left several imbalances for next week.
The first single print (imbalance) is 0.5785, and the second is 0.5805. I expect market makers to target 0.5785 early next week; however, targeting 0.5805 will be more challenging.
Either way, I like the idea of looking for shorts next week as long as NZDUSD is below 0.5820. Those two imbalances at 0.5785 and 0.5805 could provide another opportunity to go short.
As for downside targets, we have the bottom of the July descending channel. It’s difficult to say where the level comes in, but my bet is on 0.5660.
There’s a 3-month composite point of control from early 2025 sitting at 0.5660. That’s a fancy way of saying NZDUSD spent a lot of time at 0.5660 in Q1, and markets don’t forget.
Weekly Forex Forecast For DXY, EURUSD, GBPUSD, USDJPY, NZDUSD, and XAUUSD (September 29-October 3, 2025) 11
XAUUSD (Gold) Forecast
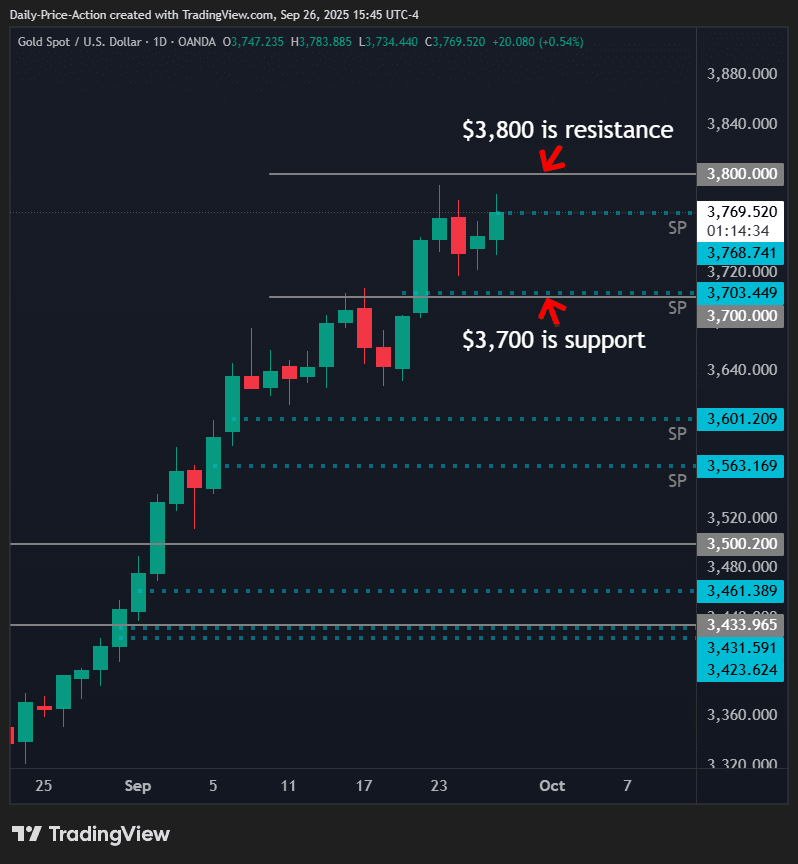
Gold continued its rally last week following the break above $3,700. Pullbacks continue to be shallow with upside seemingly unlimited.
However, XAUUSD is nearing the top of a weekly channel from 2024. I’ve discussed this pattern several times, and the upper boundary currently sits just above $3,800.
It’s not a reason to be bearish by any means. But it is reason enough to approach fresh longs with caution.
Gold has also left several sell-side imbalances in its way. The closest sits at $3,703.
If we get a deeper pullback from XAUUSD in the coming days, $3,703 could become a target.
However, shorting gold remains a losing battle. Even a pullback from $3,800 (if we get it) would likely offer a buying opportunity rather than justification to get short.
Join us in the VIP Discord group for real-time market updates, VIP-only videos, my trades in real time, and the complete trading course.
Weekly Forex Forecast For DXY, EURUSD, GBPUSD, USDJPY, NZDUSD, and XAUUSD (September 29-October 3, 2025) 12
EUR/USD corrects higher following a sharp two-day decline.
The near-term technical outlook doesn’t offer any hints of a reversal.
The US economic calendar will feature PCE inflation data for August.
EUR/USD continued to push lower following Wednesday’s decline and closed deep in negative territory on Thursday. The pair stays relatively quiet in the European session on Friday, while the technical outlook suggests that the bearish bias remains intact.
Euro Price Today
The table below shows the percentage change of Euro (EUR) against listed major currencies today. Euro was the weakest against the US Dollar.
USD
EUR
GBP
JPY
CAD
AUD
NZD
CHF
USD
-0.03%
-0.01%
-0.04%
0.09%
0.08%
0.17%
0.03%
EUR
0.03%
0.05%
0.05%
0.17%
0.17%
0.27%
0.08%
GBP
0.01%
-0.05%
0.08%
0.13%
0.21%
0.21%
0.00%
JPY
0.04%
-0.05%
-0.08%
0.10%
0.09%
0.18%
-0.08%
CAD
-0.09%
-0.17%
-0.13%
-0.10%
-0.01%
0.11%
-0.13%
AUD
-0.08%
-0.17%
-0.21%
-0.09%
0.01%
0.09%
-0.13%
NZD
-0.17%
-0.27%
-0.21%
-0.18%
-0.11%
-0.09%
-0.10%
CHF
-0.03%
-0.08%
0.00%
0.08%
0.13%
0.13%
0.10%
The heat map shows percentage changes of major currencies against each other. The base currency is picked from the left column, while the quote currency is picked from the top row. For example, if you pick the Euro from the left column and move along the horizontal line to the US Dollar, the percentage change displayed in the box will represent EUR (base)/USD (quote).
The US Dollar (USD) gathered strength against its rivals on Thursday as upbeat macroeconomic data releases eased concerns over an economic downturn.
The US Bureau of Economic Analysis (BEA) announced that it revised the annualized Gross Domestic (GDP) growth for the second quarter to 3.8% from 3.3% in the previous estimate. Other data from the US showed that Durable Goods Orders increased by 2.9% in August, surpassing the market expectation for a decrease of 0.5% by a wide margin, and the weekly Initial Jobless Claims declined to 218,000 from 232,000 in the previous week.
Later in the day, the BEA will publish the Personal Consumption Expenditures (PCE) Price Index data, the Federal Reserve’s (Fed) preferred gauge of inflation, for August. Fed Chairman Jerome Powell said in his last public appearance that they were projecting the PCE Price Index and the core PCE Price Index to rise 2.7% and 2.9% on a yearly basis, respectively.
Unless there is a significant surprise in the monthly core PCE Price Index print, which is expected to rise 0.2%, the market reaction is likely to remain muted.
In the meantime, US stock index futures rise about 0.2% in the European morning on Friday. A bullish action in Wall Street could help EUR/USD hold its ground heading into the weekend.
EUR/USD Technical Analysis
EUR/USD broke below the lower limit of the ascending regression channel and the Relative Strength Index (RSI) indicator on the 4-hour chart dropped toward 30, reflecting a buildup of bearish momentum. Additionally, EUR/USD closed the last four 4-hour candles below the 200-period Simple Moving Average (SMA).
On the downside, 1.1640 (Fibonacci 50% retracement of the latest uptrend) aligns as the first support level before 1.1580 (Fibonacci 61.8% retracement) and 1.1500 (static level, round level). Looking north, resistance levels could be spotted at 1.1690-1.1700 (200-period SMA, Fibonacci 38.2% retracement), 1.1750 (100-period SMA) and 1.1770 (Fibonacci 23.6% retracement).
(This story was corrected on September 26 at 08:38 GMT to say in the first paragraph that the EUR/USD closed deep in negative territory on Thursday, not positive.)
Euro FAQs
The Euro is the currency for the 19 European Union countries that belong to the Eurozone. It is the second most heavily traded currency in the world behind the US Dollar. In 2022, it accounted for 31% of all foreign exchange transactions, with an average daily turnover of over $2.2 trillion a day.
EUR/USD is the most heavily traded currency pair in the world, accounting for an estimated 30% off all transactions, followed by EUR/JPY (4%), EUR/GBP (3%) and EUR/AUD (2%).
The European Central Bank (ECB) in Frankfurt, Germany, is the reserve bank for the Eurozone. The ECB sets interest rates and manages monetary policy.
The ECB’s primary mandate is to maintain price stability, which means either controlling inflation or stimulating growth. Its primary tool is the raising or lowering of interest rates. Relatively high interest rates – or the expectation of higher rates – will usually benefit the Euro and vice versa.
The ECB Governing Council makes monetary policy decisions at meetings held eight times a year. Decisions are made by heads of the Eurozone national banks and six permanent members, including the President of the ECB, Christine Lagarde.
Eurozone inflation data, measured by the Harmonized Index of Consumer Prices (HICP), is an important econometric for the Euro. If inflation rises more than expected, especially if above the ECB’s 2% target, it obliges the ECB to raise interest rates to bring it back under control.
Relatively high interest rates compared to its counterparts will usually benefit the Euro, as it makes the region more attractive as a place for global investors to park their money.
Data releases gauge the health of the economy and can impact on the Euro. Indicators such as GDP, Manufacturing and Services PMIs, employment, and consumer sentiment surveys can all influence the direction of the single currency.
A strong economy is good for the Euro. Not only does it attract more foreign investment but it may encourage the ECB to put up interest rates, which will directly strengthen the Euro. Otherwise, if economic data is weak, the Euro is likely to fall.
Economic data for the four largest economies in the euro area (Germany, France, Italy and Spain) are especially significant, as they account for 75% of the Eurozone’s economy.
Another significant data release for the Euro is the Trade Balance. This indicator measures the difference between what a country earns from its exports and what it spends on imports over a given period.
If a country produces highly sought after exports then its currency will gain in value purely from the extra demand created from foreign buyers seeking to purchase these goods. Therefore, a positive net Trade Balance strengthens a currency and vice versa for a negative balance.
The Pound bounced up on Yen weakness, but is struggling to find acceptance above 200.00.
Moderate Tokyo inflation levels have dampened hopes of BoJ tightening in October.
GBP/JPY: key resistance lies ahead of 200.50, support is at the 199.20 area.
The British Pound is trimming Thursday’s losses on Friday, favoured by generalised Japanese Yen weakness, following relatively soft inflation figures in the Tokyo area. The pair has reached prices above the 200.00 level after bouncing at 199.55, but remains below a key resistance area ahead of 200.50
Data released on Thursday revealed that the advanced Tokyo CPI grew at a 2.5% yearly rate in September, down from 2.6% in August. The Core CPI remained steady at 2.5% against market expectations of an uptick to 2.6%. These figures give some more leeway to the BoJ to maintain its “wait-and-see” stance at its next monetary policy meeting, and have increased bearish pressure on the Yen.
Technical analysis: Looking for direction around 200.00
The technical picture is mixed. The pair broke below an ascending trendline support, yet bears have been unable to pull the pair below 199.20. The 4-hour Relative Strength Index is wavering around the 50 level, indicating a lack of a clear bias.
Bulls will find significant resistance in the area between Thursday’s high, at 200.35, and the reverse trendline, now around 200.50. A confirmation above here would open the way towards the year-to-date high, at 201.27.
A reversal from current levels, on the contrary, would face support at the mentioned 199.20 (September 19 and 23 lows). Further down, the 78.6% retracement of the September rally, which meets the September 5 low at 198.65, and the September 2 low at 198.35, would be the next bearish targets.
(This story was corrected on September 26 at 10:10 GMT to say that the September 5 low is at 198.65 and the September 2 at 198.35, not at 168.65 and 1.1830 as previously reported.)
Japanese Yen Price Today
The table below shows the percentage change of Japanese Yen (JPY) against listed major currencies today. Japanese Yen was the strongest against the New Zealand Dollar.
USD
EUR
GBP
JPY
CAD
AUD
NZD
CHF
USD
-0.12%
-0.11%
-0.12%
0.07%
0.00%
0.07%
-0.06%
EUR
0.12%
0.05%
0.07%
0.24%
0.20%
0.25%
0.08%
GBP
0.11%
-0.05%
0.08%
0.19%
0.23%
0.20%
-0.00%
JPY
0.12%
-0.07%
-0.08%
0.15%
0.09%
0.16%
-0.09%
CAD
-0.07%
-0.24%
-0.19%
-0.15%
-0.06%
0.03%
-0.19%
AUD
-0.01%
-0.20%
-0.23%
-0.09%
0.06%
0.05%
-0.15%
NZD
-0.07%
-0.25%
-0.20%
-0.16%
-0.03%
-0.05%
-0.09%
CHF
0.06%
-0.08%
0.00%
0.09%
0.19%
0.15%
0.09%
The heat map shows percentage changes of major currencies against each other. The base currency is picked from the left column, while the quote currency is picked from the top row. For example, if you pick the Japanese Yen from the left column and move along the horizontal line to the US Dollar, the percentage change displayed in the box will represent JPY (base)/USD (quote).
The EURJPY pair failed to resume the bullish attack, due to its stability below %1.809 Fibonacci extension level, forming an extra barrier at 175.20, providing sideways trading since yesterday by its stability near 174.85.
Reminding you that the bullish scenario will remain valid, due to the stability within the bullish channel’s levels besides the continuation of forming an initial support at 173.40 level, which makes us wait for breaching the current barrier to ease the mission of recording extra gains that might begin at 176.00 and 176.95.
The expected trading range for today is between 174.20 and 175.20
Trend forecast: Sideways until achieving the breach