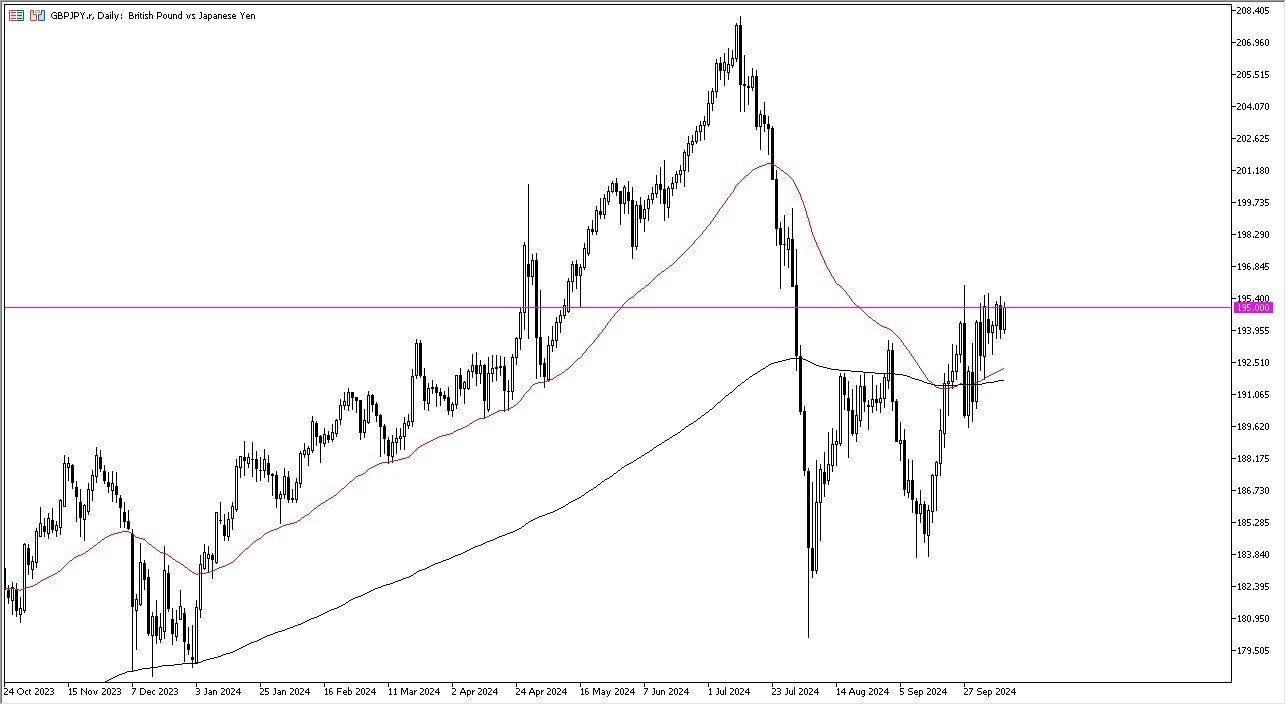
The British pound has rallied a bit against the Japanese yen during the trading session on Friday as we continue to threaten the 195 yen level, an area that’s been important a couple of times in the past.
So, I think ultimately, we need to see whether or not this pair can actually stick above the 195 yen level to get overly bullish in the short term.
It looks like every time we dip a bit, buyers are willing to step in and pick up a little bit of value as it appears.
But really at this point in time, I think it is a little bit difficult to get overly aggressive at least until we clear this hurdle. That being said, if we do break above that hurdle, I think a lot of people will be paying close attention to this pair. I also believe it would have more to do with the Japanese yen than anything else as you would more likely than not see other yen related pairs skyrocketing.
On that breakout
If and when we do, then the market could very well run up to the 198 yen level, an area that has been important previously. With all of that being said, I think we have a situation where traders continue to see the potential for the carry trade to come back. This is especially true now that the Bank of Japan has finally come out recently and just admitted that, hey, there’s nothing we can do here as far as tightening monetary policy is concerned. So, with that being said, I think you have a situation where you’re buying dips and if we can finally get that move above 195 with a clean break to the upside, you start to chase that as well. I have no interest whatsoever in shorting this pair. The interest rate differential will continue to keep me long of this market going forward as I get paid at the end of every day.
GBP/USD continues to move sideways below 1.3100 on Monday.
UK data on Tuesday and Wednesday could influence Pound Sterling’s performance.
The near-term technical picture fails to provide a directional clue.
Following the bearish action seen in the first half of the previous week, GBP/USD went into a consolidation phase. After closing virtually unchanged on Thursday and Friday, the pair continues to move sideways below 1.3100 to begin the new week.
British Pound PRICE Last 7 days
The table below shows the percentage change of British Pound (GBP) against listed major currencies last 7 days. British Pound was the weakest against the US Dollar.
USD
EUR
GBP
JPY
CAD
AUD
NZD
CHF
USD
0.39%
0.43%
0.46%
1.59%
0.97%
1.19%
0.12%
EUR
-0.39%
0.10%
0.11%
1.23%
0.55%
0.79%
-0.30%
GBP
-0.43%
-0.10%
-0.04%
1.14%
0.45%
0.72%
-0.28%
JPY
-0.46%
-0.11%
0.04%
1.11%
0.47%
0.65%
-0.32%
CAD
-1.59%
-1.23%
-1.14%
-1.11%
-0.59%
-0.40%
-1.45%
AUD
-0.97%
-0.55%
-0.45%
-0.47%
0.59%
0.29%
-0.80%
NZD
-1.19%
-0.79%
-0.72%
-0.65%
0.40%
-0.29%
-1.03%
CHF
-0.12%
0.30%
0.28%
0.32%
1.45%
0.80%
1.03%
The heat map shows percentage changes of major currencies against each other. The base currency is picked from the left column, while the quote currency is picked from the top row. For example, if you pick the British Pound from the left column and move along the horizontal line to the US Dollar, the percentage change displayed in the box will represent GBP (base)/USD (quote).
Upbeat macroeconomic data releases from the UK helped Pound Sterling stay resilient against its rivals on Friday. The cautious market mood, however, made it difficult for GBP/USD to gather bullish momentum heading into the weekend. Meanwhile, the data from the US showed that the Producer Price Index (PPI) for final demand rose 1.8% on a yearly basis in September, coming in above the market expectation of 1.6% and supporting the USD.
Bond markets in the US will remain closed in observance of the Columbus Day holiday on Monday. As a result, thin trading conditions could limit GBP/USD’s volatility during the American trading hours on Monday.
On Tuesday, the UK’s Office for National Statistics will release labor market data, which will include wage inflation readings. On Wednesday, the UK Consumer Price Index (CPI) figures for September will be scrutinized by market participants.
GBP/USD Technical Analysis
GBP/USD needs to break out of the 1.3000-1.3100 trading range to gather directional momentum.
In case GBP/USD rises above 1.3100 (Fibonacci 78.6% retracement level of the latest uptrend) and starts using this level as support, 1.3170 (Fibonacci 61.8% retracement) and 1.3200 (200-period Simple Moving Average (SMA), round level) could be seen as next resistance levels.
On the downside, an extended slide toward 1.2940 (static level) could be seen if 1.3000 (round level, static level) support fails.
Pound Sterling FAQs
The Pound Sterling (GBP) is the oldest currency in the world (886 AD) and the official currency of the United Kingdom. It is the fourth most traded unit for foreign exchange (FX) in the world, accounting for 12% of all transactions, averaging $630 billion a day, according to 2022 data. Its key trading pairs are GBP/USD, also known as ‘Cable’, which accounts for 11% of FX, GBP/JPY, or the ‘Dragon’ as it is known by traders (3%), and EUR/GBP (2%). The Pound Sterling is issued by the Bank of England (BoE).
The single most important factor influencing the value of the Pound Sterling is monetary policy decided by the Bank of England. The BoE bases its decisions on whether it has achieved its primary goal of “price stability” – a steady inflation rate of around 2%. Its primary tool for achieving this is the adjustment of interest rates. When inflation is too high, the BoE will try to rein it in by raising interest rates, making it more expensive for people and businesses to access credit. This is generally positive for GBP, as higher interest rates make the UK a more attractive place for global investors to park their money. When inflation falls too low it is a sign economic growth is slowing. In this scenario, the BoE will consider lowering interest rates to cheapen credit so businesses will borrow more to invest in growth-generating projects.
Data releases gauge the health of the economy and can impact the value of the Pound Sterling. Indicators such as GDP, Manufacturing and Services PMIs, and employment can all influence the direction of the GBP. A strong economy is good for Sterling. Not only does it attract more foreign investment but it may encourage the BoE to put up interest rates, which will directly strengthen GBP. Otherwise, if economic data is weak, the Pound Sterling is likely to fall.
Another significant data release for the Pound Sterling is the Trade Balance. This indicator measures the difference between what a country earns from its exports and what it spends on imports over a given period. If a country produces highly sought-after exports, its currency will benefit purely from the extra demand created from foreign buyers seeking to purchase these goods. Therefore, a positive net Trade Balance strengthens a currency and vice versa for a negative balance.
GBP/USD edges up after bottoming out at 1.3010, with a ‘hammer’ pattern signaling potential for further upside.
Clearing the October 10 high of 1.3093 and the 50-DMA at 1.3099 would open the door for buyers, with resistance at 1.3113 and 1.3134.
A failure to break 1.3100 could see sellers push the pair back toward the week’s low of 1.3010.
The Pound Sterling recovers some ground against the greenback as a ‘hammer’ emerges on the daily chart and rises above 1.3050, registering gains of over 0.15%. Goodish economic data in the UK sponsored the GBP/USD’s recovery as the economy grew around estimates. Nevertheless, a slightly hot Producer Price Index (PPI) report in the US capped the GBP’s gains.
GBP/USD Price Forecast: Technical outlook
The GBP/USD seems to have bottomed out after retreating from yearly highs of 1.3434 to a daily low of 1.3010 on October 10. A ‘hammer’ formation preceded by a downtrend hints that a reversal is possible.
Nevertheless, the pair should clear the October 10 high of 1.3093, immediately followed by the 50-day moving average (DMA) at 1.3099, so buyers could remain hopeful of higher exchange rates.
In that outcome, the GBP/USD next resistance would be the 1.3100 figure, followed by the October 8 high at 1.3113. On further strength, the next supply zone will be the October 7 weekly high of 1.3134.
Conversely, if GBP/USD fails to clear 1.3100, sellers could step in and push prices below the psychological 1.3050 level, driving the exchange rate toward the week’s lows at 1.3010.
From a momentum standpoint, the GBP/USD is barely biased, but the Relative Strength Index (RSI) has increased upwards during the last couple of days, opening the door for a leg-up.
GBP/USD Price Action – Daily Chart
British Pound PRICE Today
The table below shows the percentage change of British Pound (GBP) against listed major currencies today. British Pound was the strongest against the Japanese Yen.
USD
EUR
GBP
JPY
CAD
AUD
NZD
CHF
USD
-0.14%
-0.14%
0.45%
0.12%
-0.13%
-0.11%
0.12%
EUR
0.14%
-0.05%
0.54%
0.21%
-0.00%
-0.03%
0.20%
GBP
0.14%
0.05%
0.59%
0.26%
0.06%
0.02%
0.27%
JPY
-0.45%
-0.54%
-0.59%
-0.33%
-0.55%
-0.57%
-0.40%
CAD
-0.12%
-0.21%
-0.26%
0.33%
-0.23%
-0.24%
0.00%
AUD
0.13%
0.00%
-0.06%
0.55%
0.23%
-0.04%
0.19%
NZD
0.11%
0.03%
-0.02%
0.57%
0.24%
0.04%
0.25%
CHF
-0.12%
-0.20%
-0.27%
0.40%
-0.01%
-0.19%
-0.25%
The heat map shows percentage changes of major currencies against each other. The base currency is picked from the left column, while the quote currency is picked from the top row. For example, if you pick the British Pound from the left column and move along the horizontal line to the US Dollar, the percentage change displayed in the box will represent GBP (base)/USD (quote).
USD/JPY edges higher, trading within a range of 148.00-149.50 as US 10-year yields rise to 4.104%.
Momentum favors buyers, with a break above 149.50, exposing the key 150.00 level and resistance at the 200/100-DMA confluence at 151.20/21.
A drop below 149.00 could lead to a pullback toward the October 8 swing low of 147.35.
The USD/JPY edged higher during the North American session as US Treasury yields remained higher, particularly the 10-year T-note, which was up close to four basis points at 4.104%. The positive correlation between the US 10-year yield and the pair pushed the exchange rate to 149.13, up 0.37%.
USD/JPY Price Forecast: Technical outlook
The USD/JPY is still neutrally biased, though trading in a higher range within the 148.00-149.50 area, as traders decipher the Fed and the Bank of Japan’s next move.
From a momentum standpoint, buyers remain in charge, yet the Relative Strength Index (RSI) hasn’t reached a new peak to push USD/JPY prices higher.
If USD/JPY clears the 149.50 area, this will immediately expose the 150.00 figure. Once removed, the next resistance would be the 200 and 100-day moving averages (DMAs) confluence at 151.20/21.
Conversely, if the pair drops below 149.00, look for a pullback toward the October 8 swing low of 147.35.
USD/JPY Price Action – Daily Chart
Japanese Yen PRICE Today
The table below shows the percentage change of Japanese Yen (JPY) against listed major currencies today. Japanese Yen was the strongest against the Canadian Dollar.
USD
EUR
GBP
JPY
CAD
AUD
NZD
CHF
USD
-0.05%
-0.07%
0.39%
0.17%
-0.20%
-0.28%
0.12%
EUR
0.05%
-0.05%
0.38%
0.17%
-0.16%
-0.28%
0.10%
GBP
0.07%
0.05%
0.45%
0.24%
-0.10%
-0.21%
0.19%
JPY
-0.39%
-0.38%
-0.45%
-0.24%
-0.56%
-0.67%
-0.36%
CAD
-0.17%
-0.17%
-0.24%
0.24%
-0.34%
-0.43%
-0.03%
AUD
0.20%
0.16%
0.10%
0.56%
0.34%
-0.13%
0.27%
NZD
0.28%
0.28%
0.21%
0.67%
0.43%
0.13%
0.41%
CHF
-0.12%
-0.10%
-0.19%
0.36%
0.03%
-0.27%
-0.41%
The heat map shows percentage changes of major currencies against each other. The base currency is picked from the left column, while the quote currency is picked from the top row. For example, if you pick the Japanese Yen from the left column and move along the horizontal line to the US Dollar, the percentage change displayed in the box will represent JPY (base)/USD (quote).
During my daily analysis of the EUR/USD pair, I noticed that we are at a couple of major areas that could come into the picture and offer a bit of volatility.
This does make a certain amount of sense considering that the CPI numbers in the United States came out slightly higher than expected, so I think you have a situation where traders are simply trying to sort out where they are going to go next.
I think that the next 24 hours could be very messy to say the least.
Technical Analysis
The technical analysis for this pair does make me believe that there are buyers coming sooner rather than later, but at this point in time I think you’ve got a situation where there is some questions to be asked of the fundamental analysis. As far as the charges are concerned, it is worth noting that the market dropped toward the 200 Day EMA, but then turned around to show signs of life. Because of this, the market has the look of a market that could form a bit of a hammer. All things being equal, the market bouncing from here could open up the possibility of a move to the 1.10 level, which of course is a large, round, psychologically significant figure. Above there, we have the 1.1040 level where the 50 Day EMA comes into the picture, and it would offer a little bit of technical resistance.
If we were to break down below the 1.09 level, then I think the euro is in serious trouble, but until that actually happens on a daily close, I think we are more likely than not to see some type of bounce in this market, because quite frankly at this point, we are been oversold. I have no interest in trying to get too cute with this, but I do recognize that the short term probably favors the overall upside more than anything else, at least for a quick recovery bounce.
This site is managed by Teletrade D.J. LLC 2351 LLC 2022 (Euro House, Richmond Hill Road, Kingstown, VC0100, St. Vincent and the Grenadines).
The information on this website is for informational purposes only and does not constitute any investment advice.
The company does not serve or provide services to customers who are residents of the US, Canada, Iran, The Democratic People’s Republic of Korea, Yemen and FATF blacklisted countries.
Making transactions on financial markets with marginal financial instruments opens up wide possibilities and allows investors who are willing to take risks to earn high profits, carrying a potentially high risk of losses at the same time. Therefore you should responsibly approach the issue of choosing the appropriate investment strategy, taking the available resources into account, before starting trading.
Use of the information: full or partial use of materials from this website must always be referenced to TeleTrade as the source of information. Use of the materials on the Internet must be accompanied by a hyperlink to teletrade.org. Automatic import of materials and information from this website is prohibited.
Please contact our PR department if you have any questions or need assistance at pr@teletrade.global.
EUR/USD recovers modestly after testing 1.0900 on Thursday.
The technical outlook points to a loss of bearish momentum.
The US economic calendar will feature producer inflation data for September.
After touching its weakest level since early August at 1.0900 on Thursday, EUR/USD staged a rebound and closed the day unchanged. The pair edges higher and trades at around 1.0950 in the European session on Friday.
Euro PRICE This week
The table below shows the percentage change of Euro (EUR) against listed major currencies this week. Euro was the weakest against the Swiss Franc.
USD
EUR
GBP
JPY
CAD
AUD
NZD
CHF
USD
0.20%
0.32%
0.00%
1.43%
0.82%
1.01%
-0.29%
EUR
-0.20%
0.18%
-0.16%
1.28%
0.60%
0.80%
-0.52%
GBP
-0.32%
-0.18%
-0.37%
1.08%
0.42%
0.65%
-0.58%
JPY
0.00%
0.16%
0.37%
1.42%
0.79%
0.95%
-0.27%
CAD
-1.43%
-1.28%
-1.08%
-1.42%
-0.57%
-0.42%
-1.69%
AUD
-0.82%
-0.60%
-0.42%
-0.79%
0.57%
0.25%
-1.07%
NZD
-1.01%
-0.80%
-0.65%
-0.95%
0.42%
-0.25%
-1.25%
CHF
0.29%
0.52%
0.58%
0.27%
1.69%
1.07%
1.25%
The heat map shows percentage changes of major currencies against each other. The base currency is picked from the left column, while the quote currency is picked from the top row. For example, if you pick the Euro from the left column and move along the horizontal line to the US Dollar, the percentage change displayed in the box will represent EUR (base)/USD (quote).
The initial reaction to September inflation data from the US caused EUR/USD to push lower in the early American trading hours on Thursday. The disappointing labor market data, however, made it difficult for the US Dollar (USD) to preserve its strength, paving the way for a recovery in the pair.
The US Bureau of Labor Statistics announced on Thursday that inflation in the US, as measured by the change in the Consumer Price Index (CPI), declined to 2.4% on a yearly basis in September from 2.5% in August. The core CPI, which excludes volatile food and energy prices, rose 3.3% on a yearly basis, coming in above the August reading and the market forecast of 3.2%. Finally, the monthly core CPI increased 0.3%. On a negative note, weekly Initial Jobless Claims rose to 258,000 in the week ending October 5 from 225,000 in the previous week.
Later in the day, the Producer Price Index (PPI) data will be featured in the US economic calendar. Investors expect the monthly core PPI to rise 0.2% in September, following the 0.3% increase recorded in August. In case the monthly core PPI comes in above the market expectation, the USD could hold its ground heading into the weekend and cap EUR/USD’s upside.
EUR/USD Technical Analysis
The Relative Strength Index (RSI) indicator on the 4-hour chart rose above 40 early Friday, reflecting a loss of bearish momentum. 1.0950 (20-period Simple Moving Average (SMA), Fibonacci 61.8% retracement of the latest uptrend) aligns as a pivot level for EUR/USD. Once this level is confirmed as support, 1.1000 (Fibonacci 50% retracement) and 1.1050 (Fibonacci 38.2% retracement) could be seen as next resistance levels.
If 1.0950 continues to hold as resistance, supports could be spotted at 1.0900 (round level), 1.0870 (Fibonacci 78.6% retracement) and 1.0800 (round level).
Euro FAQs
The Euro is the currency for the 19 European Union countries that belong to the Eurozone. It is the second most heavily traded currency in the world behind the US Dollar. In 2022, it accounted for 31% of all foreign exchange transactions, with an average daily turnover of over $2.2 trillion a day. EUR/USD is the most heavily traded currency pair in the world, accounting for an estimated 30% off all transactions, followed by EUR/JPY (4%), EUR/GBP (3%) and EUR/AUD (2%).
The European Central Bank (ECB) in Frankfurt, Germany, is the reserve bank for the Eurozone. The ECB sets interest rates and manages monetary policy. The ECB’s primary mandate is to maintain price stability, which means either controlling inflation or stimulating growth. Its primary tool is the raising or lowering of interest rates. Relatively high interest rates – or the expectation of higher rates – will usually benefit the Euro and vice versa. The ECB Governing Council makes monetary policy decisions at meetings held eight times a year. Decisions are made by heads of the Eurozone national banks and six permanent members, including the President of the ECB, Christine Lagarde.
Eurozone inflation data, measured by the Harmonized Index of Consumer Prices (HICP), is an important econometric for the Euro. If inflation rises more than expected, especially if above the ECB’s 2% target, it obliges the ECB to raise interest rates to bring it back under control. Relatively high interest rates compared to its counterparts will usually benefit the Euro, as it makes the region more attractive as a place for global investors to park their money.
Data releases gauge the health of the economy and can impact on the Euro. Indicators such as GDP, Manufacturing and Services PMIs, employment, and consumer sentiment surveys can all influence the direction of the single currency. A strong economy is good for the Euro. Not only does it attract more foreign investment but it may encourage the ECB to put up interest rates, which will directly strengthen the Euro. Otherwise, if economic data is weak, the Euro is likely to fall. Economic data for the four largest economies in the euro area (Germany, France, Italy and Spain) are especially significant, as they account for 75% of the Eurozone’s economy.
Another significant data release for the Euro is the Trade Balance. This indicator measures the difference between what a country earns from its exports and what it spends on imports over a given period. If a country produces highly sought after exports then its currency will gain in value purely from the extra demand created from foreign buyers seeking to purchase these goods. Therefore, a positive net Trade Balance strengthens a currency and vice versa for a negative balance.
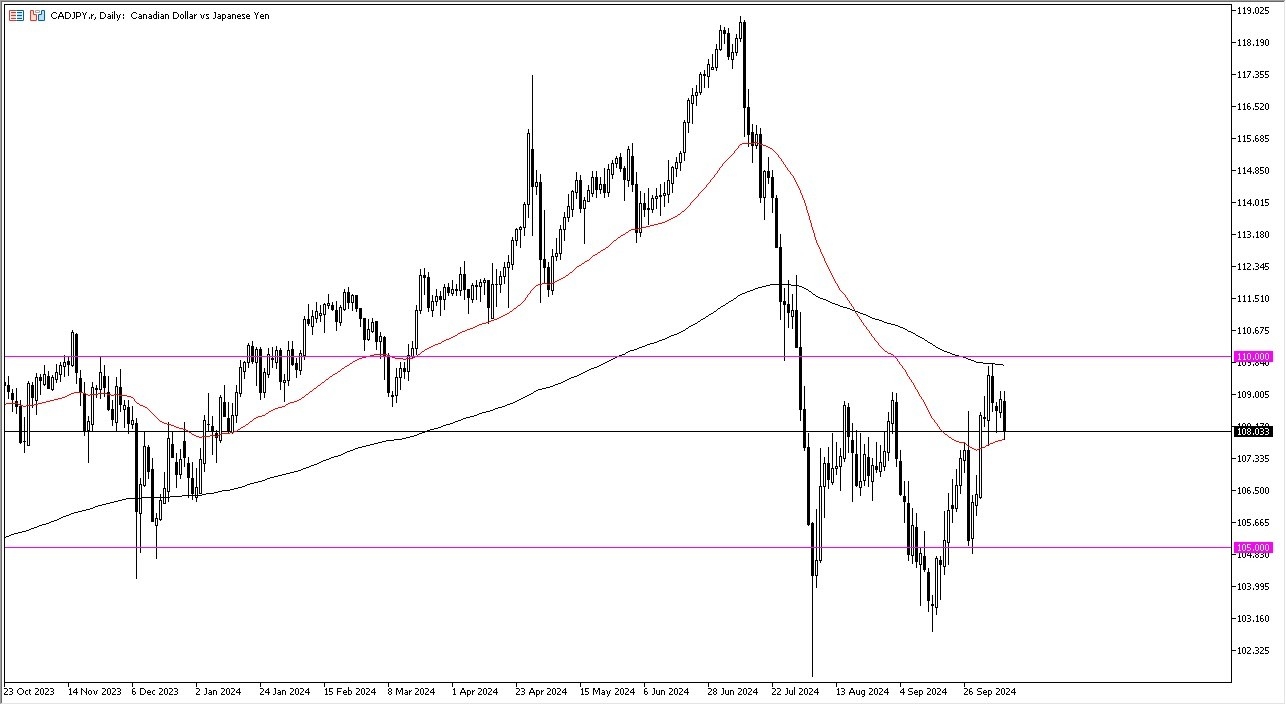
The Canadian dollar initially tried to rally against the yen, but then fell rather hard as we continue to see a lot of volatility.
That’s not a huge surprise as this is a market that is going to have a lot of crosswinds, not the least of which is going to be the fact that Friday features the Canadian jobs report. So do keep that in mind.
That being said, the Japanese yen strengthening could be due to a little bit of risk off, or it could just simply be due to the fact that the market had rallied so significantly against the yen over the last week or so. And when I say the market, I am referring to the currency markets in general. It’s not just the Canadian dollar that’s been positive.
The 200 Day EMA
It’s probably worth noting that we pulled back from the 200 day EMA, but if we can break higher from here, then I think we challenge that indicator again. Remember, the 200 day EMA is typically watched by technical traders rather closely for an eye on what happens with the trend. Above there, we have the 110 yen level, which of course is a large round psychologically significant figure, and also an area that sees a little bit of market memory. If we can get above that level, then 112 yen is your target. On a pullback below the 50-day EMA, perhaps somewhere around 107.50 yen, you could see buyers come in. Anything below there opens up a door back down to the 105 yen level, which would obviously be very negative as market participants continue to try to gauge what the risk appetite around the world is.
Furthermore, keep in mind this is almost a pure play on crude oil because Canada is an oil exporter and Japan imports 100% of its crude oil, so this might move with the oil markets as well.
The UK economy expanded by 0.2%, coming in line with economists forecasts.
The CPI report in the US revealed that inflation was higher than expected in September.
US unemployment claims rose more than expected, indicating a weaker labor market.
The GBP/USD price analysis shows a small rebound in the pound after data revealed growth in the UK economy. Meanwhile, the dollar hovered near yesterday’s peaks after inflation numbers came in higher than expected.
–Are you interested to learn more about day trading brokers? Check our detailed guide-
Data on Friday revealed that the UK economy expanded by 0.2%, coming in line with economists forecasts. However, investors maintained bets for a Bank of England rate cut during the November meeting.
Meanwhile, the CPI report in the US revealed that inflation was higher than expected in September. On a monthly basis, consumer prices increased by 0.2%, above forecasts of 0.1%. Meanwhile, annually, prices increased by 2.4%, above estimates of 2.3%. The unexpected jump led to a decline in Fed rate cut expectations, boosting the US dollar.
However, unemployment claims rose more than expected, indicating a weaker labor market. The mix of data put bets for a 25-bps November Fed rate cut at 80%. At the same time, market participants are pricing a 20% chance that the Fed will keep rates unchanged.
The next major report will be the Producer Price Index. Economists expect wholesale inflation to increase by 0.1%, down from 0.2% in August. If wholesale inflation also beats forecasts, rate cut expectations will keep falling.
Meanwhile, markets are paying close attention to Middle East tensions. The likelihood of a ceasefire between Israel and Hezbollah eased fears of escalation. However, there is still a risk of retaliation after Iran attacked Israel.
GBP/USD key events today
US Core PPI m/m
US PPI m/m
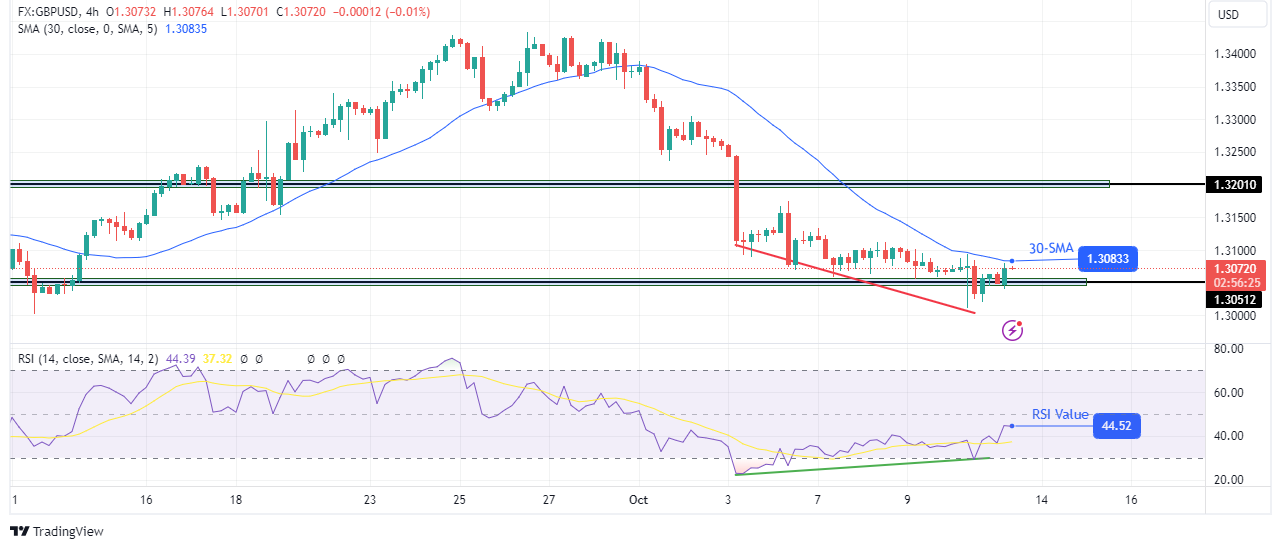
GBP/USD technical price analysis: Bearish momentum fades near 1.3051 support
GBP/USD 4-hour chart
On the technical side, the GBP/USD price remains in a tight consolidation near the 1.3051 support level. The bias is bearish because the price sits slightly below the 30-SMA. At the same time, the RSI trades below 50, supporting bearish momentum.
-Are you looking for the best AI Trading Brokers? Check our detailed guide-
However, the RSI has made a bullish divergence, indicating weakness in the downtrend. If it plays out, the price might break above the 30-SMA, showing a bullish reversal. A break above the SMA would allow GBP/USD to revisit the 1.3201 level.
Looking to trade forex now? Invest at eToro!
67% of retail investor accounts lose money when trading CFDs with this provider. You should consider whether you can afford to take the high risk of losing your money.
While producer prices are important, consumer sentiment trends could offer insight into consumer spending trends. Economists expect the Michigan Consumer Sentiment Index to rise from 70.1 in September to 70.8 in October. Improving sentiment may signal stronger demand, possibly offsetting the influence of producer prices on Fed policy bets.
Upbeat US data could drive the USD/JPY toward 150. However, weak numbers may signal a drop toward 147.5.
Short-term Forecast for USD/JPY
USD/JPY trends will likely hinge on the US data and central bank commentary. Softer producer prices and a fall in consumer sentiment could retrigger bets on a 50-basis point Fed rate cut. However, central bank commentary will be crucial following this week’s economic data releases.
Traders should stay alert as monetary policy chatter, Japan’s economic data, and the US economic indicators will affect trading USD/JPY strategies. Monitor real-time data, central bank views, and expert commentary to adjust your trading strategies accordingly. Stay ahead of the market with our expert insights.
USD/JPY Technical Analysis
Daily Chart
The USD/JPY hovers well above the 50-day EMA while remaining below the 200-day EMA, sending bullish near-term but bearish longer-term price signals.
A USD/JPY break above the 200-day EMA could support a move toward the trend line and the 151.685 resistance level. Selling pressure could intensify at the resistance level. The trend line is confluent with it.
Consumer sentiment, producer prices, and central bank commentary require close monitoring.
Conversely, a break below the 148.529 support level could signal a fall to 147.5. A drop through 147.5 could give the bears a run at the 50-day EMA.
The 14-day RSI at 61.73 suggests a USD/JPY return to 150 before entering overbought territory.