The main tag of Forex News Today Articles.
You can use the search box below to find what you need.
[wd_asp id=1]
14
08, 2024
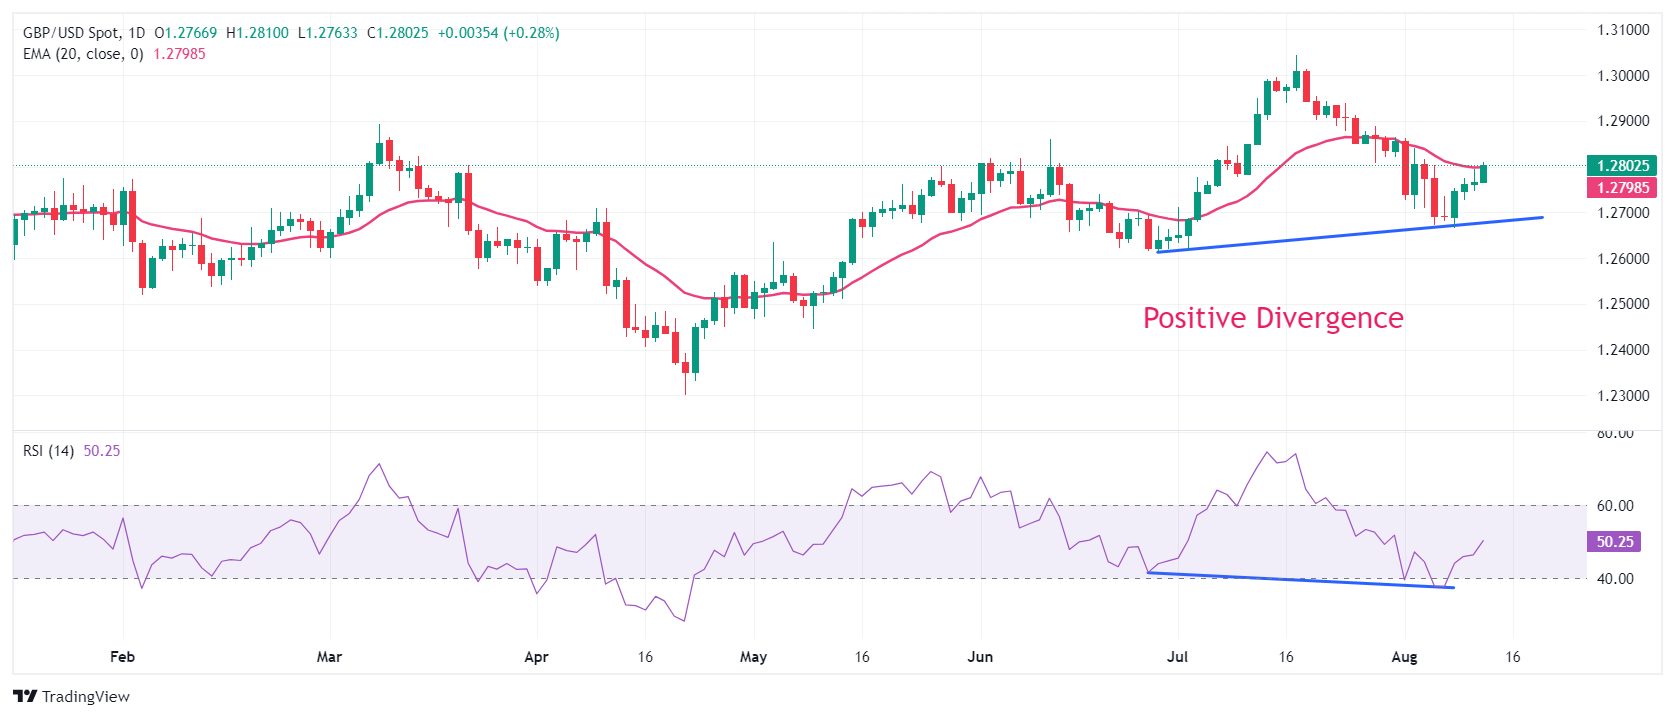
GBP/USD needs to clear 1.2810-1.2820 to stretch higher
GBP/USD Forecast: Pound Sterling needs to clear 1.2810-1.2820 to stretch higher
GBP/USD gained traction in the early European session on Tuesday and climbed above 1.2800 for the first time in a week. The pair could stretch higher if it manages to clear the resistance area located at 1.2810-1.2820.
The UK’s Office for national Statistics reported on Tuesday that the ILO Unemployment Rate declined to 4.2% in the three months to June from 4.4%. This reading came in below the market expectation of 4.5%. Additionally, the annual wage inflation, as measured by the change in the Average Earnings Excluding Bonus, edged lower to 5.4% in the same period from 5.7%, coming in above analysts’ estimate of 4.6%. With the immediate reaction, Pound Sterling gathered strength against its major rivals. Read more…
Pound Sterling climbs above 1.2800 as UK Unemployment rate unexpectedly falls
The Pound Sterling (GBP) delivers a sharp upside move against its major peers in Tuesday’s London session. The British currency strengthens as the United Kingdom (UK) Office for National Statistics (ONS) reported upbeat labor market data for the three months ending in June, which has weighed on market expectations of subsequent interest-rate cuts by the Bank of England (BoE).
The agency reported that the ILO Unemployment Rate unexpectedly declined to 4.2%. Economists expected the jobless rate to have increased to 4.5% from the prior release of 4.4%. Read more…


")


")


